This report is an updated version of the report published on 12 August 2025 at 3:19 PM AEST.
Lycopodium Ltd (ASX: LYL)
Lycopodium Limited is an Australia-based company, which provides integrated engineering, construction and asset management solutions. The Company's segments include Resources, Rail Infrastructure, Industrial Processes and Other.
Recommendation Rationale – SELL at AUD 12.120
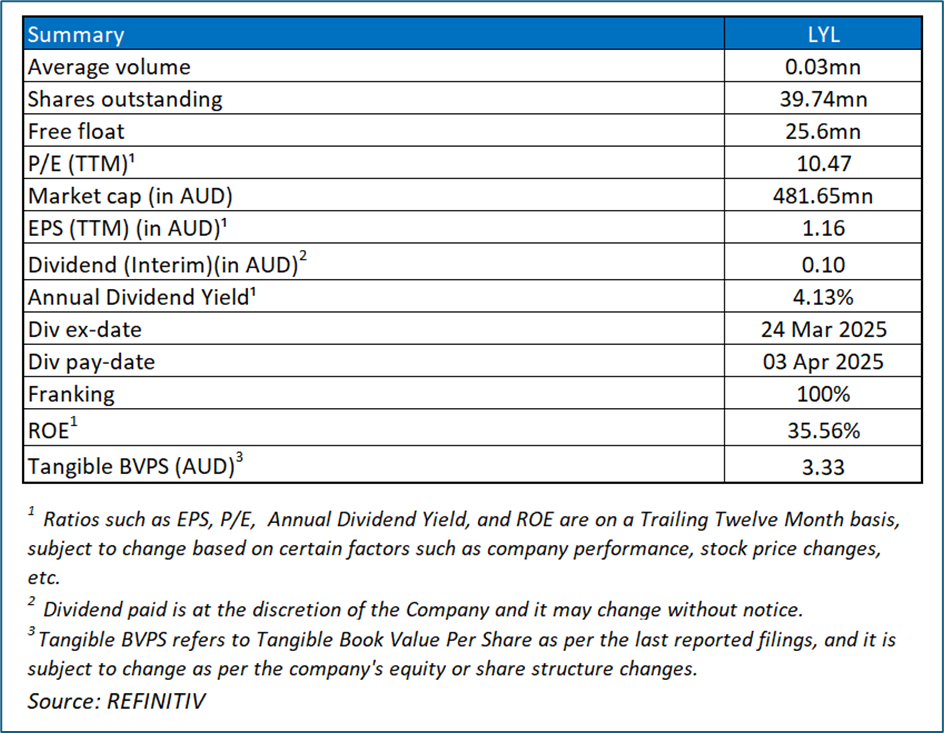
- Technical Standpoint: LYL’s share price has surpassed the R2 level recommended on 25 June 2025. The 14-day RSI is now around 70.58, approaching overbought territory. This upward movement raises the likelihood of a near-term pullback as profit-taking sets in, increasing the risk of short-term consolidation or downside retracement.
- Revenue Decline Across All Segments: Revenue fell in H1 FY25 YoY, with all major segments reporting declines. Resources revenue decreased from AUD 191.0 million to AUD 172.3 million. The Company also witnessed a softer project activity and reduced client demand across the business.
- Rising Short-Term Borrowings and Liabilities: Short-term borrowings increased sharply from AUD 289,624 as of 31 December 2023 to AUD 9.26 million as of 31 December 2024. Total current liabilities also grew from AUD 77.1 million to AUD 97.1 million over the same period, raising concerns about liquidity and financial flexibility amid increased short-term debt obligations.
- Profit Decline: The profit decline for Lycopodium Limited (LYL) in the first half of FY25 is primarily due to the lumpy nature of their revenue and earnings, which are heavily influenced by the timing of contract payments and project completions.
Daily Price Chart
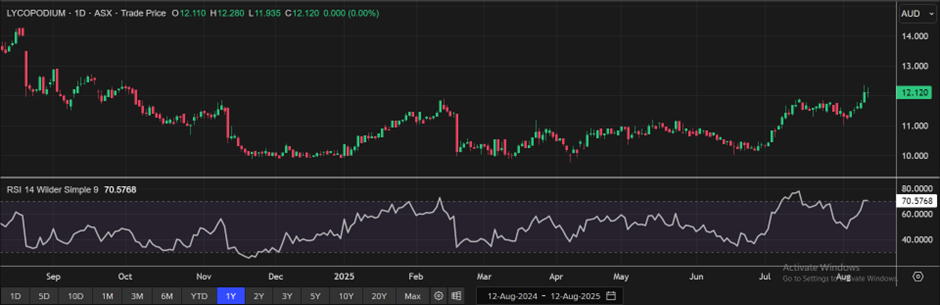
(Source: REFINITIV; Analysis by Kalkine Group)
Valuation Methodology: Price/Earnings Multiple Approach (FY June'26E) (Illustrative)
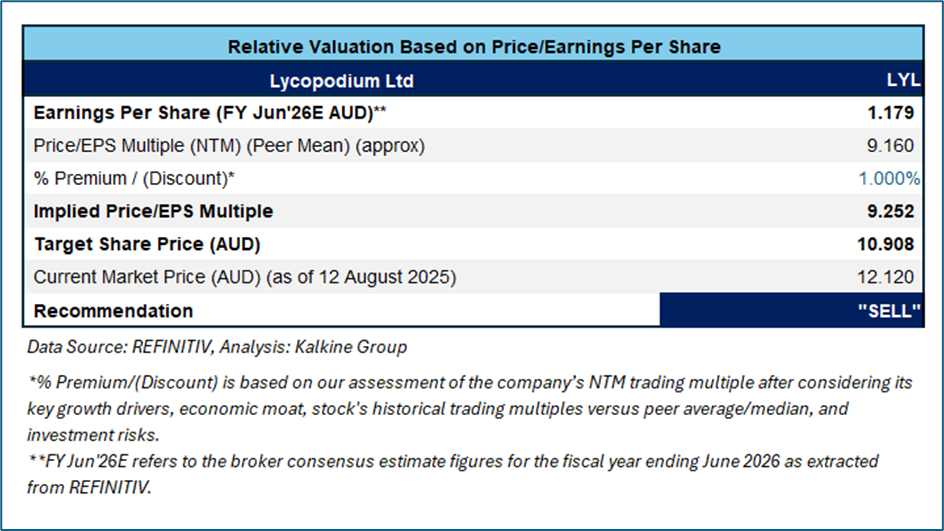
Stock might trade at a slight premium to its peers considering the recent EPCM contract award for Nyanzaga project, NPAT % well above target of +10% in H1 FY25, and around 4% of annual dividend yield. For conducting the valuation, the following peers included: Qantas Airways Ltd (ASX: LYL), Acrow Ltd (ASX: ACF), and IPH Ltd (ASX: IPH).
Given its current trading levels, recent rally in the share price, and risks associated, it is prudent to sell the stock at the current levels. Hence, a ‘Sell’ recommendation is given on the stock at the current market price of AUD 12.120, as of 12 August 2025 at 3:16 PM AEST.
Markets are trading in a highly volatile zone currently due to certain macro-economic issues and geopolitical issues prevailing geopolitical tensions. Therefore, it is prudent to follow a cautious approach while investing.
Note 1: Past performance is neither an indicator nor a guarantee of future performance.
Note 2: The reference date for all price data, currency, technical indicators, support, and resistance levels is 12 August 2025. The reference data in this report has been partly sourced from REFINITIV.
Note 3: Investment decisions should be made depending on an individual's appetite for upside potential, risks, holding duration, and any previous holdings. An 'Exit' from the stock can be considered if the Target Price mentioned as per the Valuation and or the technical levels provided has been achieved and is subject to the factors discussed above.
Note 4: Kalkine reports are prepared based on the stock prices captured either from REFINITIV or Trading View. Typically, REFINITIV or Trading View may reflect stock prices with a delay which could be a lag of 25-30 minutes. There can be no assurance that future results or events will be consistent with the information provided in the report. The information is subject to change without any prior notice.
Note 5: Dividend Yield may vary as per the stock price movement.
Technical Indicators Defined: -
Support: A level at which the stock prices tend to find support if they are falling, and downtrend may take a pause backed by demand or buying interest.
Resistance: A level at which the stock prices tend to find resistance when they are rising, and uptrend may take a pause due to profit booking or selling interest.
Stop-loss: In general, it is a level to protect further losses in case of any unfavourable movement in the stock prices.

 Please wait processing your request...