This report is an updated version of the report published on 22 July 2025 at 3:20 PM AEST.
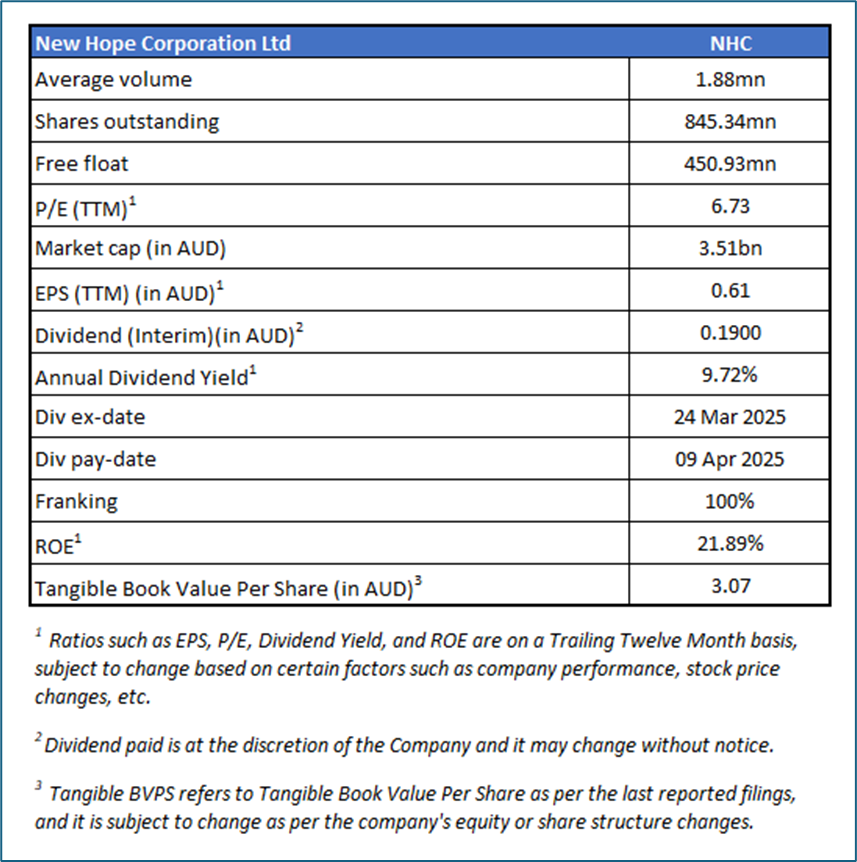
New Hope Corporation Limited (ASX: NHC)
New Hope Corporation Limited is a coal producer with associated port, oil and gas, and agricultural operations. The Company operates the Bengalla Mine in New South Wales and the New Acland Mine in southeast Queensland, with coal primarily exported to customers in Asia. Its agricultural enterprises are located near its coal mines.
Recommendation Rationale – SELL at AUD 4.220
- Technical Standpoint: NHC’s share price has surpassed the R1 level recommended on 2 July 2025. Also, the momentum oscillatory (14-day RSI is around 68.12 level), indicating that the stock is approaching overbought territory. This shows increasing the likelihood of near-term consolidation or technical pullback.
- EBITDA Decline: In Q3 FY25 (three months ended 30 April 2025), underlying EBITDA fell to AU$155.2 million, a 0% decline quarter-on-quarter compared to Q2 FY25. The decline was driven by weaker realised pricing across the group, despite stable coal sales volumes at Bengalla and New Acland.
- Broad-Based Pricing Pressure: During Q3 FY25, benchmark thermal coal prices fell sharply, with the gC NEWC index down 24% QoQ to US$97.5/t. Group realised pricing declined 10% in USD terms and 7% in AUD terms, while Bengalla’s average realised price fell 9%. These pricing pressures compressed margins across both assets.
- Reduced Operational Efficiency: In Q3 FY25, the group reported a strip ratio of 4.0x, up from 5x in Q2 FY25, reflecting a 16% quarter-on-quarter increase. This indicates higher waste movement relative to coal extracted, implying rising unit costs in a softer pricing environment.
NHC Daily Chart
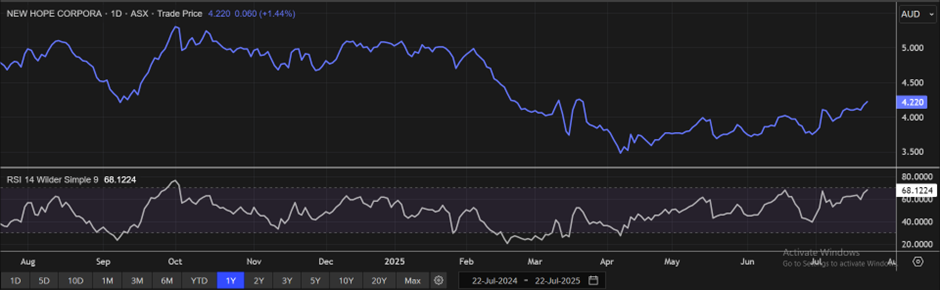
(Source: REFINITIV; Analysis by Kalkine Group)
Valuation Methodology: Price/Cash Flow Approach (FY July'26E) (Illustrative)
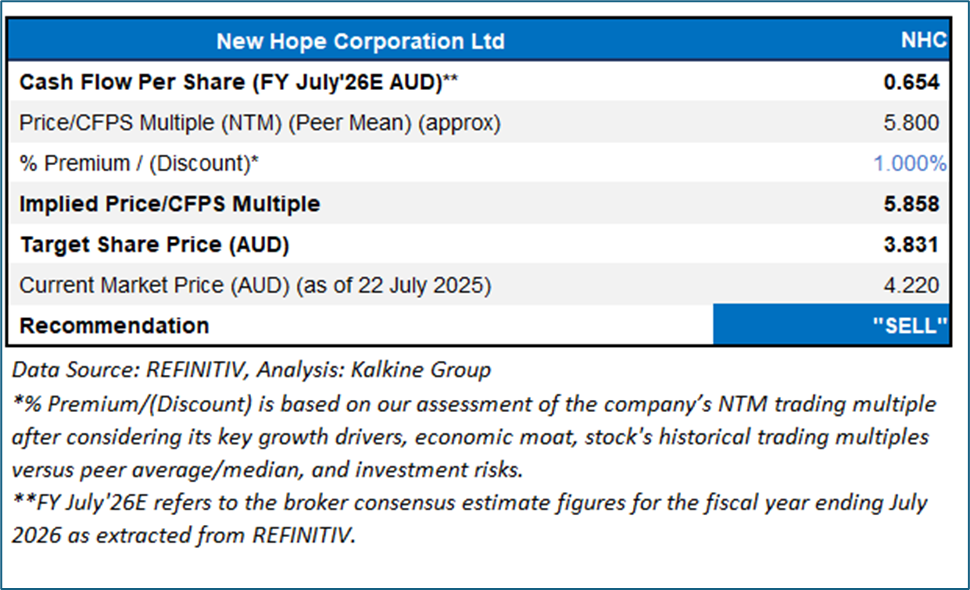
NHC can trade at a slight premium than peers given its 56% YoY increase in H1 FY25’s ROM coal production (driven by higher output from both Bengalla and the ramp-up at New Acland), 44% YoY increase in H1 FY25 coal sales, and increased cash generated from operations (supporting shareholder returns).
For conducting the valuation, the following peer companies have been considered: Champion Iron Ltd (ASX: CIA), Iluka Resources Ltd (ASX: ILU), South32 Ltd (ASX: S32) and others.
Given its current trading levels, recent rally in the share price, and risks associated, it is prudent to sell the stock at the current levels. Hence, a ‘Sell’ recommendation is given on the stock at the current market price of AUD 4.22, as of 22 July 2025 at 2:40 PM AEST.
Markets are trading in a highly volatile zone currently due to certain macro-economic issues and geopolitical issues prevailing geopolitical tensions. Therefore, it is prudent to follow a cautious approach while investing.
Note 1: Past performance is neither an indicator nor a guarantee of future performance.
Note 2: The reference date for all price data, currency, technical indicators, support, and resistance levels is 22 July 2025. The reference data in this report has been partly sourced from REFINITIV.
Note 3: Investment decisions should be made depending on an individual's appetite for upside potential, risks, holding duration, and any previous holdings. An 'Exit' from the stock can be considered if the Target Price mentioned as per the Valuation and or the technical levels provided has been achieved and is subject to the factors discussed above.
Note 4: Kalkine reports are prepared based on the stock prices captured either from REFINITIV or Trading View. Typically, REFINITIV or Trading View may reflect stock prices with a delay which could be a lag of 25-30 minutes. There can be no assurance that future results or events will be consistent with the information provided in the report. The information is subject to change without any prior notice.
Note 5: Dividend Yield may vary as per the stock price movement.
Technical Indicators Defined: -
Support: A level at which the stock prices tend to find support if they are falling, and downtrend may take a pause backed by demand or buying interest.
Resistance: A level at which the stock prices tend to find resistance when they are rising, and uptrend may take a pause due to profit booking or selling interest.
Stop-loss: In general, it is a level to protect further losses in case of any unfavourable movement in the stock prices.

 Please wait processing your request...