This report is an updated version of the report published on 26 February 2025 at 11:29 AM AEDT.
Cettire Limited (ASX: CTT)
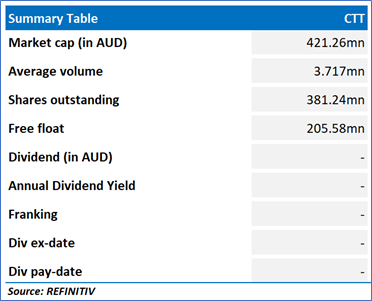
CTT is a global luxury online platform. Through its website, cettire.com, the company provides access to over 2,500 prestigious brands and more than 500,000 products, including clothing, shoes, bags, and accessories.
Recommendation Rationale - SELL at AUD 1.26
- Profit Declines: In H1FY25, CTT's sales revenue increased by 11% year-on-year to AUD 394mn vs AUD 354mn in H1FY24. However, its adjusted EBITDA declined by ~54% annually to AUD 12.12mn vs AUD 26.09mn in pcp and adjusted net profit after tax plunged by 50.50% to AUD 8.12mn vs AUD 16.41mn in H1FY24.
- Technical Observation: CTT is in a sustained downtrend. Its 50-day MA remains above the 21-day MA, reinforcing bearish sentiment. RSI at ~46.28 suggests weakness. A breakout above AUD 1.30 may signal recovery, while further decline risks new lows.
- Overvalued Multiples: On a trailing 12-month basis – key trading multiples (EV/EBITDA, Price/Earnings, Price/Cash Flow and Price/Book Value) are higher than the median of the Specialty Retailer industry.
- Cautious Outlook - In its FY25 outlook, CTT management highlighted ongoing uncertainty in the global luxury personal goods market, with softening demand impacting the industry despite some positive developments. The company experienced slower sales growth in early H2FY25 following a strong peak trading period. Management expects Q3 to remain challenging, given the elevated comparable period in FY24.
CTT Daily Price Chart
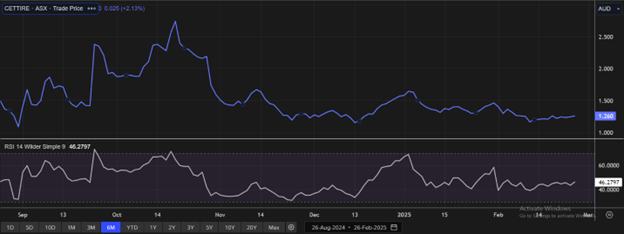
CTT Daily Technical Chart, Data Source: REFINITIV
Valuation Methodology: Price/Earnings Approach (FY June'25E) (Illustrative)
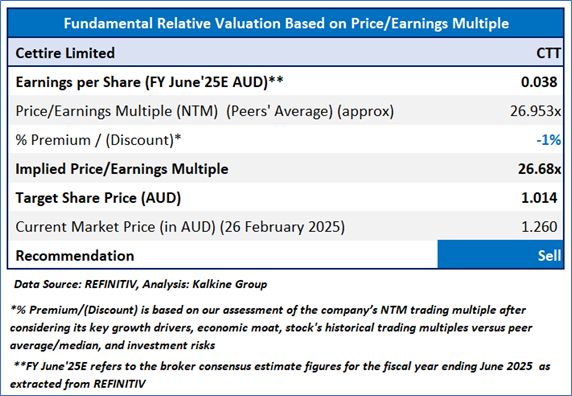
CTT is expected to trade at a slight discount to its peers considering the cautious outlook shared by management, decline in H1FY25 EBITDA and NPAT, impact of US tariff changes on CTT's future earnings. For conducting valuation, the following peers have been considered: Temple & Webster Group Ltd (ASX: TPW), Lovisa Holdings Ltd (ASX: LOV), Universal Store Holdings Ltd (ASX: UNI), and others.
Considering that the company has reported EBITDA and NPAT decline in H1FY25, cautious outlook for FY25, technical chart observation, recent rally in share price, current trading level, and risks associated, the share price can witness resistance at the current levels. Hence, a ‘Sell’ recommendation is given on the stock at the current market price of AUD 1.26, as of 26 February 2025, at 10:09 AM AEDT..
Markets are trading in a highly volatile zone currently due to certain macro-economic issues and geopolitical issues prevailing geopolitical tensions. Therefore, it is prudent to follow a cautious approach while investing.
Note 1: Past performance is neither an indicator nor a guarantee of future performance.
Note 2: The reference date for all price data, currency, technical indicators, support, and resistance levels is 26 February 2025. The reference data in this report has been partly sourced from REFINITIV.
Note 3: Investment decisions should be made depending on an individual's appetite for upside potential, risks, holding duration, and any previous holdings. An 'Exit' from the stock can be considered if the Target Price mentioned as per the Valuation and or the technical levels provided has been achieved and is subject to the factors discussed above.
Note 4: Kalkine reports are prepared based on the stock prices captured either from REFINITIV or Trading View. Typically, REFINITIV or Trading View may reflect stock prices with a delay which could be a lag of 25-30 minutes. There can be no assurance that future results or events will be consistent with the information provided in the report. The information is subject to change without any prior notice.
Technical Indicators Defined: -
Support: A level at which the stock prices tend to find support if they are falling, and downtrend may take a pause backed by demand or buying interest.
Resistance: A level at which the stock prices tend to find resistance when they are rising, and uptrend may take a pause due to profit booking or selling interest.
Stop-loss: In general, it is a level to protect further losses in case of any unfavourable movement in the stock prices.

 Please wait processing your request...