This report is an updated version of the report published on 2 December 2025 at 12:40 PM AEDT.
WEB Travel Group Limited (ASX: WEB)
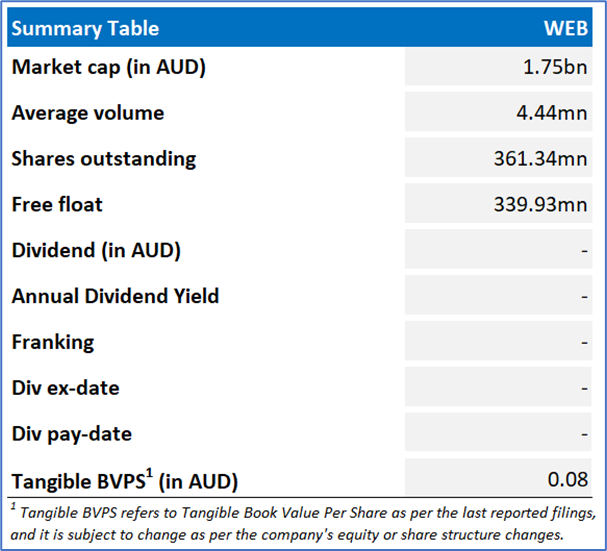
WEB Travel Group Limited (ASX: WEB), formerly Webjet Limited, is an Australia-based global business to business (B2B) travel distribution company. The Company connects travel sellers with travel buyers across all major global markets.
Recommendation Rationale – SELL at AUD 4.860
- Surpassed Resistance: WEB’s share price surpassed its R2 level recommended on 20 November 2025. Therefore, share price can face correction at the current levels.
- Technical Standpoint: The momentum oscillator, 14-day RSI (~72.52) indicates that share price is trading in the overbought zone; therefore, retracement can be expected at the current levels.
- Overvalued Multiples: On a forward 12-month basis – key trading multiples (EV/Sales, EV/EBITDA, P/E, Price/Book and Price/Cash Flow) are higher than the median of Consumer Cyclicals sector.
- Financial Performance: Net profit attributable to members of the company declined 88% YoY to AUD 26.9 million in 1HFY26, primarily due to softer travel demand, higher operating costs, margin compression, and the impact of one-off write-downs.
- Emerging Risks: WEB’s revenue is highly sensitive to trends in consumer and corporate travel, making it vulnerable to broader economic conditions. In periods of economic slowdown or recession, discretionary travel spending may decline, affecting demand. The business also relies heavily on airlines, hotels, and other travel service providers, and any disruptions, supplier insolvencies, or adverse contract changes could negatively impact product availability, pricing, and margins.
WEB Daily Chart
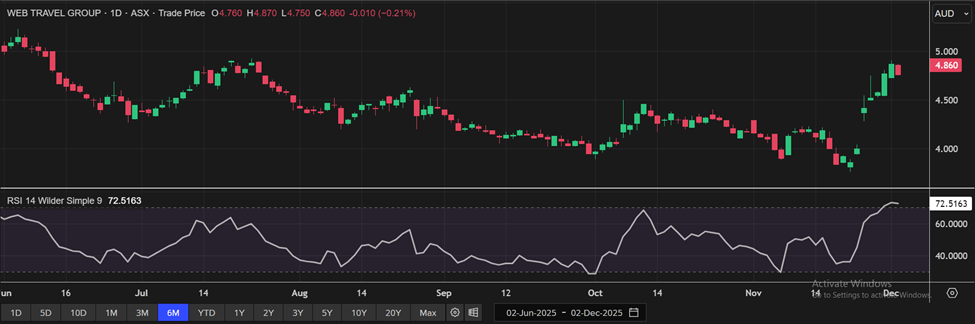
WEB Daily Technical Chart, Data Source: REFINITIV
Valuation Methodology: P/E Approach (FY March'26E) (Illustrative)
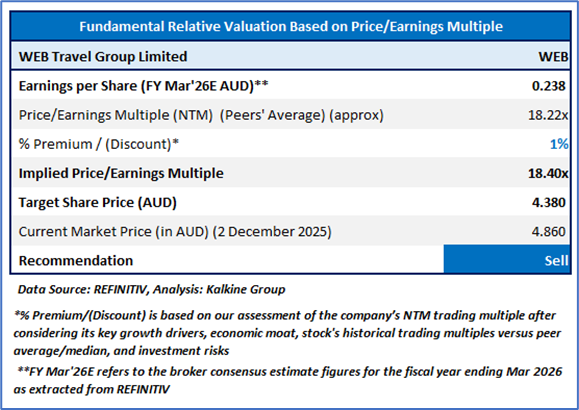
Considering the company plans to achieve FY26 underlying EBITDA between AUD 147 to AUD 155 million, capital management initiatives, strengthening hotel partnerships, investing in technology such as AI, automation, etc., the stock might trade at a slight premium to its peers. For valuation, few peers like Jumbo Interactive Ltd (ASX: JIN), Flight Centre Travel Group Ltd (ASX: FLT), Collins Foods Ltd (ASX: CKF), and others have been considered.
Considering that the stock has surpassed its R2 level, macroeconomic uncertainty, rally in share price movement, current trading level, and risks associated, the share price can face consolidation at the current levels. Hence, a ‘Sell’ recommendation is given on the stock at the current price of AUD 4.860 (as of 2 December 2025, at 12:08 PM AEDT).
Note: This report may be updated with details around fundamental and technical analysis, price/ chart in due course, as appropriate.
Note 1: Past performance is neither an indicator nor a guarantee of future performance.
Note 2: The reference date for all price data, currency, technical indicators, support, and resistance levels is 2 December 2025. The reference data in this report has been partly sourced from REFINITIV.
Note 3: Investment decisions should be made depending on an individual's appetite for upside potential, risks, holding duration, and any previous holdings. An 'Exit' from the stock can be considered if the Target Price mentioned as per the Valuation and or the technical levels provided has been achieved and is subject to the factors discussed above.
Note 4: Kalkine reports are prepared based on the stock prices captured either from REFINITIV or Trading View. Typically, REFINITIV or Trading View may reflect stock prices with a delay which could be a lag of 25-30 minutes. There can be no assurance that future results or events will be consistent with the information provided in the report. The information is subject to change without any prior notice.
Technical Indicators Defined: -
Support: A level at which the stock prices tend to find support if they are falling, and a downtrend may take a pause backed by demand or buying interest. Support 1 refers to the nearby support level for the stock and if the price breaches the level, then Support 2 may act as the crucial support level for the stock.
Resistance: A level at which the stock prices tend to find resistance when they are rising, and an uptrend may take a pause due to profit booking or selling interest. Resistance 1 refers to the nearby resistance level for the stock and if the price surpasses the level, then Resistance 2 may act as the crucial resistance level for the stock.
Stop-loss: It is a level to protect further losses in case of unfavourable movement in the stock prices.

 Please wait processing your request...