This report is an updated version of the report published on 16 December 2025 at 2:46 PM AEDT.
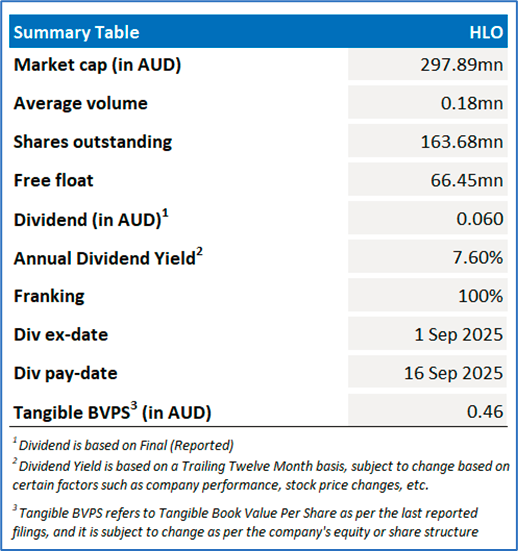
Helloworld Travel Limited (ASX: HLO)
Helloworld Travel Limited (ASX: HLO) is involved in selling international and domestic travel products and services, the operation of retail distribution networks of travel agents and specialized freight operations.
Recommendation Rationale – SELL at AUD 1.825
- Overvalued Multiples: On a forward 12-month basis – key trading multiple (EV/Sales) is higher than the median of the Consumer Cyclicals sector.
- Financial Performance: Revenue declined 8.7% year on year in FY25, while Total Transaction Value (TTV) fell 8.6% over the same period. The downturn reflected softer air travel demand, with passenger volumes down 4.9%, challenging economic conditions, agency closures and transfers, a shift in travel preferences from long-haul to mid-haul destinations, and lower average airfares, all contributing to weaker TTV performance.
- Technical Commentary: While undergoing a rally, HLO’s stock price is approaching a significant resistance established by its previous peak, anticipating a potential correction. Moreover, the momentum oscillator RSI (14-day) is trading near its overbought territory, providing further support to the previous observation. Prices are trading between its previous peak and trough, which might function as resistance and support levels for the stock, respectively.
- Market Risks: Helloworld Travel faces earnings volatility from cyclical travel demand, exposure to economic slowdowns, fuel price shocks, and geopolitical disruptions. Intense competition from online platforms may pressure margins. Supplier concentration, foreign exchange movements, regulatory changes, and execution risks in technology upgrades could also impact profitability and cash flows.
HLO Daily Chart
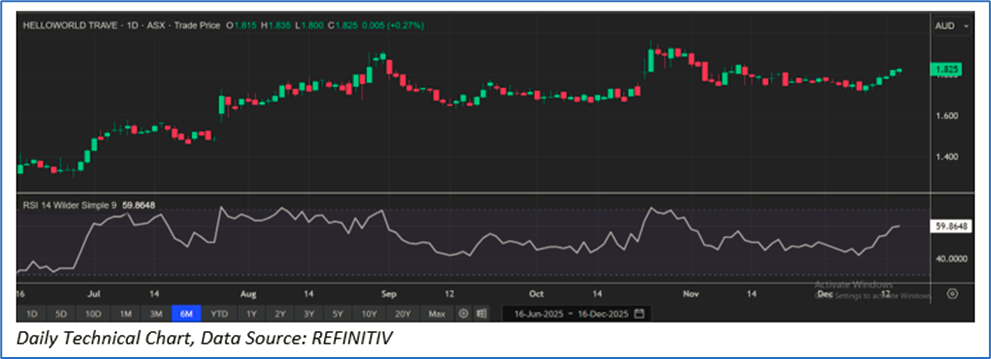
Considering that the stock is approaching its R1 level, macroeconomic uncertainty, rally in share price movement, current trading level, and risks associated, the share price can face consolidation at the current levels. Hence, a ‘Sell’ recommendation is given on the stock at the current price of AUD 1.825 (as of 16 December 2025, at 2:13 PM AEDT).
Note: This report may be updated with details around fundamental and technical analysis, price/ chart in due course, as appropriate.
Note 1: Past performance is neither an indicator nor a guarantee of future performance.
Note 2: The reference date for all price data, currency, technical indicators, support, and resistance levels is 16 December 2025. The reference data in this report has been partly sourced from REFINITIV.
Note 3: Investment decisions should be made depending on an individual's appetite for upside potential, risks, holding duration, and any previous holdings. An 'Exit' from the stock can be considered if the Target Price mentioned as per the Valuation and or the technical levels provided has been achieved and is subject to the factors discussed above.
Note 4: Kalkine reports are prepared based on the stock prices captured either from REFINITIV or Trading View. Typically, REFINITIV or Trading View may reflect stock prices with a delay which could be a lag of 25-30 minutes. There can be no assurance that future results or events will be consistent with the information provided in the report. The information is subject to change without any prior notice.
Technical Indicators Defined: -
Support: A level at which the stock prices tend to find support if they are falling, and a downtrend may take a pause backed by demand or buying interest. Support 1 refers to the nearby support level for the stock and if the price breaches the level, then Support 2 may act as the crucial support level for the stock.
Resistance: A level at which the stock prices tend to find resistance when they are rising, and an uptrend may take a pause due to profit booking or selling interest. Resistance 1 refers to the nearby resistance level for the stock and if the price surpasses the level, then Resistance 2 may act as the crucial resistance level for the stock.
Stop-loss: It is a level to protect further losses in case of unfavourable movement in the stock prices.

 Please wait processing your request...