This report is an updated version of the report published on 24 June 2025 at 11:42 AM AEST.
EDU Holdings Ltd (ASX: EDU)
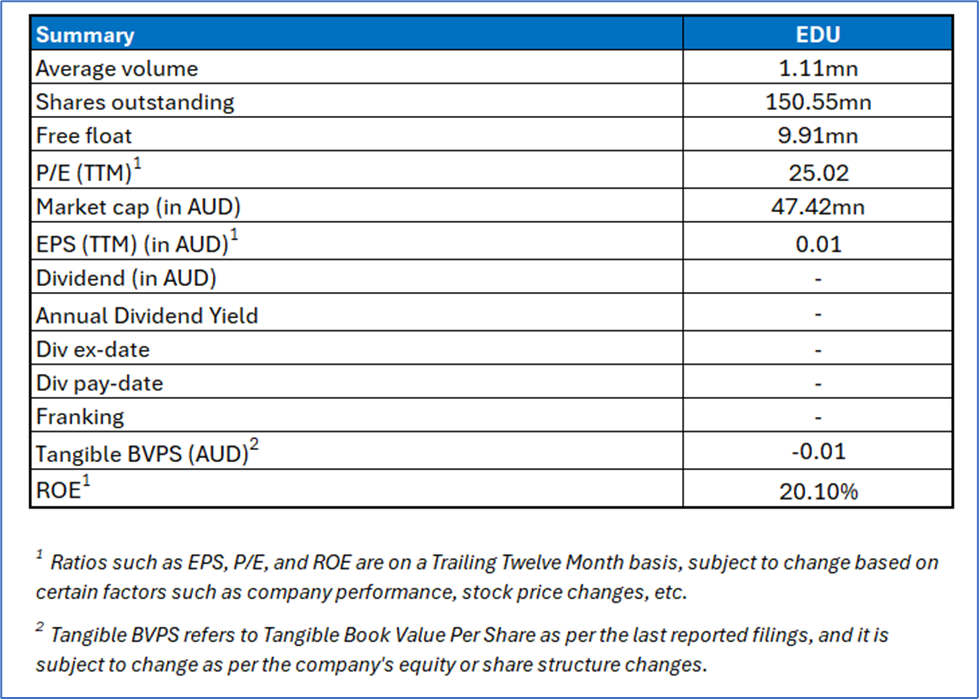
EDU Holdings Limited (ASX: EDU) is an Australian publicly listed company specializing in tertiary education services, primarily focused on health, education, and human services fields of study.
Recommendation Rationale - SELL at AUD 0.330
- Trading Around Resistance: EDU share price has crossed its R2 level recommended on 3 March 2025; and it is trading close to 52-week high and; thus, it can face resistance at the current level.
- Regulatory Uncertainty: There is ongoing uncertainty regarding regulatory changes in the international student market. The Education Services for Overseas Students Amendment (Quality and Integrity) Bill 2024 was not enacted as expected, and instead, Ministerial Direction 111 (MD111) was issued, imposing enrolment caps that limit offshore visa processing for students. This regulatory environment creates uncertainty for future international student enrolments.
- Technical Standpoint: The momentum oscillator 14-day RSI (~74.05) shows that stock price has entered the overbought zone, and it may be poised for a pullback or price correction.
- Higher Expenses: During H1 FY25, Cost of Sales and Operating Expenses increased by 76% and 52% YoY, respectively.
Daily Price Chart

Daily Technical Chart, Data Source: REFINITIV
Considering the rally in share price movement, current trading level, and risks associated, the share price can witness resistance at the current levels. Hence, a ‘Sell’ recommendation is given on the stock at the current market price of AUD 0.330, as of 24 June 2025, at 10:50 AM AEST.
Markets are trading in a highly volatile zone currently due to certain macro-economic issues and geopolitical issues prevailing geopolitical tensions. Therefore, it is prudent to follow a cautious approach while investing.
Note 1: Past performance is neither an indicator nor a guarantee of future performance.
Note 2: The reference date for all price data, currency, technical indicators, support, and resistance levels is 24 June 2025. The reference data in this report has been partly sourced from REFINITIV.
Note 3: Investment decisions should be made depending on an individual's appetite for upside potential, risks, holding duration, and any previous holdings. An 'Exit' from the stock can be considered if the Target Price mentioned as per the Valuation and or the technical levels provided has been achieved and is subject to the factors discussed above.
Note 4: Kalkine reports are prepared based on the stock prices captured either from REFINITIV or Trading View. Typically, REFINITIV or Trading View may reflect stock prices with a delay which could be a lag of 25-30 minutes. There can be no assurance that future results or events will be consistent with the information provided in the report. The information is subject to change without any prior notice.
Technical Indicators Defined: -
Support: A level at which the stock prices tend to find support if they are falling, and a downtrend may take a pause backed by demand or buying interest. Support 1 refers to the nearby support level for the stock and if the price breaches the level, then Support 7 May act as the crucial support level for the stock.
Resistance: A level at which the stock prices tend to find resistance when they are rising, and an uptrend may take a pause due to profit booking or selling interest. Resistance 1 refers to the nearby resistance level for the stock and if the price surpasses the level, then Resistance 7 May act as the crucial resistance level for the stock.
Stop-loss: It is a level to protect further losses in case of unfavourable movement in the stock prices.

 Please wait processing your request...