This report is an updated version of the report published on 19 September 2025 at 11:05 AM AEST.
Cettire Limited (ASX: CTT)
CTT is a global luxury online platform. Through its website, cettire.com, the company provides access to over 2,500 prestigious brands and more than 500,000 catalogue, including clothing, shoes, bags, and accessories.
Recommendation Rationale - SELL at AUD 0.560
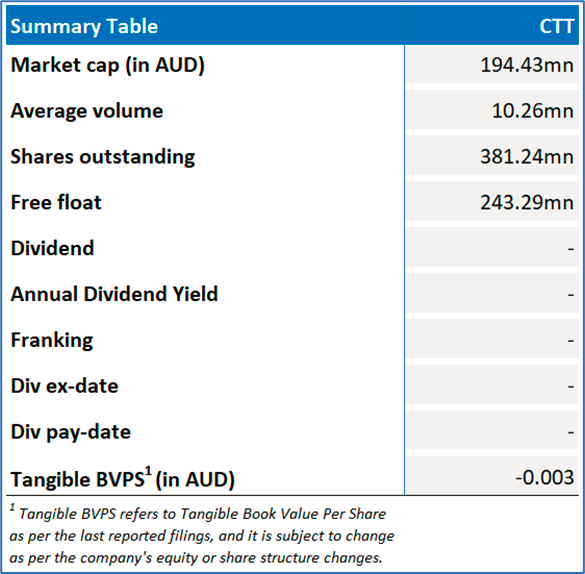
- FY25 Results: In FY25, gross revenue was AUD 975.3 million, broadly flat against AUD 978.3 million in FY24. Active customers decreased to 657k from 692k in the prior year, while delivered margin declined to AUD 119.4 million, equating to 16.1% of sales revenue versus 20.9% in FY24. Adjusted EBITDA dropped sharply to AUD 0.3 million from AUD 32.5 million, and the company posted a statutory net loss after tax of AUD 2.6 million, compared with a profit of AUD 10.5 million in FY24.
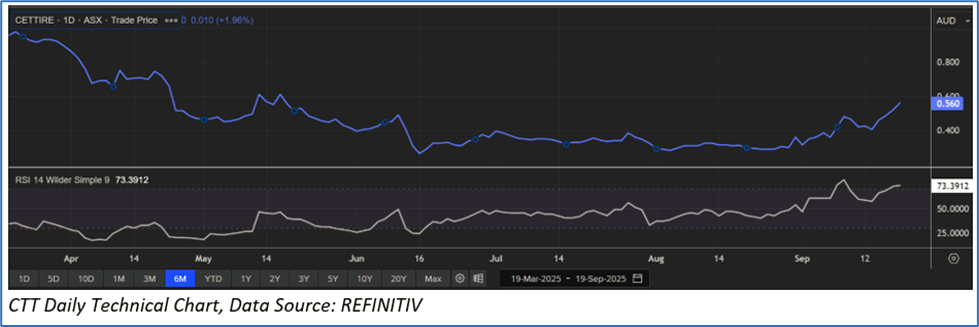
- Technical Observation: CTT’s share price has surpassed its R2 level, recommended on 07 August 2025. Also, the momentum oscillatory (14-day RSI is around 73.4 level), indicating an overbought zone. This shows increasing the likelihood of near-term consolidation or technical pullback.
- Overvalued Multiples: On a forward 12-month basis – key trading multiples (EV/EBITDA, Price/Cash Flow and Price/Book Value) are higher than the median of the Specialty Retailer industry.
- Market Risks: As CTT operates across multiple countries, its revenue is influenced by fluctuations in exchange rates, which can impact both revenue and profitability in local currencies. Additionally, the industry is shaped by shifting fashion trends and changing consumer preferences. If CTT fails to adapt to these changes, it could face inventory write-downs or a decline in sales.
CTT Daily Price Chart
Valuation Methodology: P/CF Flow Approach (FY June'26E) (Illustrative)
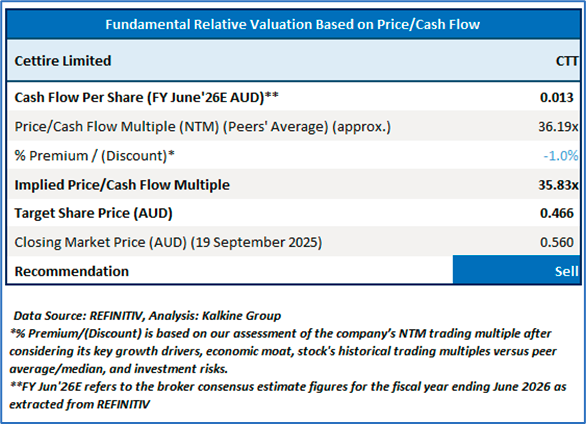
Given the significant headwinds faced by global luxury market throughout FY25, reduced consumer spending, geopolitical tensions, losses in FY25 etc., the stock might trade at a slight discount to its peers. For valuation, few peers like Lovisa Holdings Ltd (ASX: LOV), Temple & Webster Group Ltd (ASX: TPW), and JB Hi-Fi Ltd (ASX: JBH) have been considered.
Considering that the stock has surpassed it R2 level, macroeconomic uncertainty, share price movement, current trading level, and risks associated, the share price can face consolidation at the current levels. Hence, a ‘Sell’ recommendation is given on the stock at the current market price of AUD 0.560, at 10:07 AM AEST, as of 19 September 2025.
Markets are trading in a highly volatile zone currently due to certain macro-economic issues and geopolitical issues prevailing geopolitical tensions. Therefore, it is prudent to follow a cautious approach while investing.
Note 1: Past performance is neither an indicator nor a guarantee of future performance.
Note 2: The reference date for all price data, currency, technical indicators, support, and resistance levels is 19 September 2025. The reference data in this report has been partly sourced from REFINITIV.
Note 3: Investment decisions should be made depending on an individual's appetite for upside potential, risks, holding duration, and any previous holdings. An 'Exit' from the stock can be considered if the Target Price mentioned as per the Valuation and or the technical levels provided has been achieved and is subject to the factors discussed above.
Note 4: Kalkine reports are prepared based on the stock prices captured either from REFINITIV or Trading View. Typically, REFINITIV or Trading View may reflect stock prices with a delay which could be a lag of 25-30 minutes. There can be no assurance that future results or events will be consistent with the information provided in the report. The information is subject to change without any prior notice.
Technical Indicators Defined: -
Support: A level at which the stock prices tend to find support if they are falling, and downtrend may take a pause backed by demand or buying interest.
Resistance: A level at which the stock prices tend to find resistance when they are rising, and uptrend may take a pause due to profit booking or selling interest.
Stop-loss: In general, it is a level to protect further losses in case of any unfavourable movement in the stock prices.

 Please wait processing your request...