This report is an updated version of the report published on 21 February 2025 at 3:42 PM AEDT.
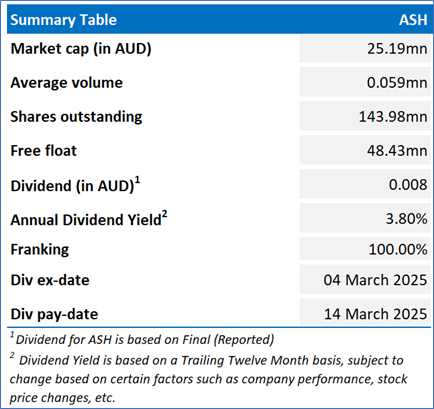
Ashley Services Group Limited (ASX: ASH)
ASH is an Australia-based company that provides tailored workforce solutions, including requirements and training. The Group operates through two broad segments: the Labor Hire division with a smaller and more focused complementary training division.
Recommendation Rationale – SELL at AUD 0.240
- Technical Commentary: On the daily chart, ASH prices are trading below the horizontal trendline resistance zone. Additionally, the 14-period RSI is at approximately 73.97, indicating strong momentum, though nearing overbought territory. Despite this, the stock remains above the 21-period SMA, a key trend-following indicator that may act as a support level.
- Trading Around Resistance:ASH’s share price surpassed its R2 level recommended on 24 January 2025.
- TTM-Based Valuation: On a TTM basis, the stock of ASH is trading at a Price/Cash Flow multiple of 8.6x compared to the industry (Industrial) median of 7.7x and thus seems overvalued.
- Decline in Top-Line:Revenue declined ~8.5% YoY in 1HFY25. This decline was primarily due to a 39% drop in construction and engineering revenues in Victoria, which resulted from the completion of ongoing projects, delays in launching new ones, and challenges related to industrial relations.
- Emerging Risks: ASH faces market risk due to intense competition, regulatory challenges in labour hire and training sectors, rising debt, and declining revenue, all of which could affect financial stability and future profitability.
ASH Daily Chart
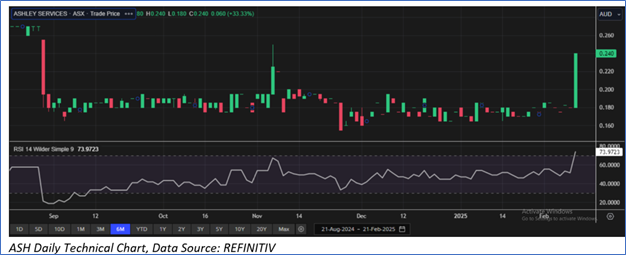
Considering that the stock has surpassed its R2 level, rally in share price, current trading level, and risks associated, the share price can face consolidation at the current levels. Hence, a ‘Sell’ recommendation is given on the stock at the current price of AUD 0.240 (as of 21 Februrauy 2025, at 3:10 PM AEDT).
Note: This report may be updated with details around fundamental and technical analysis, price/ chart in due course, as appropriate.
Note 1: Past performance is neither an indicator nor a guarantee of future performance.
Note 2: The reference date for all price data, currency, technical indicators, support, and resistance levels is 21 February 2025. The reference data in this report has been partly sourced from REFINITIV.
Note 3: Investment decisions should be made depending on an individual's appetite for upside potential, risks, holding duration, and any previous holdings. An 'Exit' from the stock can be considered if the Target Price mentioned as per the Valuation and or the technical levels provided has been achieved and is subject to the factors discussed above.
Note 4: Dividend Yield may vary as per the stock price movement.
Note 5: Kalkine reports are prepared based on the stock prices captured either from REFINITIV or Trading View. Typically, REFINITIV or Trading View may reflect stock prices with a delay which could be a lag of 25-30 minutes. There can be no assurance that future results or events will be consistent with the information provided in the report. The information is subject to change without any prior notice.
Technical Indicators Defined: -
Support: A level at which the stock prices tend to find support if they are falling, and a downtrend may take a pause backed by demand or buying interest. Support 1 refers to the nearby support level for the stock and if the price breaches the level, then Support 2 may act as the crucial support level for the stock.
Resistance: A level at which the stock prices tend to find resistance when they are rising, and an uptrend may take a pause due to profit booking or selling interest. Resistance 1 refers to the nearby resistance level for the stock and if the price surpasses the level, then Resistance 2 may act as the crucial resistance level for the stock.
Stop-loss: It is a level to protect further losses in case of unfavourable movement in the stock prices.

 Please wait processing your request...