This report is an updated version of the report published on 3 December 2025 at 3:11 PM AEDT.
IPD Group Limited (ASX: IPG)
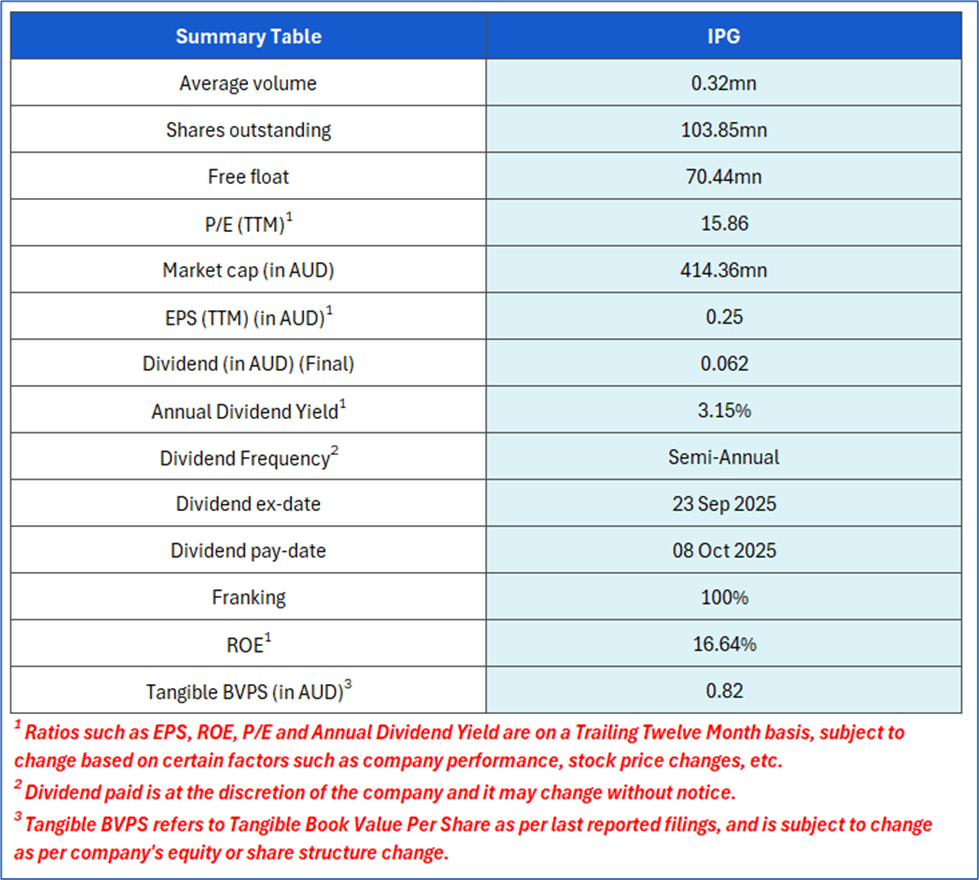
IPD Group Limited (ASX: IPG) is an Australian supplier of electrical products and integrated solutions for power distribution, automation, and energy management. The company prioritises safety, efficiency, and compliance across critical industries. Through innovation and expertise, IPG drives the transition toward a more electrified and sustainable future.
Recommendation Rationale – SELL at AUD 4.000
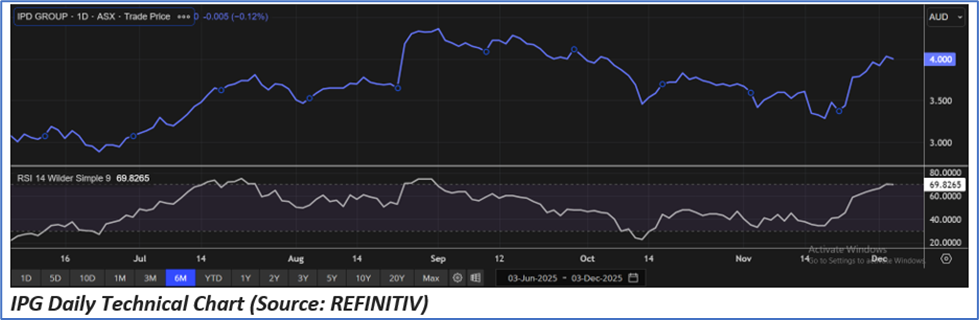
- Technical Standpoint:IPG’s share price has surpassed the R1 level recommended on 6 November 2025, hence the stock may witness some consolidation in the near term.
- Overvalued Multiples: On a forward 12-month basis – key trading multiples (EV/EBITDA, P/E, P/B and P/CF) are higher than industry (industrials) median, hence, look overvalued.
- Declining Margins and Pro-Forma Earnings: IPG’s underlying profitability weakened in FY25, with gross margin, EBITDA margin, EBIT margin and NPAT margin all falling on the pro-forma pcp, alongside declines in pro-forma EBITDA, EBIT and NPAT. Lower-margin CMI operations and competitive project mix contributed to this contraction.
- Exposure to Economic Uncertainty in Key Market Sectors: The company’s performance remains partly dependent on sectors experiencing economic uncertainty. A downturn in infrastructure, industrial or construction activity could soften demand for electrical solutions, potentially limiting revenue growth momentum achieved in FY25 and restricting the company’s ability to meet future earnings targets.
IPG Daily Price Chart
Valuation Methodology: Price/Earnings Approach (Illustrative)
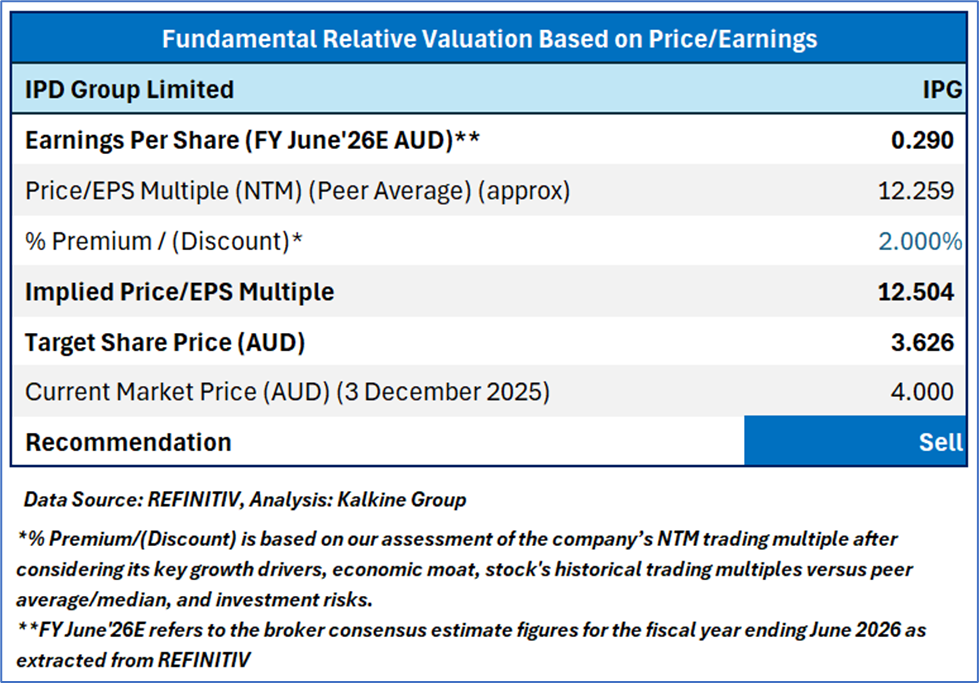
The stock might trade at a slight premium to its peers considering a 16.7% YoY increase in FY25 dividends, growing Data Centres revenue, strategic acquisitions, efficient cost management, among other factors. For conducting the valuation, peers including Southern Cross Electrical Engineering Ltd (ASX: SXE), GenusPlus Group Ltd (ASX: GNP), Acrow Ltd (ASX: ACF) and others have been considered.
Considering that the stock has crossed its R1 level, macroeconomic uncertainty, rally in share price movement, current trading level, and risks associated, the share price can face consolidation at the current levels. Hence, a ‘Sell’ recommendation is given on the stock at the current price of AUD 4.000 (as of 3 December 2025, at 02:52 PM AEDT).
Markets are trading in a highly volatile zone currently due to certain macro-economic issues and geopolitical issues prevailing geopolitical tensions. Therefore, it is prudent to follow a cautious approach while investing.
Note 1: Past performance is neither an indicator nor a guarantee of future performance.
Note 2: The reference date for all price data, currency, technical indicators, support, and resistance levels is 3 December 2025. The reference data in this report has been partly sourced from REFINITIV.
Note 3: Investment decisions should be made depending on an individual's appetite for upside potential, risks, holding duration, and any previous holdings. An 'Exit' from the stock can be considered if the Target Price mentioned as per the Valuation and or the technical levels provided has been achieved and is subject to the factors discussed above.
Note 4: Dividend Yield may vary as per the stock price movement.
Note 5: Kalkine reports are prepared based on the stock prices captured either from REFINITIV or Trading View. Typically, REFINITIV or Trading View may reflect stock prices with a delay which could be a lag of 25-30 minutes. There can be no assurance that future results or events will be consistent with the information provided in the report. The information is subject to change without any prior notice.
Technical Indicators Defined: -
Support: A level at which the stock prices tend to find support if they are falling, and a downtrend may take a pause backed by demand or buying interest. Support 1 refers to the nearby support level for the stock and if the price breaches the level, then Support 2 may act as the crucial support level for the stock.
Resistance: A level at which the stock prices tend to find resistance when they are rising, and an uptrend may take a pause due to profit booking or selling interest. Resistance 1 refers to the nearby resistance level for the stock and if the price surpasses the level, then Resistance 2 may act as the crucial resistance level for the stock.
Stop-loss: It is a level to protect further losses in case of unfavourable movement in the stock prices.

 Please wait processing your request...