This report is an updated version of the report published on 11 July 2025 at 12:40 pm AEST.
Amplia Therapeutics Limited (ASX: ATX)
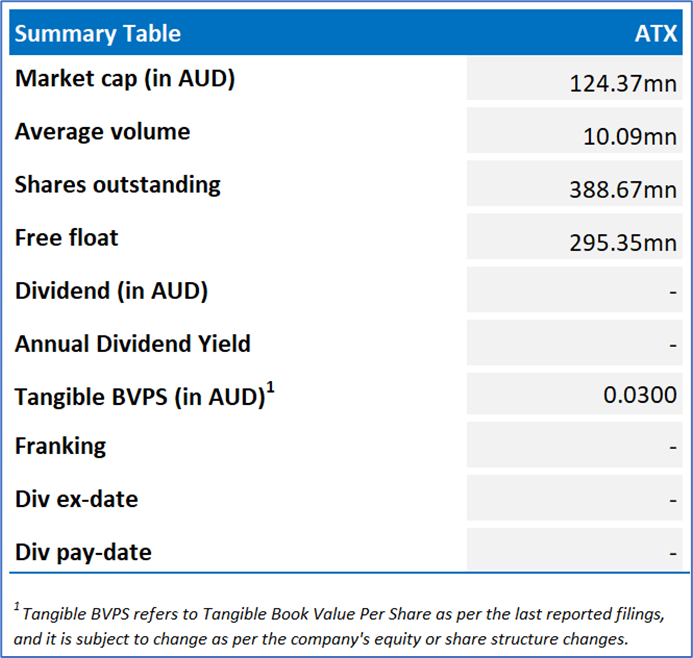
Amplia Therapeutics Limited (ASX: ATX) is an Australian pharmaceutical company developing FAK inhibitors for cancer and fibrosis. The company focuses on fibrotic cancers, including pancreatic and ovarian cancer, targeting the FAK protein. Its pipeline also addresses chronic diseases such as idiopathic pulmonary fibrosis (IPF).
Recommendation Rationale – SELL at AUD 0.400
- Trading Near the Resistance: ATX's share price has surpassed its R1 level and is now approaching its R2 level, as recommended on 9 July 2025. Therefore, share price can face resistance at the current levels.
- Increase in Losses: ATX’s total loss increased from AUD 4.5mn in FY24 to AUD 6.57mn in FY25. Widened losses were due to increased research and development expenses, primarily for the narmafotinib Phase II trial. The company’s loss-making position presents a risk, as continued financial losses may strain resources, limit growth opportunities, and require additional funding or capital raising to sustain operations.
- Technical Commentary: After a rally, ATX’s stock prices formed a Bearish Evening Star candlestick pattern on the daily chart, indicating a negative bias in the short-term. Moreover, the momentum oscillator RSI (14-period) appeared a top divergence in relation to prices in its overbought territory, adding more support to the previous observation. Prices are trading above both the trend-following indicators 21-day and 50-day SMAs, which could serve as dynamic support levels for the stock; in contrast, the stock’s most recent high might act as a resistance.
- Emerging Risks: Clinical trials of narmafotinib may fail due to slow patient recruitment, safety concerns, or limited drug efficacy, negatively impacting commercial viability and future company value. The company has no current products on the market; future commercial success depends on market acceptance, competitive alternatives, and whether products are economically viable to sell.
ATX’s Daily Price Chart
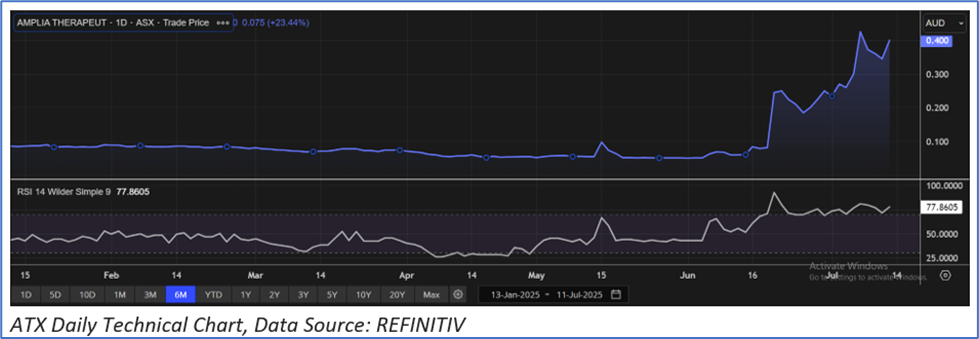
Considering that the stock is approaching its R2 level, macroeconomic uncertainty, share price movement, current trading level, and risks associated, the share price can face consolidation at the current levels. Hence, a ‘Sell’ recommendation is given on the stock at the current price of AUD 0.40 (as of 11 July 2025, at 11:40 AM AEST).
Markets are trading in a highly volatile zone currently due to certain macro-economic issues and geopolitical issues prevailing geopolitical tensions. Therefore, it is prudent to follow a cautious approach while investing.
Note 1: Past performance is neither an indicator nor a guarantee of future performance.
Note 2: The reference date for all price data, currency, technical indicators, support, and resistance levels is 11 July 2025. The reference data in this report has been partly sourced from REFINITIV.
Note 3: Investment decisions should be made depending on an individual's appetite for upside potential, risks, holding duration, and any previous holdings. An 'Exit' from the stock can be considered if the Target Price mentioned as per the Valuation and or the technical levels provided has been achieved and is subject to the factors discussed above.
Note 4: Kalkine reports are prepared based on the stock prices captured either from REFINITIV or Trading View. Typically, REFINITIV or Trading View may reflect stock prices with a delay which could be a lag of 25-30 minutes. There can be no assurance that future results or events will be consistent with the information provided in the report. The information is subject to change without any prior notice.
Technical Indicators Defined: -
Support: A level at which the stock prices tend to find support if they are falling, and downtrend may take a pause backed by demand or buying interest.
Resistance: A level at which the stock prices tend to find resistance when they are rising, and uptrend may take a pause due to profit booking or selling interest.
Stop-loss: In general, it is a level to protect further losses in case of any unfavourable movement in the stock prices.

 Please wait processing your request...