This report is an updated version of the report published on 16 October 2025, at 10:42 AM PDT.
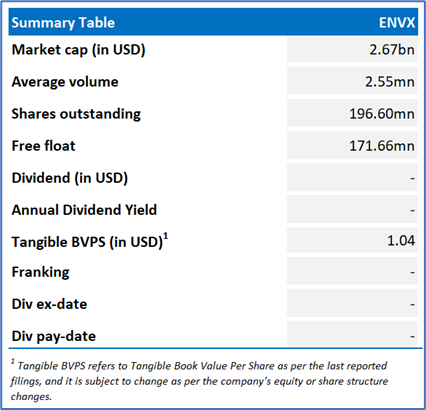
Enovix Corporation (NASDAQ: ENVX)
ENVX is a global high-performance battery company specializing in designing, developing, manufacturing, and commercializing lithium-ion (Li-ion) battery cells that deliver higher energy density and storage capacity compared to traditional battery cells.
Recommendation Rationale – SELL at USD 13.29
- Financial Highlights: Cost of revenue increased to USD 5.53mn in Q2FY25 vs USD 4.42mn in 2QFY24. Cash and cash equivalents down to USD 135.98mn as on 29 June 2025 vs USD 272.87mn as on 29 December 2024.
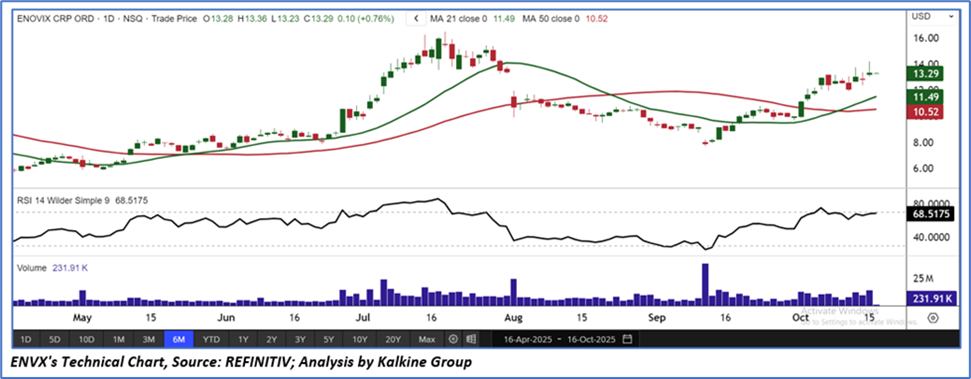
- Trading Near the Resistance: ENVX’s stock price has surpassed its R2 level recommended on 12 September 2025. Moreover, the 14-day RSI (~68.52) indicates that the stock is approaching the overbought zone. Therefore, share price can face resistance at the current levels.
- Overvalued Multiples: On a forward 12-month basis – key trading multiples (EV/Sales, Price/ Book Value) are higher than Median of the Industrials Sector.
- Market Risk: Dependence on third party suppliers for key battery components (anode, cathode, separators, etc.), many of which require qualification and volume‐scale supply agreements. Delays or inability to secure favourable terms could cause delays or raise costs. Raw material price volatility (e.g. lithium, silicon, cobalt) and possible disruptions (trade policies, geographical issues) could increase input costs, hurting margins.
Daily Price Chart
Valuation Methodology: EV/Sales Multiple Approach (FY December'26E) (Illustrative)
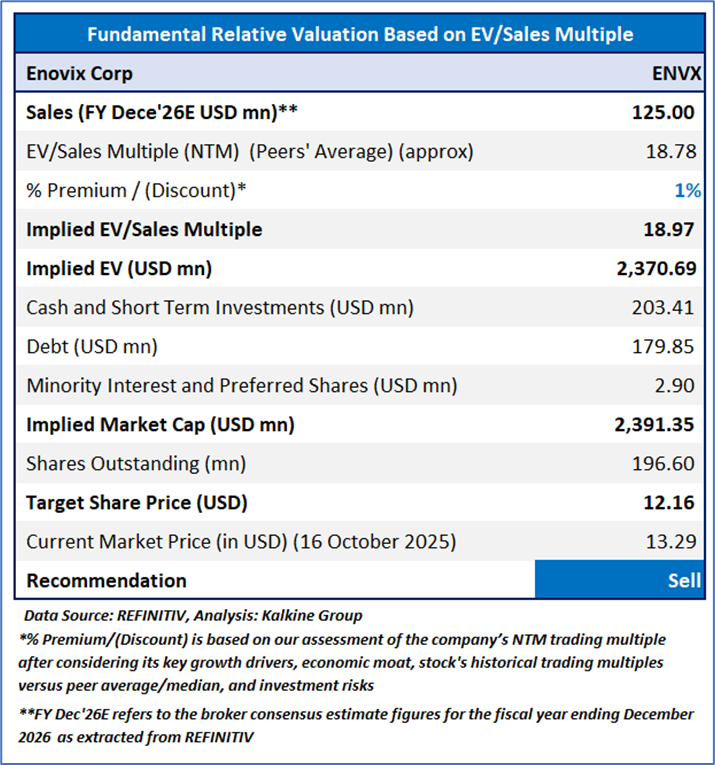
Stock might trade at a slight premium to its peers considering the YoY growth in revenue in 2QFY25, YoY decreased in net loss in 2QFY25 and expected underlying EBITDA in FY25. For conducting the valuation, the following peers: Amprius Technologies Inc (NYSE: AMPX), Sunrun Inc (NASDAQ: RUN), Nuscale Power Corp (NYSE: SMR), and others have been considered.
Given the stock has crossed to its R2 level, recent rally in the share price, and risks associated, it is prudent to sell the stock at the current levels. Hence, a ‘Sell’ recommendation is given on the stock at the current market price of USD 13.29, as of 16 October 2025 (6:35 AM PDT).
Enovix Corporation (NASDAQ: ENVX) is a part of Global Fully Charged Portfolio.
Markets are trading in a highly volatile zone currently due to certain macro-economic issues and geopolitical issues prevailing geopolitical tensions. Therefore, it is prudent to follow a cautious approach while investing.
Note 1: Past performance is neither an indicator nor a guarantee of future performance.
Note 2: The reference date for all price data, currency, technical indicators, support, and resistance levels is 16 October 2025. The reference data in this report has been partly sourced from REFINITIV.
Note 3: Investment decisions should be made depending on an individual's appetite for upside potential, risks, holding duration, and any previous holdings. An 'Exit' from the stock can be considered if the Target Price mentioned as per the Valuation and or the technical levels provided has been achieved and is subject to the factors discussed above.
Note 4: Kalkine reports are prepared based on the stock prices captured either from REFINITIV or Trading View. Typically, REFINITIV or Trading View may reflect stock prices with a delay which could be a lag of 25-30 minutes. There can be no assurance that future results or events will be consistent with the information provided in the report. The information is subject to change without any prior notice.
Technical Indicators Defined: -
Support: A level at which the stock prices tend to find support if they are falling, and downtrend may take a pause backed by demand or buying interest.
Resistance: A level at which the stock prices tend to find resistance when they are rising, and uptrend may take a pause due to profit booking or selling interest.
Stop-loss: In general, it is a level to protect further losses in case of any unfavourable movement in the stock prices.
 Please wait processing your request...