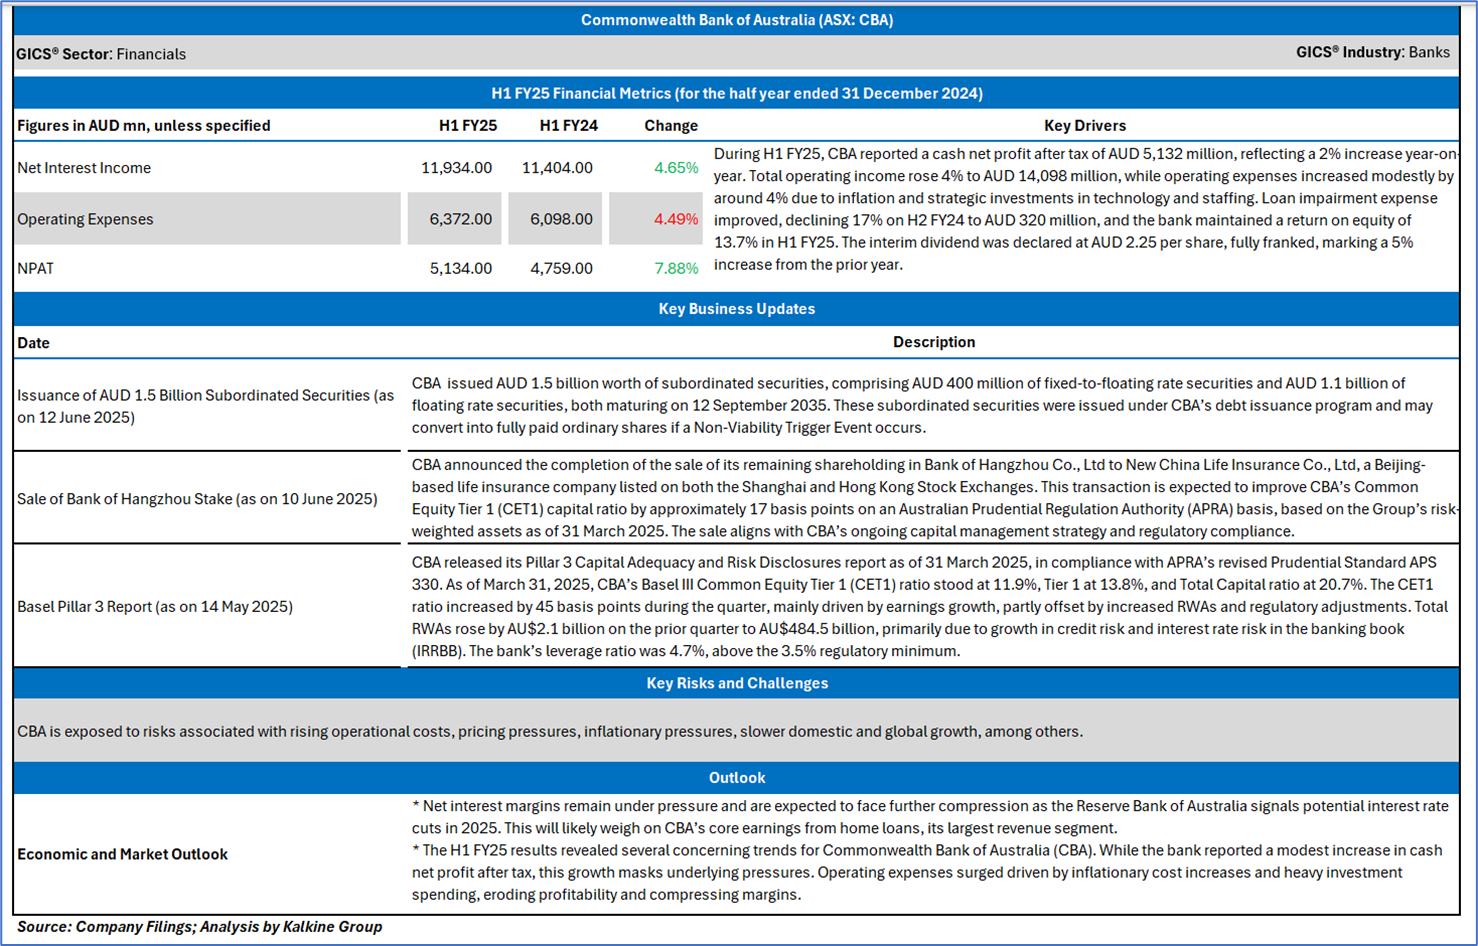
Company Overview: Commonwealth Bank of Australia (CBA) is a leading Australian financial institution providing a comprehensive range of banking and financial services to individuals, businesses, and institutions. Its core business segments include retail banking, business banking, institutional banking, wealth management, and insurance. CBA offers products such as savings accounts, term deposits, personal loans, home loans, international payments, and mobile banking services under well-known brands including Commonwealth Bank, Bankwest, and ASB. Kalkine’s Daily Report covers the Key Financial Metrics, Recent Business Updates, Key Risks, Outlook, Technical Analysis and Recommendation on the stock.
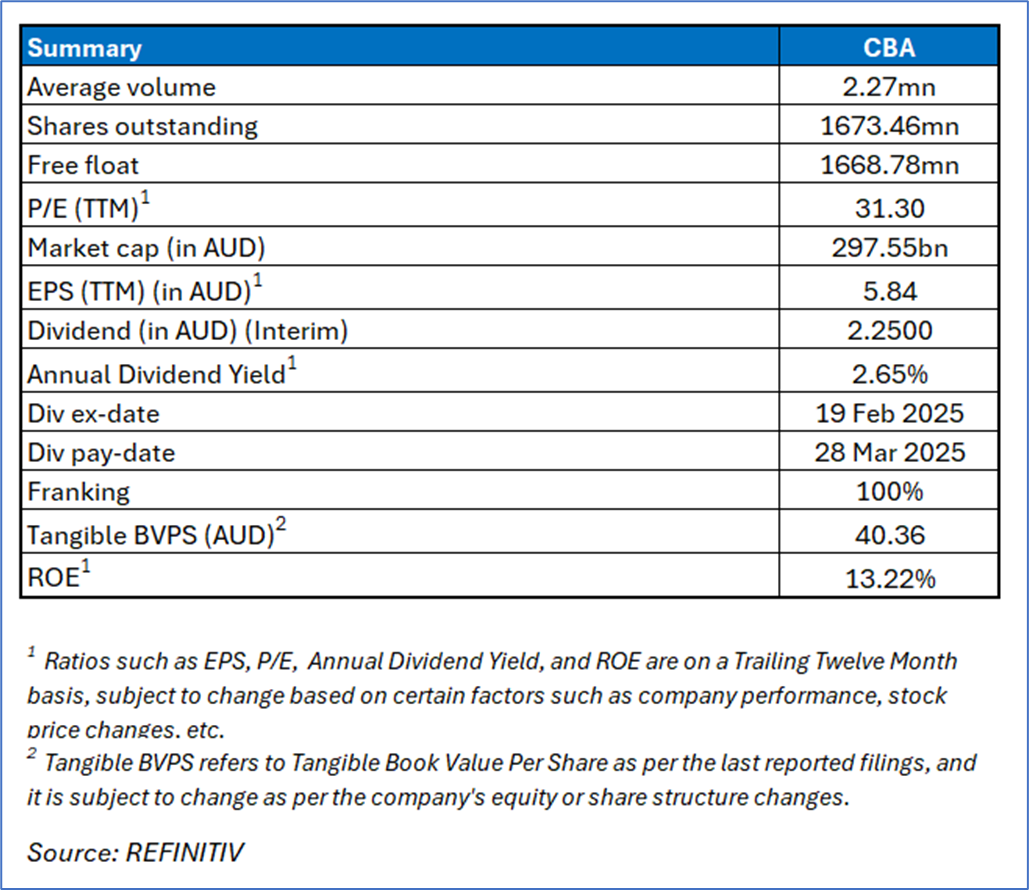
Company Details
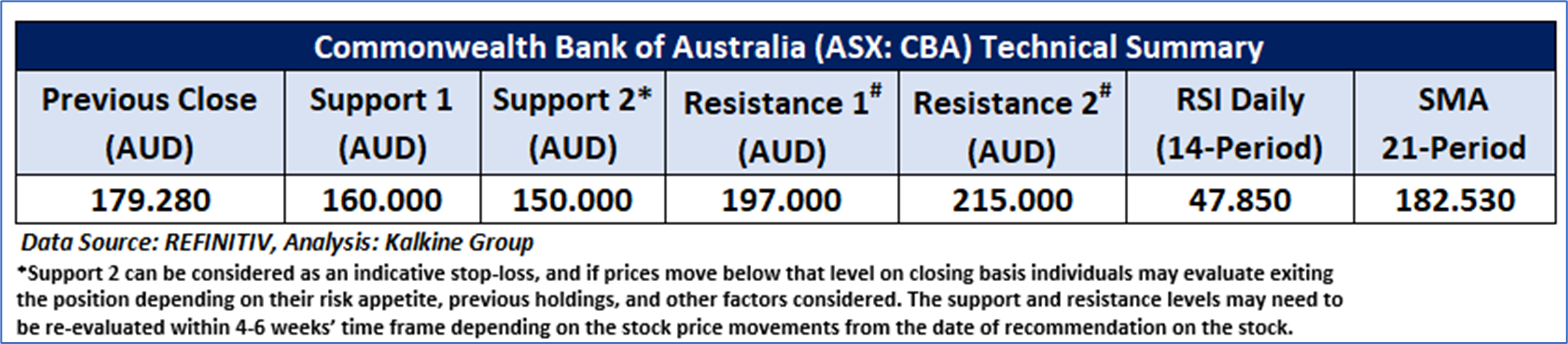
CBA’s Technical Analysis:
On the daily chart, CBA is trading below a rising trendline resistance zone and continues to face selling pressure at this level. The 14-period RSI is around 47.85, indicating weakening momentum. In addition, the stock remains below its 21-period Simple Moving Average (SMA), which may act as dynamic resistance in the near term. Key support is identified at AUD 160.00, while immediate resistance is positioned at AUD 197.00.
Daily Technical Chart
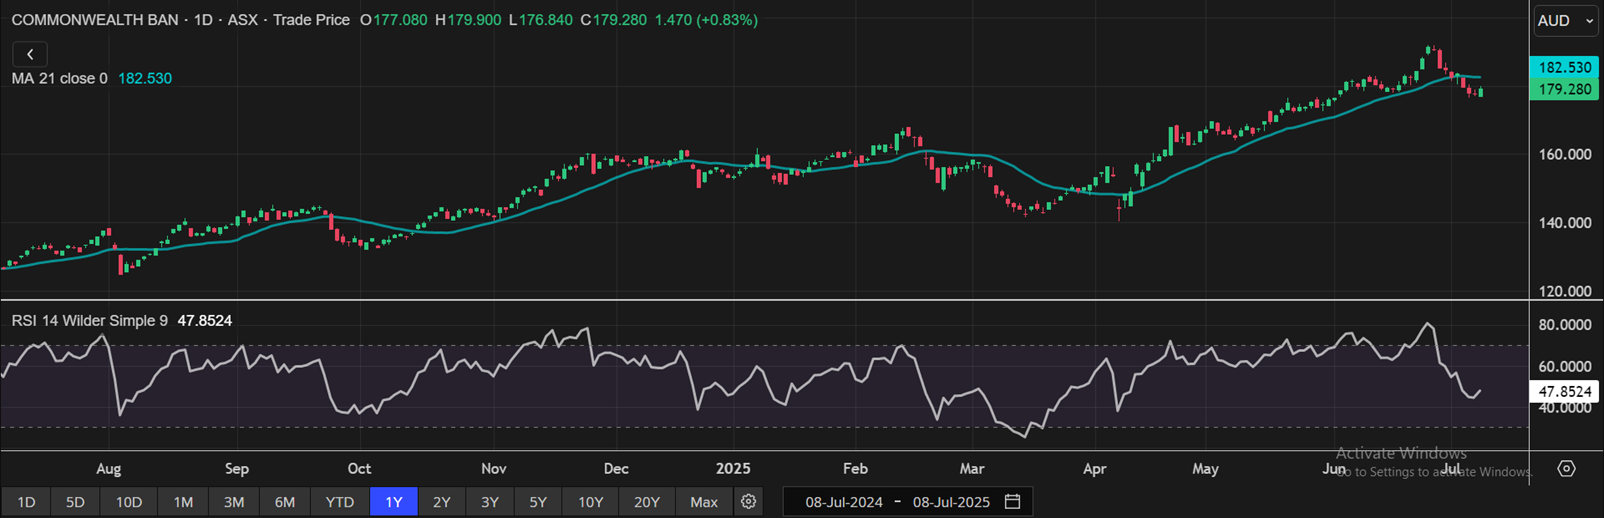
(Source: REFINITIV; Analysis by Kalkine Group)
Individuals can evaluate the stock based on the support and resistance levels provided in the report in case of keen interest, taking into consideration the risk-reward scenario.
Considering CBA is trading below key resistance levels and its 21-period SMA, with weakening momentum indicated by an RSI near 48, alongside fundamental challenges such as margin pressure, rising operating costs, and regulatory capital constraints despite steady profit growth, a ‘Watch’ recommendation is given. The stock was analysed as per the closing price of AUD 179.280 per share as on 08 July 2025, up by 0.826%.
Markets are trading in a highly volatile zone currently due to certain macro-economic issues and geopolitical issues prevailing geopolitical tensions. Therefore, it is prudent to follow a cautious approach while investing.
Note 1: Past performance is neither an indicator nor a guarantee of future performance.
Note 2: The reference date for all price data, currency, technical indicators, support, and resistance levels is 8 July 2025. The reference data in this report has been partly sourced from REFINITIV.
Note 3: Investment decisions should be made depending on an individual's appetite for upside potential, risks, holding duration, and any previous holdings. An 'Exit' from the stock can be considered if the Target Price mentioned as per the Valuation and or the technical levels provided has been achieved and is subject to the factors discussed above.
Note 4: Kalkine reports are prepared based on the stock prices captured either from REFINITIV or Trading View. Typically, REFINITIV or Trading View may reflect stock prices with a delay which could be a lag of 25-30 minutes. There can be no assurance that future results or events will be consistent with the information provided in the report. The information is subject to change without any prior notice.
Note 5: Dividend Yield may vary as per the stock price movement.
Technical Indicators Defined: -
Support: A level at which the stock prices tend to find support if they are falling, and a downtrend may take a pause backed by demand or buying interest. Support 1 refers to the nearby support level for the stock and if the price breaches the level, then Support 2 may act as the crucial support level for the stock.
Resistance: A level at which the stock prices tend to find resistance when they are rising, and an uptrend may take a pause due to profit booking or selling interest. Resistance 1 refers to the nearby resistance level for the stock and if the price surpasses the level, then Resistance 2 may act as the crucial resistance level for the stock.
Stop-loss: It is a level to protect further losses in case of unfavourable movement in the stock prices.

 Please wait processing your request...