Infinity Mining Limited (ASX: IMI)
Infinity Mining Limited (ASX: IMI) is an Australia-based mineral and exploration company.
Technical Analysis: On the daily chart, IMI’s stock prices are facing the resistance of the horizontal resistance line on the upside, indicating the possibility of a downward move hereon. However, RSI (14-period) is moving above the mid-point and showing a reading of 51.713. The prices are trading above the trend-following indicator 50-period SMA, which may act as a support level for the stock. An important support level for the stock is placed at AUD 0.200 while the key resistance level is placed at AUD 0.265.
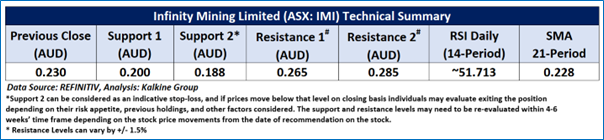
Considering the company’s current price levels encountering resistance at the falling channel, momentum oscillator analysis, a ‘Watch’ recommendation is given on the stock. The stock was analysed as per the closing price of AUD 0.230 per share, as on 03rd November 2022, down by ~6.12%.
Individuals can evaluate the stock based on the support and resistance levels provided in the report in case of keen interest taking into consideration the risk-reward scenario.
Daily Technical Chart – IMI
Mineral Resources Limited (ASX: MIN)
Mineral Resources Limited is an Australia-based mining services company that owns a mining portfolio of multiple commodities, including iron ore and lithium. MIN holds a market capitalization of AUD 13.75bn as of 3rd November 2022.
Technical Analysis: On the daily chart, MIN’s stock price has facing resistance at the rising trendline, indicating the possibility of a downward move hereon. Moreover, RSI (14-period) is showing a bearish divergence and reflecting 47.694 levels, further supporting negative bias. However, prices are trading above the trend-following indicators SMA 50-period SMA, which may act as a support zone for the stock in the near term. An important support level for the stock is AUD 63.00, while the key resistance level is AUD 77.00.
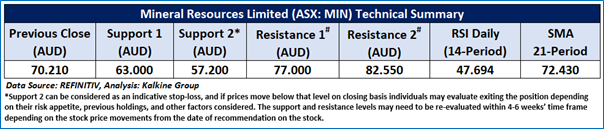
Considering the company’s current price levels encountering resistance at the trendline, momentum oscillator analysis, a ‘Watch’ recommendation is given on the stock. The stock was analysed as per the closing price of AUD 70.21 per share down ~3.12%, as on 3rd November 2022.
Individuals can evaluate the stock based on the support and resistance levels provided in the report in case of keen interest taking into consideration the risk-reward scenario.
Daily Technical Chart – MIN
Pure Hydrogen Corporation Limited (ASX:PH2)
Pure Hydrogen Corporation Limited (ASX: PH2) is engaged in the gas and hydrogen business. The current market capitalization as of 3rd November 2022 stood at AUD 87.04mn.
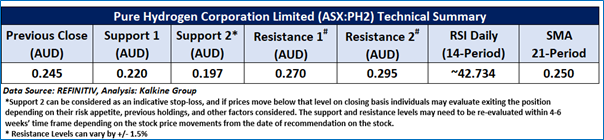
Technical Analysis: On the daily chart, PH2 stock price facing resistance at the falling trendline, indicating the possibility of downside correction hereon. Moreover, the momentum oscillator RSI (14-period) is below the mid-point and showing a reading of ~42.734. Further, the prices are trading below the trend-following indicator 50-period SMA, which may act as a resistance zone in the near term. An important support level for the stock is at AUD 0.22, while the key resistance level is at AUD 0.27.
Considering the company's current price levels have facing resistance and momentum indicator analysis, a 'Watch' recommendation has been given on the stock. The stock was analysed as per the closing price of AUD 0.245 per share, down ~2.00% as of 3rd November 2022.
Individuals can evaluate the stock based on the support and resistance levels provided in the report in case of keen interest taking into consideration the risk-reward scenario.
Daily Technical Chart – PH2

Note 1: Past performance is neither an indicator nor a guarantee of future performance
Note 2: Investment decision should be made depending on an individual’s appetite for upside potential, risks, and any previous holdings. This recommendation is purely based on technical analysis, and fundamental analysis has not been considered in this report.
Note 3: Related Risks: This report may be looked at from high-risk perspective. Recommendations provided in this report are solely based on technical parameters, and the fundamental performance of the stocks has not been considered in the decision-making process. Other factors which could impact the stock prices include market risks, regulatory risks, interest rates risks, currency risks, social and political instability risks etc.
Technical Indicators Defined: -
Support: A level at which the stock prices tend to find support if they are falling, and a downtrend may take a pause backed by demand or buying interest. Support 1 refers to the nearby support level for the stock and if the price breaches the level, then Support 2 may act as the crucial support level for the stock.
Resistance: A level at which the stock prices tend to find resistance when they are rising, and an uptrend may take a pause due to profit booking or selling interest. Resistance 1 refers to the nearby resistance level for the stock and if the price surpasses the level, then Resistance 2 may act as the crucial resistance level for the stock.
Stop-loss: It is a level to protect further losses in case of unfavourable movement in the stock prices.
The Green colour line reflects the 21-period moving average. SMA helps to identify existing price trends. If the prices are trading above the 21-period, prices are currently in a bullish trend (Vice – Versa).
The Blue colour line reflects the 50-period moving average. SMA helps to identify existing price trends. If the prices are trading above the 50-period, prices are currently in a bullish trend (Vice – Versa).
The Orange colour line represents the Trendline.
The Purple colour line in the chart’s lower segment reflects the Relative Strength Index (14-Period), which indicates price momentum and signals momentum in trend. A reading of 70 or above suggests overbought status, while a reading of 30 or below suggests an oversold status.
Disclaimer
Kalkine New Zealand Limited is a Financial Advice Provider (“FAP”) and is authorised by a Transitional FAP license issued by Financial Markets Authority (“FMA”) to provide financial advice. Kalkine provides only general financial advice through its research reports following a person becoming a member. The reports contain buy/sell/hold and other recommendations in relation to equity financial products. The recommendations and opinions [on this website] / [in this report] do not take into account any of your investment objectives, financial situation or needs. Before you make a decision about whether to acquire a financial product, you should obtain the Product Disclosure Statement from the product issuer. You should consider the appropriateness of advice taking into account your own objectives, financial situation and needs and seek independent financial advice before making any financial decisions. If you act on the advice in the research reports, you may have to pay fees, expenses or other amounts (but not to Kalkine). Further information about the complaints and dispute resolution process, as well as information about Kalkine’s duties are available on Kalkine’s website. Please read our Financial Advice Provider (FAP) disclosure statement and Complaints Handling Guide, which are available on the website.

 Please wait processing your request...