Company Overview:
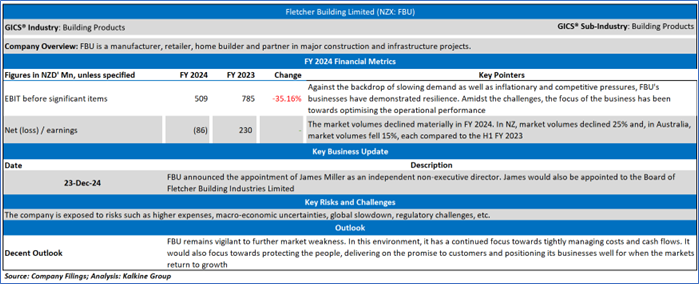
Fletcher Building Limited (NZX: FBU) is a manufacturer, retailer, home builder and partner in major construction and infrastructure projects.
Kalkine’s Daily Report covers the Investment Highlights, Key Financial Metrics, Risks, Outlook, Technical Analysis along with the Valuation, Target Price, and Recommendation on the stock.
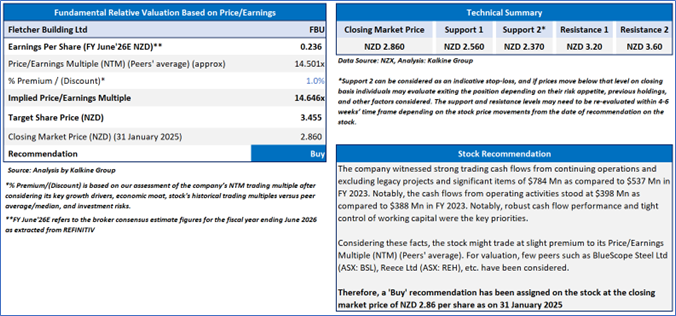
Fletcher Building Limited (NZX: FBU)
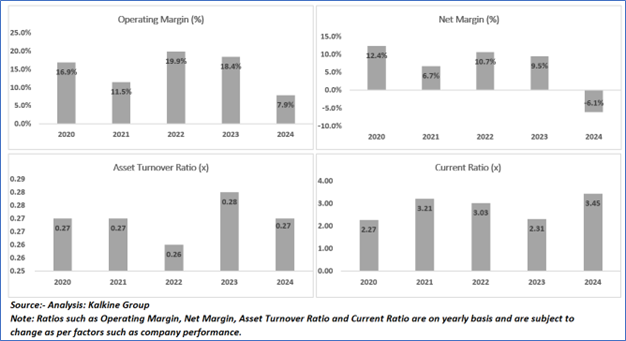
Section 1.0: Key Metrics in Pictures
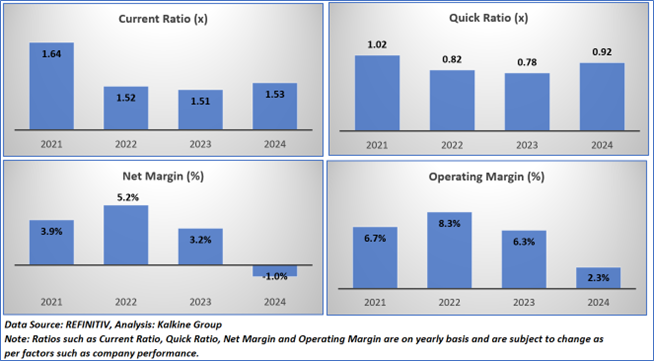
Having looked at the key metrics above, the below sections provide an in-depth fundamental, and technical analysis on 2 stocks for December 2024 along with a recommendation, technical support and resistance levels, and indicative stop-loss.
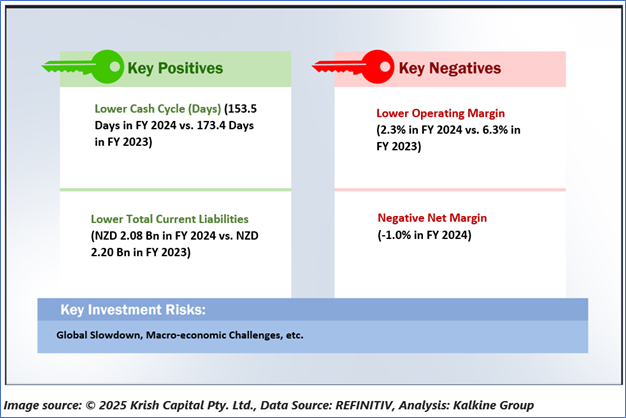
Section 2.0: Fletcher Building Limited (Buy at NZD 2.86 closing price as on 31st January 2025)
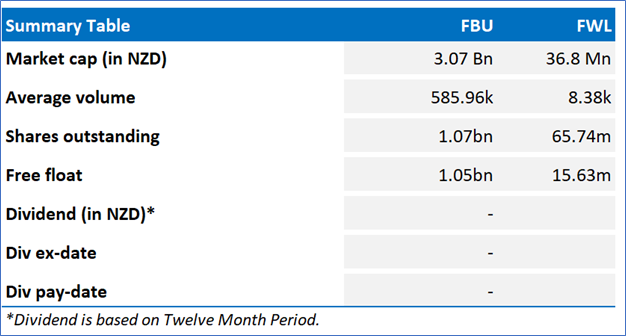
2.1 Company Details
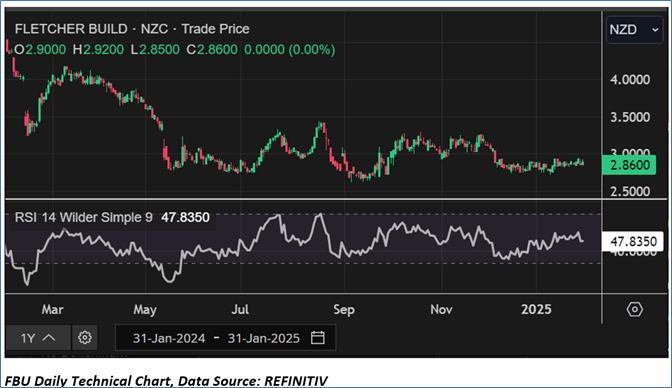
2.2 Valuation and Technical Guidance
The stock has witnessed a decline of ~6.04% in the last 6 months. The stock has a 52-week high and 52-week low of NZD 4.6421 and NZD 2.6166, respectively.
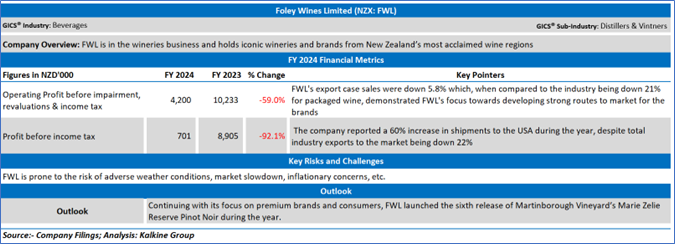
Foley Wines Limited (NZX: FWL)
Company Overview:
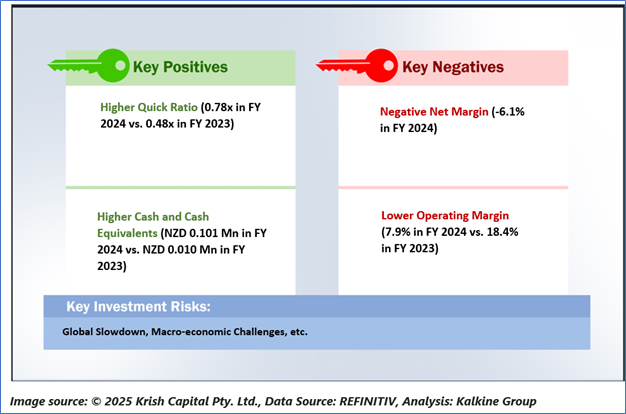
Foley Wines Limited (NZX: FWL) is an integrated wine company producing table wines with the marketing and sales of premium wines in New Zealand and various export markets.
Section 3.0: Key Metrics in Pictures
Having looked at the key metrics above, the below sections provide an in-depth fundamental, and technical analysis of one honey stock along with a recommendation, technical support, and resistance levels, and indicative stop-loss.
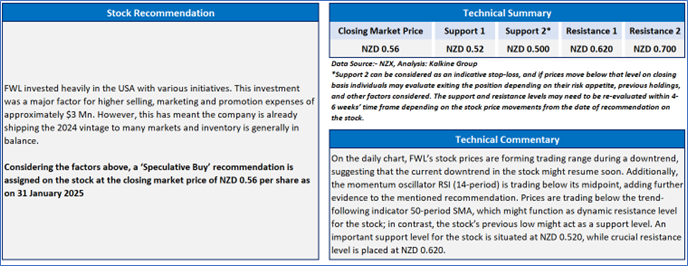
Section 4.0: Foley Wines Limited (Speculative Buy at NZD 0.56 closing price as of 31 January 2025)
2.1 Company Details
2.2 Valuation and Technical Guidance
The stock has witnessed a fall of ~24.3% in the 3 months. The stock has a 52-week high and 52-week low of NZD 1.19 and NZD 0.520, respectively.
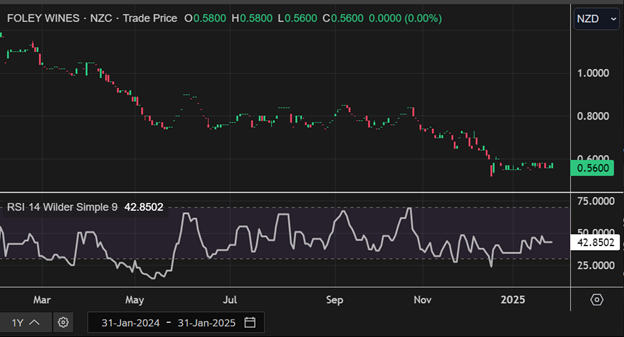
FWL Daily Technical Chart, Data Source: REFINITIV
Markets are trading in a highly volatile zone currently due to certain macro-economic and geopolitical tensions prevailing. Therefore, it is prudent to follow a cautious approach while investing.
Note 1: Past performance is not a reliable indicator of future performance.
Note 2: The reference date for all price data, currency, technical indicators, support, and resistance levels is 31 January 2025. The reference data in this report has been partly sourced from REFINITIV.
Note 3: Investment decisions should be made depending on an individual's appetite for upside potential, risks, holding duration, and any previous holdings. An 'Exit' from the stock can be considered if the Target Price mentioned as per the Valuation and or the technical levels provided has been achieved and is subject to the factors discussed above.
Note 4: Kalkine reports are prepared based on the stock prices captured either from REFINITIV or Trading View. Typically, REFINITIV or Trading View may reflect stock prices with a delay which could be a lag of 25-30 minutes. There can be no assurance that future results or events will be consistent with the information provided in the report. The information is subject to change without any prior notice.
Technical Indicators Defined: -
Support: A level at which the stock prices tend to find support if they are falling, and a downtrend may take a pause backed by demand or buying interest. Support 1 refers to the nearby support level for the stock and if the price breaches the level, then Support 2 may act as the crucial support level for the stock.
Resistance: A level at which the stock prices tend to find resistance when they are rising, and an uptrend may take a pause due to profit booking or selling interest. Resistance 1 refers to the nearby resistance level for the stock and if the price surpasses the level, then Resistance 2 may act as the crucial resistance level for the stock.
Stop-loss: It is a level to protect further losses in case of unfavourable movement in the stock prices.
 Please wait processing your request...