Orora Limited (ASX: ORA)
Orora Limited (ASX: ORA) is engaged in the packaging distribution business which is located within North America and is focused on the distribution of packaging materials.
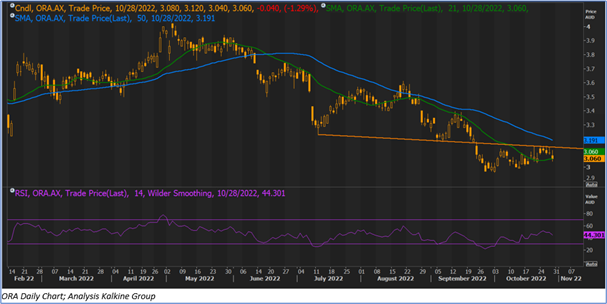
Technical Analysis: On the daily chart, ORA’s stock prices are facing the resistance of the downward-sloping trendline, indicating the possibility of a downward move hereon. Moreover, RSI (14-period) is moving below the mid-point and showing a reading of 44.301 and supporting a downside correction. The prices are trading below the trend-following indicator 50-period SMA, which may act as a resistance level for the stock. An important support level for the stock is placed at AUD 2.700 while the key resistance level is placed at AUD 3.500.
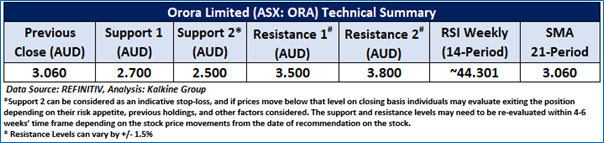
Individuals can evaluate the stock based on the support and resistance levels provided in the report in case of keen interest taking into consideration the risk-reward scenario.
Considering the company’s current price levels encountering resistance at the falling channel, momentum oscillator analysis, therefore a ‘Watch’ recommendation is given on the stock. The stock was analysed as per the closing price of AUD 3.060 per share, as on 28th October 2022, down by ~1.290%.
Daily Technical Chart – ORA
Core Lithium Ltd (ASX: CXO)
Core Lithium Ltd (ASX: CXO) is a lithium exploration company that is engaged in the exploration of lithium, copper (+/- silver and uranium) deposits in the Northern Territory and South Australia.
Contract Expiry with Tesla: As announced on October 28, 2022, the definitive purchase agreement with Tesla expired on October 26, 2022.
Updates on the Finniss Lithium Mine: CXO commenced the operations of the Finniss Lithium Mine with the sale of 15k tonnes of Direct Shipping Ore (DSO). This indicates the strong international market demand. The company already sealed the offtake agreement to supply about 80% of DSO from the Finniss Lithium Mine with Ganfeng and Yahua over the first four years of operations.
Fundraising and Drilling Updates: On October 3, 2022, it raised AUD 100mn through institutional placement, which will be utilized to proceed with the accelerated resources definition, extensional and exploration drilling at the Finniss Lithium project. On October 5, 2022, it received favorable drilling results at its BP33 deposits, part of the Finniss Lithium project.
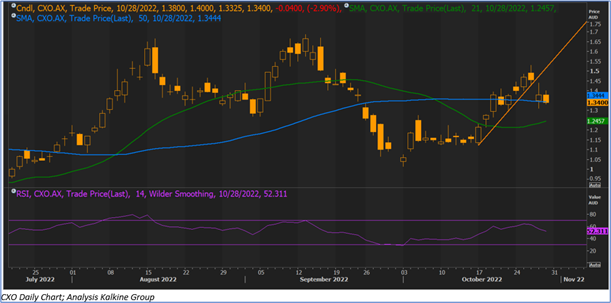
Technical Analysis: On the daily chart, CXO prices recently broke a rising trendline on the downside and trading below the breakdown level, indicating the possibility of downside correction hereon. The momentum oscillator RSI (14-period) is near the mid-point and shows a reading of ~52.311. However, the prices are trading above the trend-following indicator 21-period SMA and 50-period SMA, which may act as a support zone in the near term. An important support level for the stock is placed at AUD 1.2000 while the key resistance level is placed at AUD 1.5000.
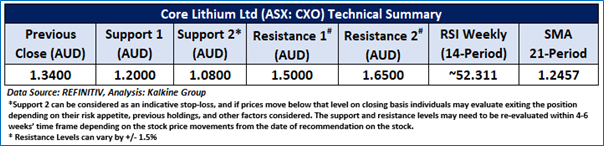
Individuals can evaluate the stock based on the support and resistance levels provided in the report in case of keen interest taking into consideration the risk-reward scenario.
Considering the company's current price levels are trading below the breakdown level, and momentum indicator analysis, a 'Watch' recommendation has been given on the stock. The stock was analysed as per the closing price of AUD 1.340 per share, as of 28th October 2022, down by ~2.898%.
Daily Technical Chart – CXO
Note 1: Past performance is neither an Indicator nor a guarantee of future performance.
Note 2: Investment decision should be made depending on an individual’s appetite for upside potential, risks, and any previous holdings. This recommendation is purely based on technical analysis, and fundamental analysis has not been considered in this report.
Note 3: Related Risks: This report may be looked at from high-risk perspective. Recommendations provided in this report are solely based on technical parameters, and the fundamental performance of the stocks has not been considered in the decision-making process. Other factors which could impact the stock prices include market risks, regulatory risks, interest rates risks, currency risks, social and political instability risks etc.
Technical Indicators Defined: -
Support: A level at which the stock prices tend to find support if they are falling, and a downtrend may take a pause backed by demand or buying interest. Support 1 refers to the nearby support level for the stock and if the price breaches the level, then Support 2 may act as the crucial support level for the stock.
Resistance: A level at which the stock prices tend to find resistance when they are rising, and an uptrend may take a pause due to profit booking or selling interest. Resistance 1 refers to the nearby resistance level for the stock and if the price surpasses the level, then Resistance 2 may act as the crucial resistance level for the stock.
Stop-loss: It is a level to protect further losses in case of unfavourable movement in the stock prices.
The Green colour line reflects the 21-period moving average. SMA helps to identify existing price trends. If the prices are trading above the 21-period, prices are currently in a bullish trend (Vice – Versa).
The Blue colour line reflects the 50-period moving average. SMA helps to identify existing price trends. If the prices are trading above the 50-period, prices are currently in a bullish trend (Vice – Versa).
The Orange colour line represents the Trendline.
The Purple colour line in the chart’s lower segment reflects the Relative Strength Index (14-Period), which indicates price momentum and signals momentum in trend. A reading of 70 or above suggests overbought status, while a reading of 30 or below suggests an oversold status.
Disclaimer
Kalkine New Zealand Limited is a Financial Advice Provider (“FAP”) and is authorised by a Transitional FAP license issued by Financial Markets Authority (“FMA”) to provide financial advice. Kalkine provides only general financial advice through its research reports following a person becoming a member. The reports contain buy/sell/hold and other recommendations in relation to equity financial products. The recommendations and opinions [on this website] / [in this report] do not take into account any of your investment objectives, financial situation or needs. Before you make a decision about whether to acquire a financial product, you should obtain the Product Disclosure Statement from the product issuer. You should consider the appropriateness of advice taking into account your own objectives, financial situation and needs and seek independent financial advice before making any financial decisions. If you act on the advice in the research reports, you may have to pay fees, expenses or other amounts (but not to Kalkine). Further information about the complaints and dispute resolution process, as well as information about Kalkine’s duties are available on Kalkine’s website. Please read our Financial Advice Provider (FAP) disclosure statement and Complaints Handling Guide, which are available on the website.

 Please wait processing your request...