
Company Overview: Z Energy Limited is a New Zealand-based company engaged in supplying fuel to retail and commercial customers. For motorists, the Company offers fuels, such as ZX Premium Unleaded, Z91 Unleaded, Z Bio D Biodiesel and Z Diesel. The Company also operates Z shop at approximately 200 locations across New Zealand. The Z shop offers food, Z Espress coffee, gift cards, discount vouchers and bathrooms. For business, the Company offers fuels, such as Z Diesel Emission Cleaner, diesel, aviation fuel, marine fuel and Z Bio D biodiesel. The Company also supplies bulk fuel to trucking companies, airlines, transport firms, construction companies, power generators, farmers, loggers and mining operations. The Company also supplies bitumen to roading companies. The Company also offers Z Card for business customers. The Company's subsidiaries include Harbour City Property Investments Limited, Z Energy ESPP Trustee Limited and Z Energy LTI Trustee Limited.

ZEL Details
Long Term Growth Strategy Remains Intact: Z Energy Limited (NZX: ZEL) supplies fuel to retail and large commercial customers like airlines, trucking companies, mines, shipping companies and vehicle fleet operators. It also provides bitumen to roading contractors. Z Energy Limited now owns and manages a 15.4 percent stake in Refining NZ, which runs New Zealand’s only oil refinery and a 25 percent stake in Loyalty New Zealand, which runs Fly Buys. It has about 208 service stations (with about 160 truck stops), pipelines, terminals and bulk storage terminal infrastructure around the country.
The company has proved itself in terms of delivering good results over the period of times. Through diversifying business, it has ensured synergy and sustainability of good performances. Top-line of the company has grown at a CAGR of 15.49% over the period of FY15-FY19. The company’s net income has also grown at an outstanding CAGR of 127.65% in the time period between FY15 to FY19, which shows the company’s operating efficiencies. The company’s balance sheet is decent, which reflects upon its ongoing commitment to financial discipline and effective cash management. As of March 30, 2019, the company had total debt amounting to $938 million, and debt/equity stood at 1.04x. Amidst the challenging environment, the company managed to declare an interim dividend amounting to 16.5 cents per share, which is equivalent to the pay-out ratio of 65% of operating cash flow.
FY19 Results Impacted by Challenging Environment: FY19 was a challenging year for Z Energy Limited due to significant market volatility, with the Brent indicator trading between US$51 and US$84 per barrel in the last six months of FY19. The company’s business is based on global commodity where the prices can move unpredictably and quickly. During the year, the company registered historical cost net profit after tax (HC NPAT) of $186 million, down 29% from the previous corresponding period (PCP) due to crude price movements in the year, steadily rising in the first half then falling steeply during the third quarter to end the year largely flat.
The company’s replacement cost EBITDAF (RC EBITDAF) stood at $434 million for the year, in line with the guidance provided and represents a decrease of $15 million (3%) against the pcp. The replacement cost net profit after tax (RC NPAT) was $178 million, down 13% due to lower refining margins from the unexpected and prolonged shutdown of Refining New Zealand in the first half of the year combined with record-high pump prices that affected retail fuel volumes and margin.
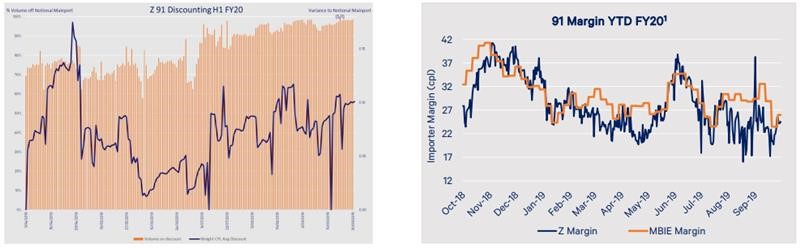
Retail Fuel Pricing (Source: Company Reports)
Top 10 Shareholders: The following table provides a broader overview of the top 10 shareholders in ZEL:
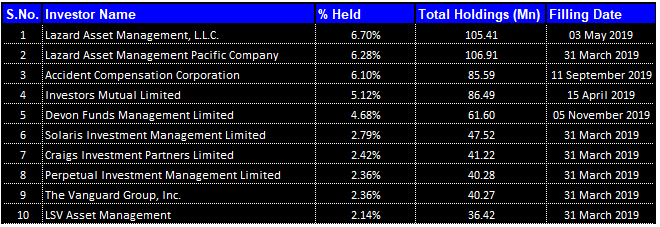
Top 10 Shareholders (Source: Thomson Reuters)
Overview on Key Metrics: The company’s Debt/Equity ratio stood at 1.04x in FY19 against 1.05x in FY18. This reflects upon management bid to deleverage its balance sheet. The lower debt on the balance sheet generally reflects that the company has a stabilised balance sheet, and it can focus on its long-term strategic goals. Notably, the company’s current ratio stood at 1.42x in FY 2019 as compared to 1.12x FY2018. Improvement in current ratio means improved ability to meet its short-term obligations and enable the company to deploy the surplus fund towards growth initiatives. RoE in FY19 stood at 21.4%, which is higher than the industry median of 13.2%. This indicates that the company is providing decently high returns to its shareholders, which could help it in attracting the attention of market participants.
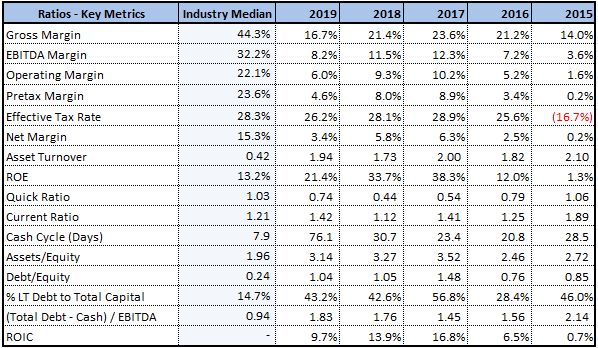
Key Metrics (Source: Thomson Reuters)
Despite Challenging Year, Company Increased its Dividends: For FY19, the company declared a fully imputed final dividend of 30.5 cents per share, bringing total dividends for the year to 43.0 cents per share for a total cash dividend of $172 million, an increase of 33%. During the year, the company also simplified its dividend policy. The company will pursue to pay ordinary dividends of 70%-85% of operating cashflow.
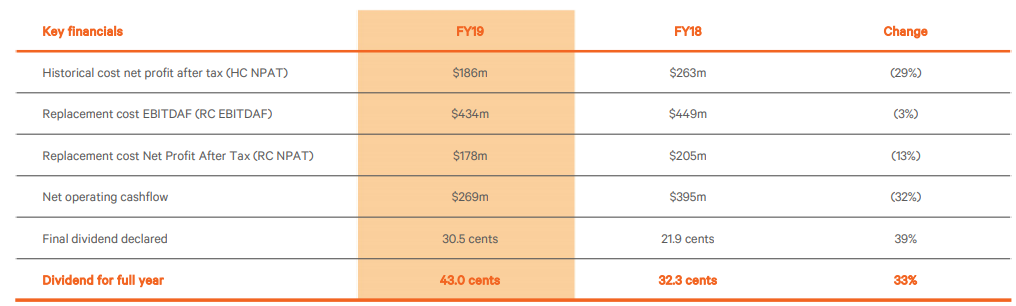
FY19 Financial Highlights (Source: Company Reports)
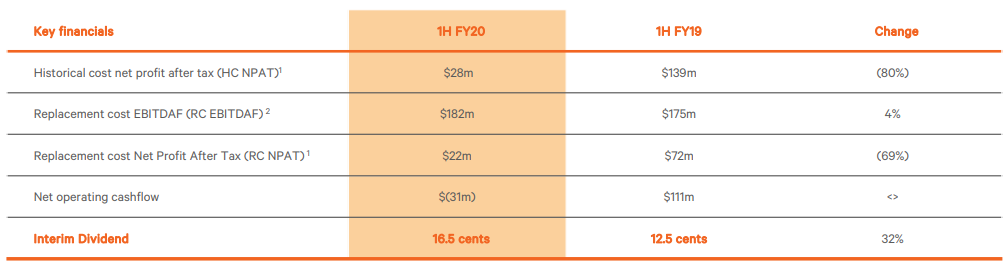
H1FY20 Results Impacted by Intense Retail Price Competition: For the six months to 30 September 2019, the company reported HC NPAT of $28 million, down 80% from $139 million in the pcp, driven by a reduction in global commodity prices, lower retail fuel margins and a weaker NZD compared to pcp partially offset by increased refining margins. The company reported RC EBITDAF of $182 million, up 4% from $175 million in the pcp and RC NPAT of $22 million, down 69% from $72 million in the pcp. The company’s total marketing volume for the first half decreased by 2.4% on pcp to 1,921 million litres. For the first half, the company declared a fully imputed interim dividend of 16.5 cents per share, up 32% from 12.5 cents per share compared to the pcp.
H1FY20 Financial Highlights (Source: Company Reports)
High Competition in Retail Market Severely Affected Trading: The competition in the retail fuels market was exceptional and highlighted the build-out of new to industry (NTI) sites in recent years. In the last couple of years, the company saw an average of around 20 new sites coming to market each year. This has an effect of increasing industry capacity against a backdrop of flat to negative total industry demand. In the last six months, the company’s financials are being adversely affected by intense retail fuel competition, which has spread to new areas in New Zealand.
Launch of Pumped & Caltex and Exit from AA Smartfuel: As a part of strategic move, the company in the month of August, ended its participation in the AA Smartfuel loyalty program and the company owned and operated, Pumped loyalty scheme which has been extended to the Caltex network. The competitors of the company viewed it as an opportunity to grow market share. Their response was to offer greater levels of discount or marketing promotion to capture market share.
Investment in Flick Electric: The company invested $46 million to acquire 70% in Flick Electric last year. Flick Electric is an electricity disruptor and retailers that permit its customers the choice between accessing the wholesale electricity spot market or a low, fixed-price product. Flick lost its customers on its core spot market product due to unseasonably high spot prices in October 2018. The company did an outstanding job in standing up a fixed-price product, but Flick did incur customer losses. Because of the losses in customers, the company wrote down the value of Flick investment by $35 million to more accurately reflect the current valuation of the Flick business.
Generating value for Shareholders: The company is dedicated to reducing its debt and returning the cash to its shareholders. During the first half of 2020, the company repaid $20 million of debt principal and reduced its debt leverage, defined as gross debt to RC EBITDAF, to 2.1x on a non-IFRS adjusted basis, which was down from 2.4x as compared to pcp. Adjusting for IFRS-16, the company had a debt leverage of 2.6x, and it aims to progressively reduce its debt towards a 2.0x debt to RC EBITDAF level. The company’s interim dividend of 16.5 cents per share represents its dividend policy of a payout ratio of 65% of operating cashflow.
Competition in Retail Environment: The company’s retail trading conditions are challenging due to elevated price competition. Despite the current trading environment, the company’s volume performance has shown improvement during 3QFY20. The current market conditions reflect a decline in both refining and retail margins, and this has been further exaggerated by the December drop in refining margins. The company expects that the impact of reduced retail margins for the balance of 3QFY20 and 4QFY20 will negatively impact EBITDAF earnings by $15 million.
Company Expects Certain Headwinds for Full Year FY20 while it retains a decent position : For the quarter of December and full-year FY20, the company is expecting a reduction in operational performance due to the continued price discounting in the retail fuel market and the negative impact of low refining margins. The company has revised its guidance for FY20 EBITDAF to be in the range of $350 million to $385 million from the previous range of $390 million to $430 million because of weaker than expected refining margins. Because of the reduction in earnings, the company has also reduced its dividend guidance for FY20 from 48 cents per share to 40 cents per share. The company has also reduced its earnings guidance from $450 million to $490 million to currently $350 million to $385 million. The reduction of $120 million can be split into $20 million in lower refining margins and the company’s response to the changes arising from MARPOL and $90 million in lost retail margins.
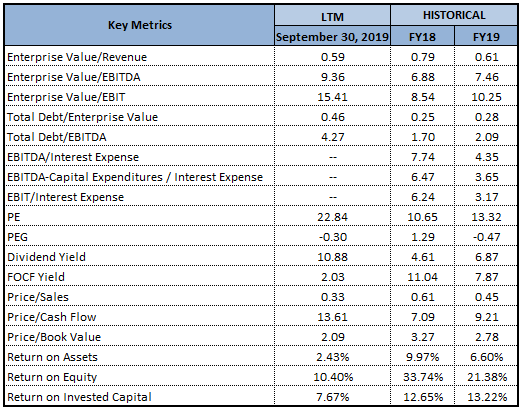
Key Valuation Metrics (Source: Thomson Reuters)
Valuation Methodology: Price to Cash Flow Multiple Approach
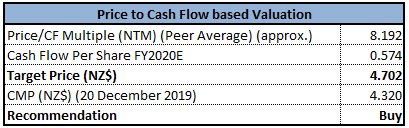
Price to Cash Flow Based Valuation (Source: Thomson Reuters), NTM: Next Twelve Months
Note: All forecasted figures and peers have been taken from Thomson Reuters
Technical Perspective:
Monthly Chart-
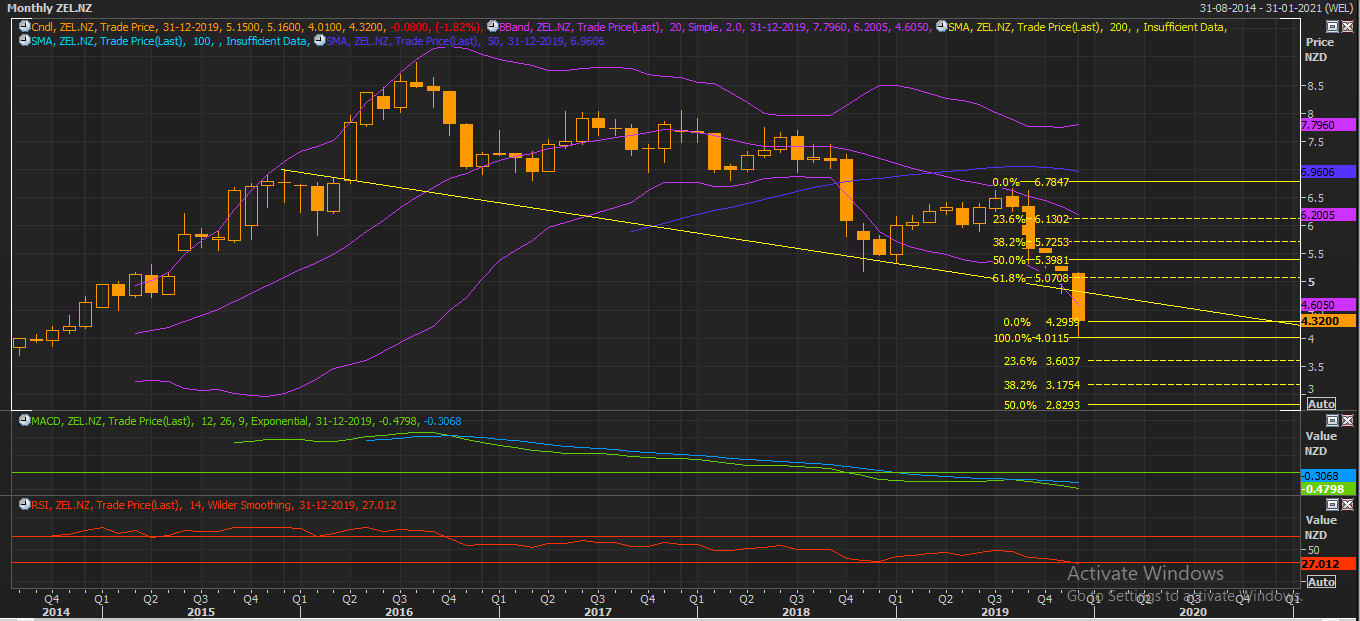
Monthly Chart (Source: Thomson Reuters)
Weekly Chart-
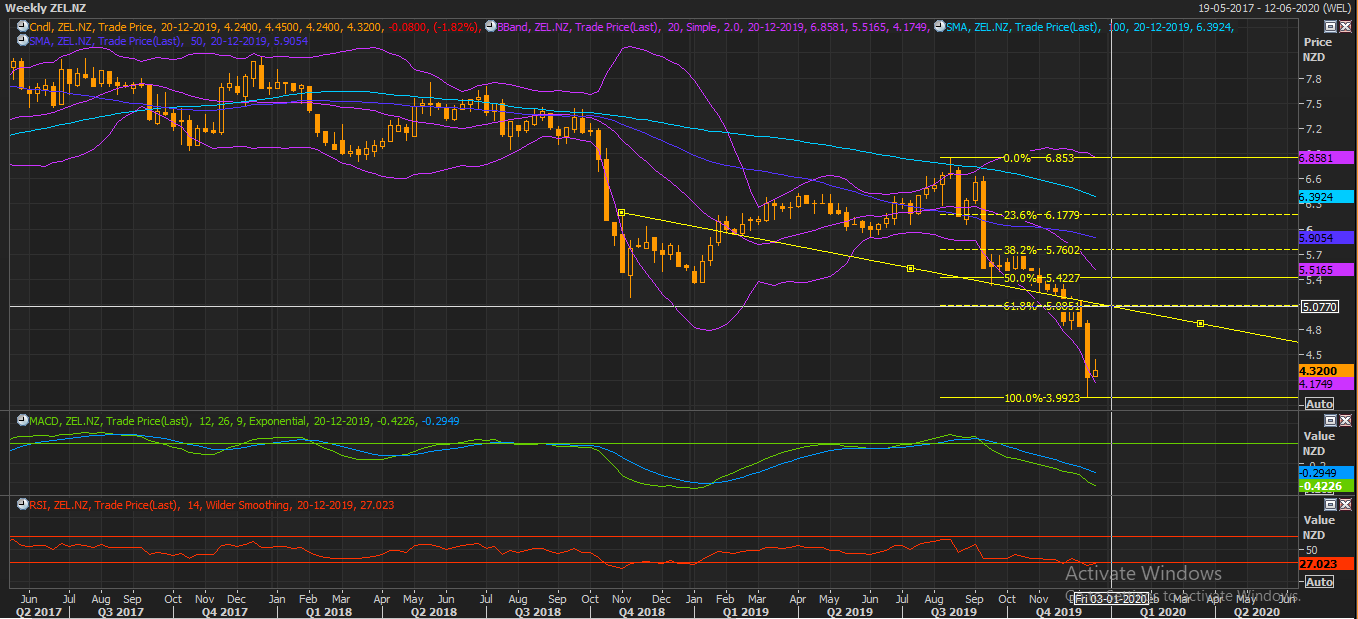
Weekly Chart (Source; Thomson Reuters)
Note: Horizontal yellow lines are Fibonacci retracements and projections. Yellow line downward slopping is trend line. Brinjal colour lines are Bollinger Bands whereas blue and deep blue are 100 and 50 DMA respectively
Stock Recommendation: The company’s stock has witnessed a fall of ~16.091% in the span of the previous one month, while, in the time frame of the previous three months, the stock fell ~21.081%. The stock is trading below the average of 52-week high and low levels of $4.01 and $6.85, respectively, indicating a decent opportunity for accumulation. Considering the aforesaid facts, we have valued the stock using a relative valuation method, i.e., price to cash flow multiple, and arrived at a target price of high single-digit growth (in % term). We give a “Buy” recommendation on the stock at the current market price of $4.320 (down 1.82% on 20 December 2019).
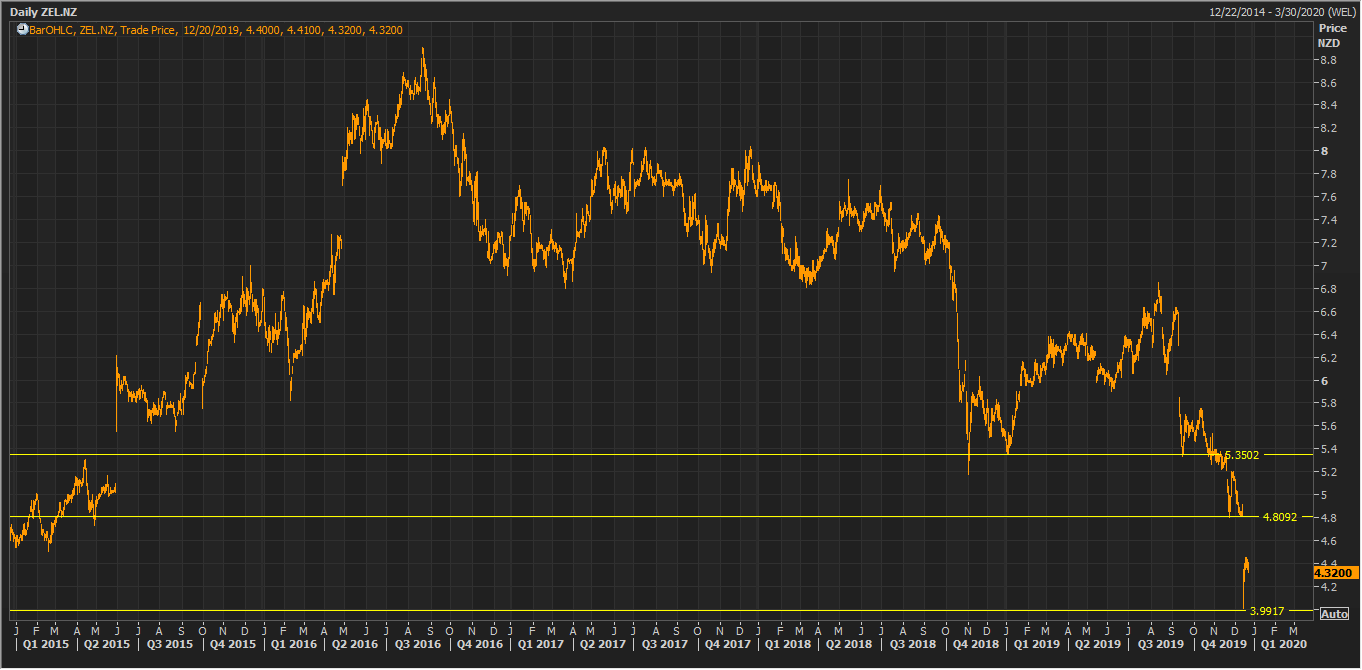
ZEL Daily Technical Chart (Source: Thomson Reuters)
Disclaimer
Kalkine New Zealand Limited is authorised to provide class advice only. The information on this site does not take into account any of your investment objectives, financial situation or needs. Before you make a decision about whether to acquire a financial product, you should obtain the Product Disclosure Statement from the product issuer. You should consider the appropriateness of advice taking into account your own objectives, financial situation and needs and seek independent financial advice before making any financial decisions.
Past performance is not a reliable indicator of future performance.
 Please wait processing your request...