
This report is an updated version of the report published on 14 November 2024 at 3:55 PM AEDT.
Company Overview: Smartgroup Corporation Ltd (ASX: SIQ) is an Australia-based company that provides outsourced administration, fleet management, software, distribution, and group services. Kelsian Group Limited (ASX: KLS) is an Australia-based integrated multi-modal transport provider and tourism operator. The company’s segments include Marine and Tourism, Australian Bus and International Bus. Kalkine’s Sector Report covers the Investment Summary, Sector Overview & Supporting Catalysts, Data Insights & Analysis, Financial Metrics, Financial Commentary, Risks, Outlook, Technical Analysis along with the Valuation, Target Price, and Recommendation on selected stocks.
Investment Summary
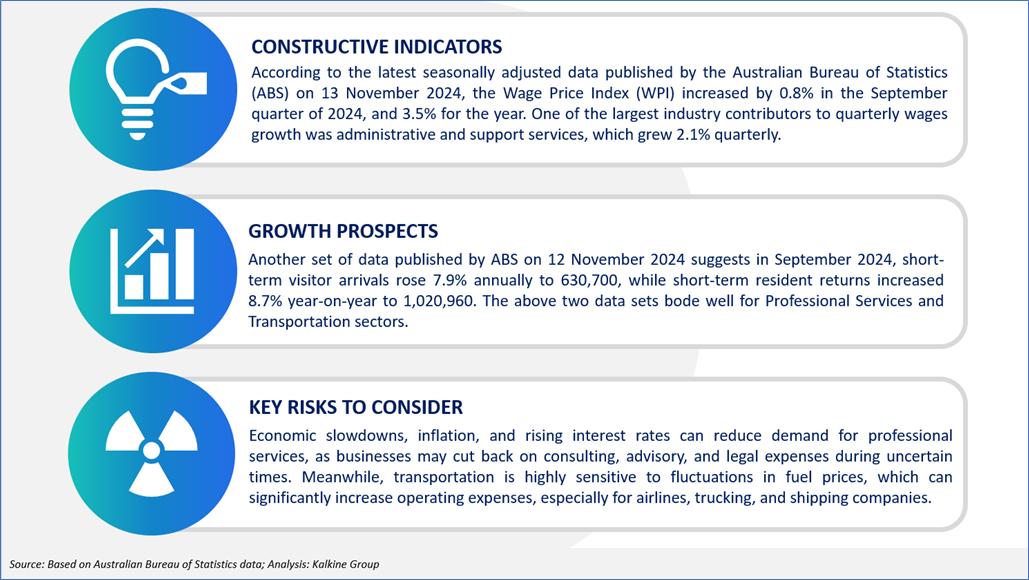
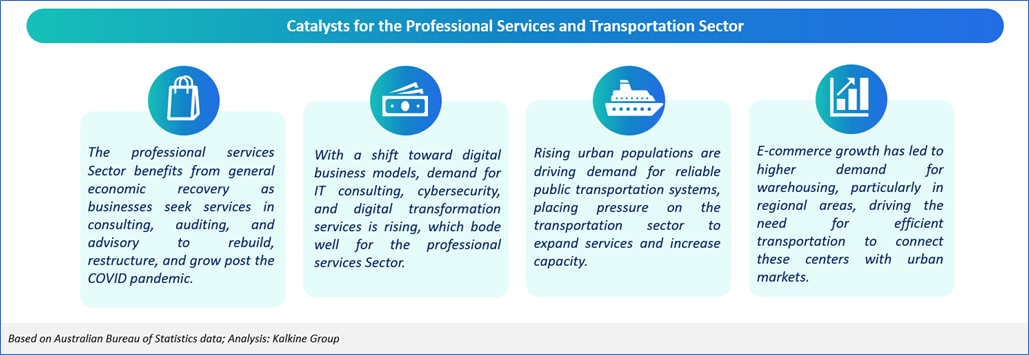
Sector Overview and Supporting Catalysts
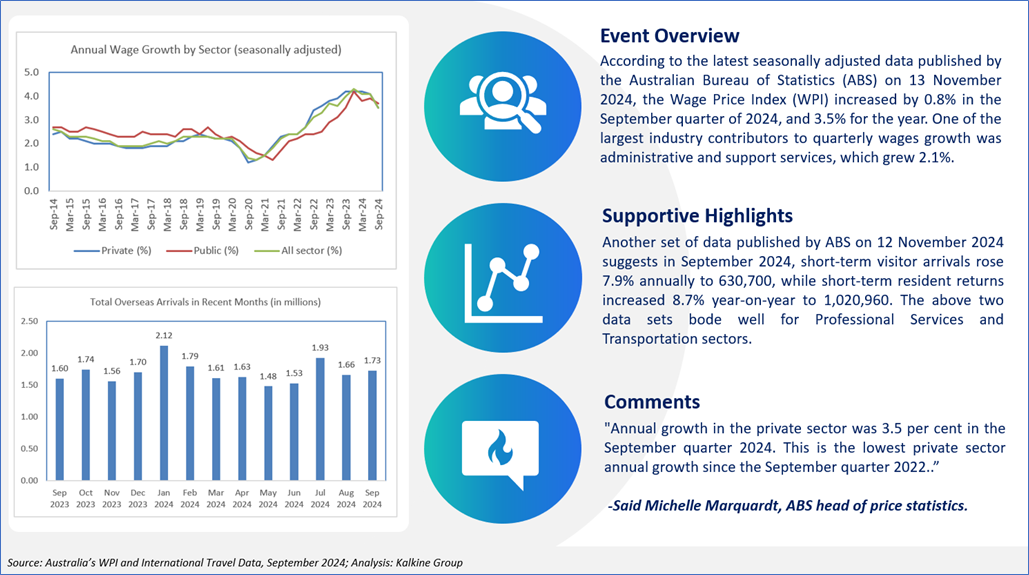
Data Insights and Analysis
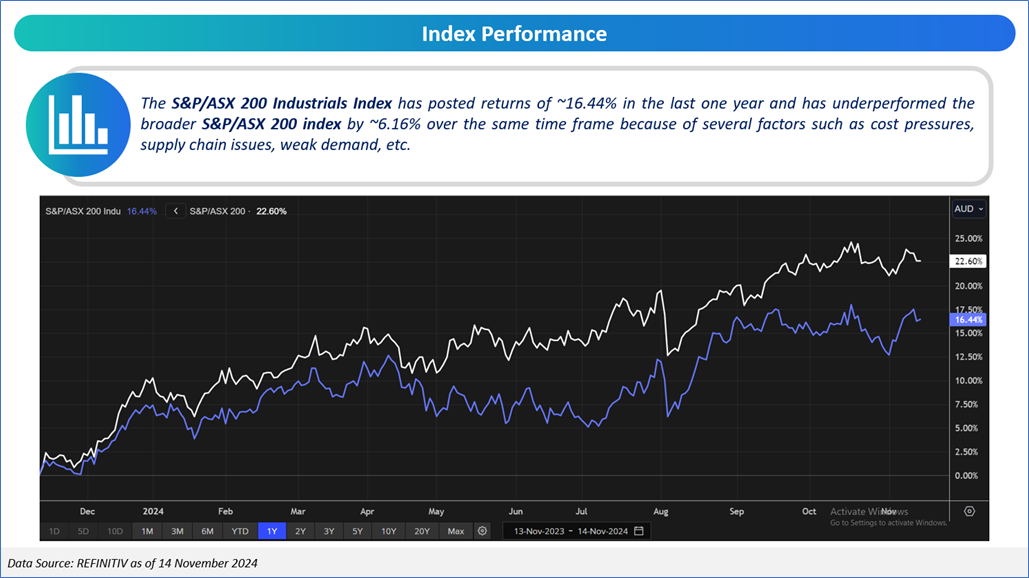
Index Performance
Investment theme and stocks under discussion (SIQ, KLS)
After understanding the sector, let us now look at two companies from the professional services and transportation sector listed on the ASX. The price potential of the companies under discussion have been analysed based on P/E and EV/EBITDA relative valuation methods, respectively.
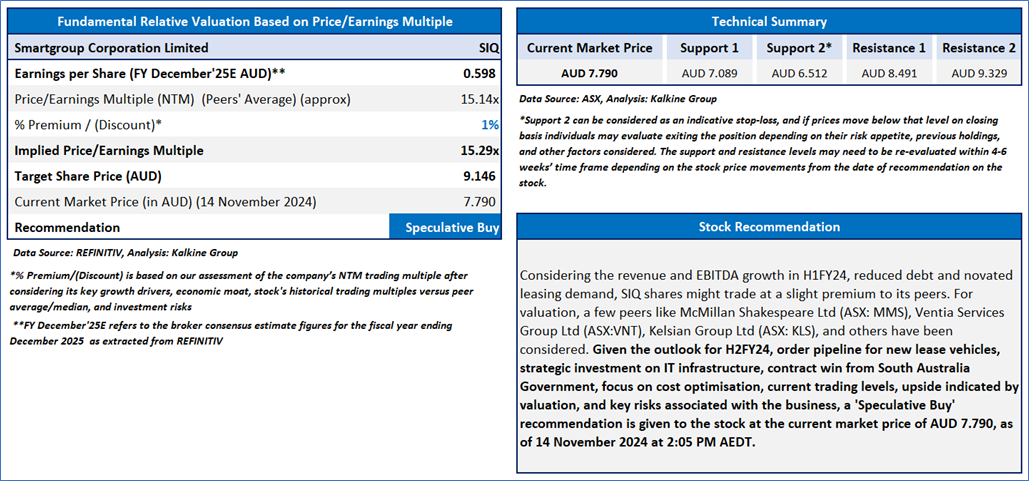
1. ASX: SIQ (Smartgroup Corporation Ltd)
(Recommendation: ‘Speculative Buy’ at AUD 7.790; Potential Upside: Low Double-Digit; MCap: AUD 1.07bn)
SIQ is an Australia-based company that provides outsourced administration, fleet management, software, distribution, and group services.
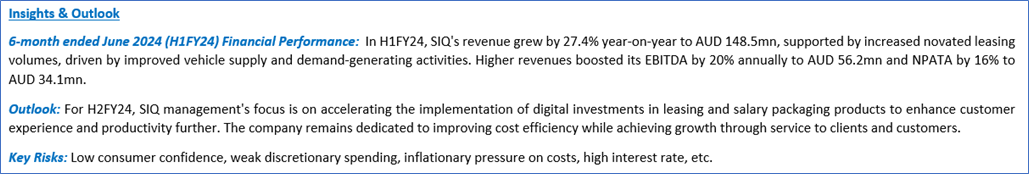
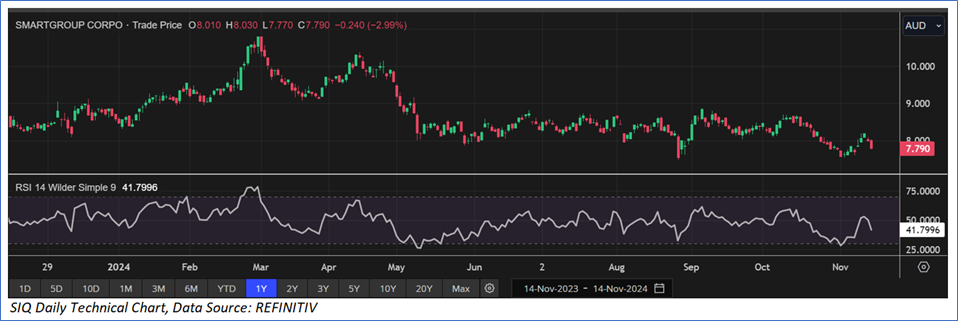
The stock has declined by ~7.37% in the last six months, and over the last nine months, it has corrected by ~17.13%. The stock has a 52-week low and 52-week high of AUD 7.480 and AUD 10.970, respectively, and is currently trading below the 52-week high-low average. SIQ was last covered in a report dated ‘3 September 2024’.
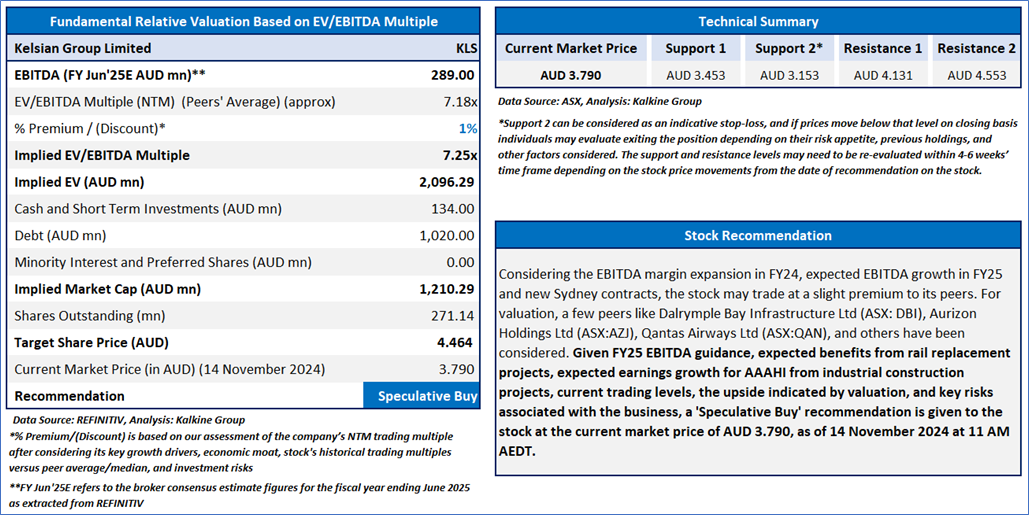
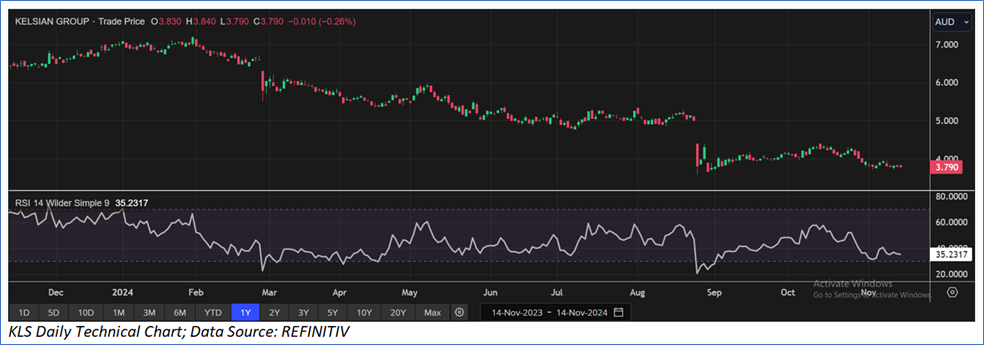
2. ASX: KLS (Kelsian Group Limited)
(Recommendation: ‘Speculative Buy’ at AUD 3.790, Potential Upside: Low Double-Digit; MCap: AUD 1.03bn)
KLS is an Australia-based integrated multi-modal transport provider and tourism operator. The company’s segments include Marine and Tourism, Australian Bus and International Bus.
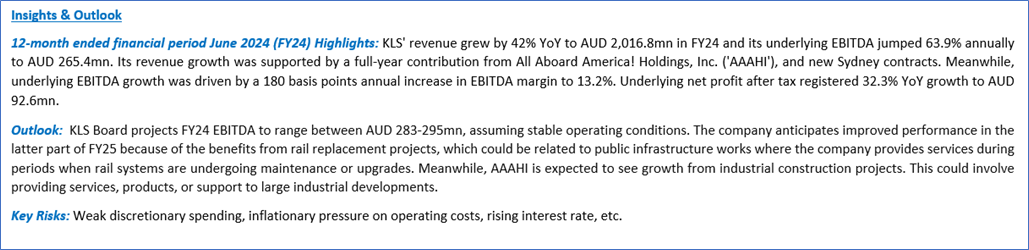
The stock has witnessed a correction of ~29.74% in last six months, and over the last 9 months, it has declined by ~42.45%. The stock has a 52-week low and 52-week high of AUD 3.580 and AUD 7.200, respectively and is currently trading below the 52-week high-low average. KLS was last covered in a report dated ‘17 October 2024’.
Markets are trading in a highly volatile zone currently due to certain macro-economic issues and geopolitical tensions prevailing. Therefore, it is prudent to follow a cautious approach while investing.
Note 1: Past performance is neither an Indicator nor a guarantee of future performance.
Note 2: The reference date for all price data, currency, technical indicators, support, and resistance levels is 14 November 2024. The reference data in this report has been partly sourced from REFINITIV.
Note 3: Investment decisions should be made depending on an individual’s appetite for upside potential, risks, holding duration, and any previous holdings. An ‘Exit’ from the stock can be considered if the Target Price mentioned as per the Valuation and or the technical levels provided has been achieved and is subject to the factors discussed above.
Technical Indicators Defined: -
Support: A level at which the stock prices tend to find support if they are falling, and a downtrend may take a pause backed by demand or buying interest. Support 1 refers to the nearby support level for the stock and if the price breaches the level, then Support 2 may act as the crucial support level for the stock.
Resistance: A level at which the stock prices tend to find resistance when they are rising, and an uptrend may take a pause due to profit booking or selling interest. Resistance 1 refers to the nearby resistance level for the stock and if the price surpasses the level, then Resistance 2 may act as the crucial resistance level for the stock.
Stop-loss: It is a level to protect further losses in case of unfavourable movement in the stock prices.
Disclaimer This report has been issued by Kalkine New Zealand Limited (FSP691351) (NZBN:9429047678101) (“Kalkine”). Kalkine is a Financial Advice Provider (“FAP”) and is authorised by a Class 1 Financial Advice Provider Licence issued by Financial Markets Authority (“FMA”) to provide financial advice. Kalkine provides only general financial advice through its research reports following a person becoming a member. The reports contain buy/sell/hold and other recommendations in relation to equity securities, managed funds and other managed investment schemes and other financial advice products. The recommendations and opinions in this report and on Kalkine website do not take into account any of your investment objectives, financial situation or needs. Before you make a decision about whether to acquire a financial product, you should obtain the Product Disclosure Statement from the product issuer. You should consider the appropriateness of advice taking into account your own objectives, financial situation and needs and seek independent financial advice before making any financial decisions. If you act on the advice in the research reports, you may have to pay fees, expenses or other amounts (but not to Kalkine). Further information about the complaints and dispute resolution process, as well as information about Kalkine’s duties are available on Kalkine’s website. Please read our Financial Advice Provider (FAP) disclosure statement and Complaints Handling Guide, which are available on the website.
Past performance is not a reliable indicator of future performance.
 Please wait processing your request...