
I. Sector Landscape and Outlook
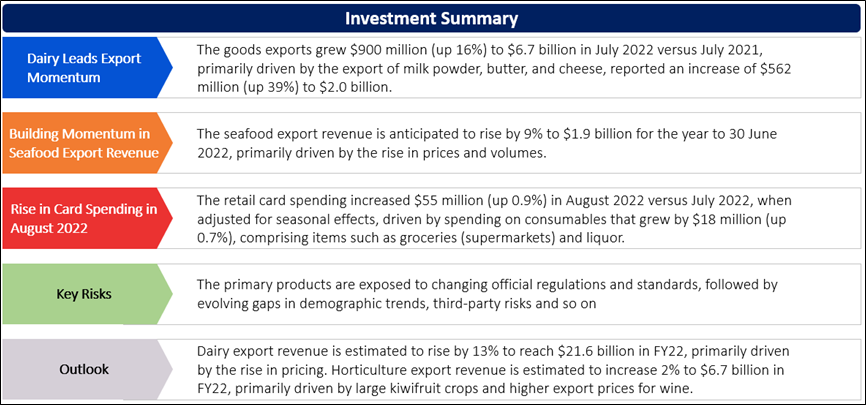
As per the Ministry for Primary Industries (MPI), the dairy export revenue is forecasted to report a lower double-digit rise by ~13% to reach the $21.6 billion mark by 30 June 2022. The seafood export revenue is estimated to increase by 9% to reach $1.9 billion in the year to 30 June 2022, primarily due to the reopening of food services and the demand rebounding. The horticulture export revenue is anticipated to increase by 2% to $6.7 billion in the year to 30 June 2022, mainly led by large kiwifruit crops and improved export prices for wine. However, disruption due to the Russia-Ukraine war, elevated inflation, rise in key rates by central banks, lower corporate capital expenditure and tepid demand could provide some risk to future growth.
Dairy Leads Export Momentum
As per Stats.NZ, goods exports grew $900 million (up 16%) to $6.7 billion in July 2022 versus July 2021, primarily driven by the export of milk powder, butter, and cheese, reported an increase of $562 million (up 39%) to $2.0 billion. The increase was mostly seen in butter and dairy spreads, which grew by $254 million (97%) in value to $515 million. The overall quantity grew 54%, and the unit value grew 28% in July 2022. In line with this, milk powder value grew by $254 million (33%), to $1.0 billion. The total quantity grew by 7.0%, and the average unit value increased by 24%.
Exhibit 1: Milk Powder Exports, Average Value Per kg ($), January 2020–July 2022
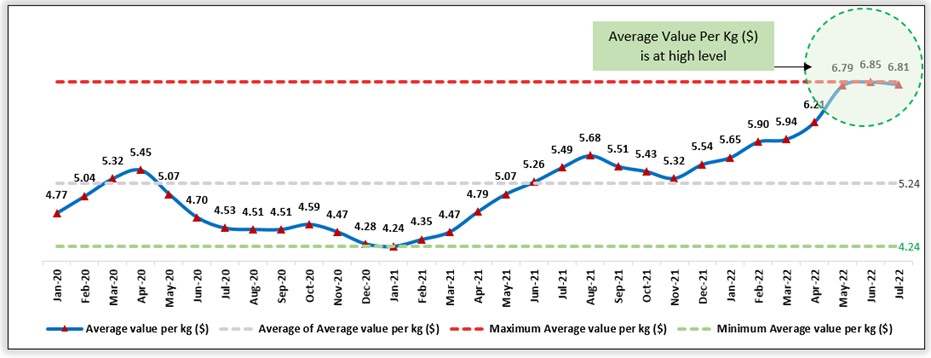
Data Source: This work is based on/includes Stats NZ’s data which are licensed by Stats NZ for reuse under the Creative Commons Attribution 4.0 International Licence; Chart Created by Kalkine Group
Building Momentum in Seafood Export Revenue
As per MPI, seafood export revenue is anticipated to rise by 9% to $1.9 billion for the year to 30 June 2022, primarily driven by the rise in prices and volumes. The bounce back in prices was mainly due to restricted global supply, demand revival and the opening of food services. Wild capture and aquaculture exports reported a revival in sales volume due to a recovery in international demand. Going forward, the drive in the aquaculture industry will be led by open ocean salmon farming. The decisions are expected soon, with each application representing potentially substantial lifts in production.
Exhibit 2: Trend in Seafood Export Revenue 2018–26F (Year to 30 June, NZ$ million)
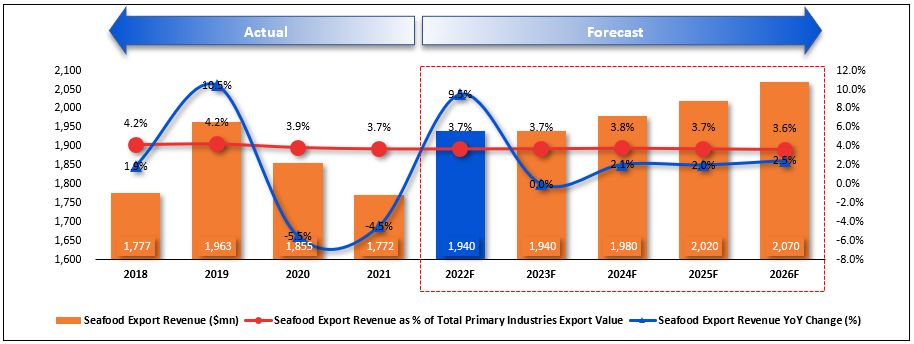
Data Source: This work is based on/includes the Ministry for Primary Industries data which are licensed under Crown for reuse under the Creative Commons Attribution 4.0 International Licence; Chart Created by Kalkine Group
Rise in Card Spending in August 2022
As per Stats.NZ, retail card spending increased $55 million (up 0.9%) in August 2022 versus July 2022, when adjusted for seasonal effects, driven by spending on consumables that grew by $18 million (up 0.7%), comprising items such as groceries (supermarkets) and liquor. Durables, which include items like furniture, hardware, and appliances, grew 51.2% ($508 million), and hospitality (restaurants and hotels) grew 78.2% ($505 million).
Exhibit 3: Trend in Seasonally Adjusted Retail Card Spending ($billion), January 2020–August 2022
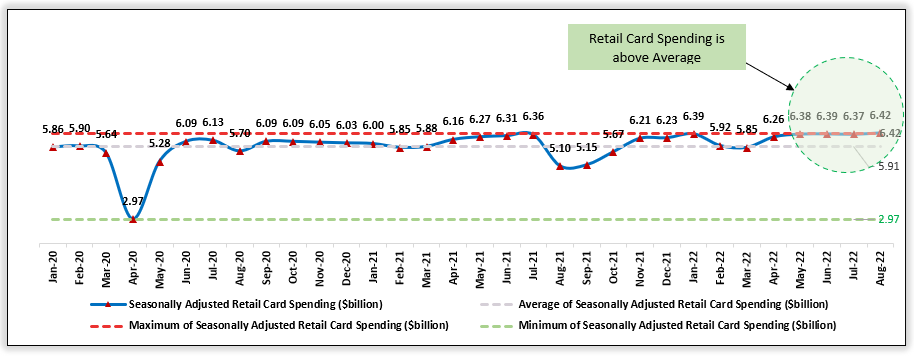
Data Source: This work is based on/includes Stats NZ’s data which are licensed by Stats NZ for reuse under the Creative Commons Attribution 4.0 International Licence; Chart Created by Kalkine Group
Index Performance:
The S&P/NZX All Consumer Staples Index generated a 3-month return of ~15.42% versus ~0.83% by the S&P/NZX All Index. Therefore, S&P/NZX All Consumer Staples Index overperformed S&P/NZX All Index by ~14.59% in 3-month.
Exhibit 4: S&P/NZX All Consumer Staples Index vs S&P/NZX All Index
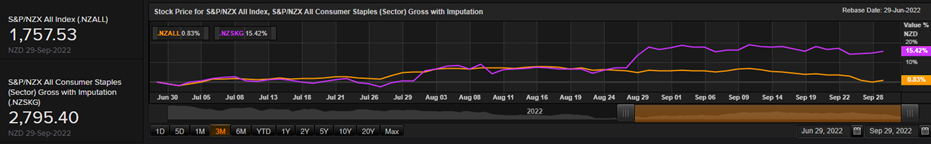
Source: REFINITIV
Key Risks and Challenges:
Farmers, growers, and fishers have been facing challenges due to climate change in the past years in producing and delivering food and fibre products to their customers. Further, disruptions in warehousing and logistics are increasing costs for the product, thereby impacting product margins without adding any value. Meanwhile, the major parts of food ecosystems are becoming more capital-intensive, vertically integrated and concentrated in fewer hands due to consolidation.
Exhibit 5. Key Risks in Consumer Staples Sector:
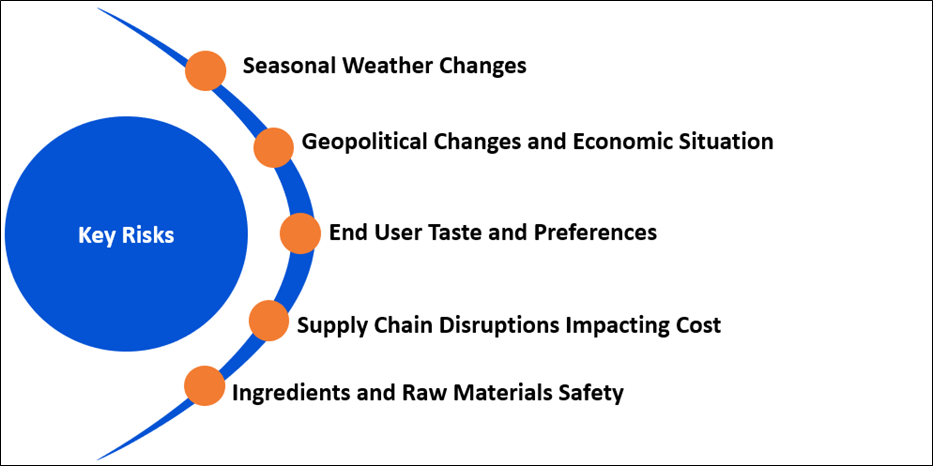
Source: Analysis by Kalkine Group
Outlook:
The rebound in international tourists from its low and the easing of Omicron restrictions resulted in a solid rebound in June quarter GDP. Further, the rise in card spending and housing sales in August 2022 indicates some demand resilience. Globally, activity indicators continue to show nervousness, but headline inflation is cooling from its peak as commodity prices retreat.
As per MPI, overall food and fibre export revenue for the year to 30 June 2022 is projected to reach $52.2 billion. All dairy product categories except infant formula are anticipated to outperform their 5-year average in terms of export earnings. Similarly, in the seafood sector, the government has set an Aquaculture Strategy of $3 billion in annual sales for the NZ aquaculture sector. The strategy is focused on increasing the value derived from existing farm space and supporting the development of new industries, including open ocean, land-based and seaweed aquaculture.
Apart from the sector-specific factors, an analysis on three NZX-listed companies is provided. This report covers their insights, outlook, performance and potential as expected to be delivered in the near to medium term.
1) Delegat Group Limited (Recommendation: Buy, Potential Upside: Low Double-Digit) (M-Cap: NZD1.05 billion, Annual Dividend Yield (TTM)1: 2.61%)
Business Description:
Delegat Group Limited (NZX: DGL) is a New Zealand-based wine company.
Outlook:
The company plans to grow sales by 21% to 4,080,000 cases over the next three years, mainly led by Oyster Bay sales in North America. Meanwhile, it plans to increase sales by 9% to 3,672,000 cases and Operating Net Profit after Tax to be in the ambit of $60-$64 million for FY23. Moreover, it will continue to monitor and manage the potential impact of ongoing supply chain challenges comprising port congestion and shipping line capacity constraints.
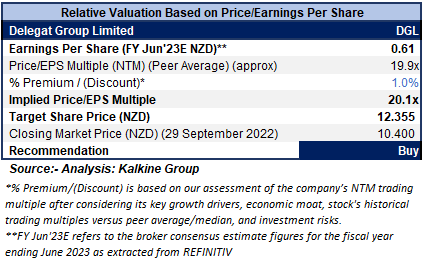
Valuation Methodology: Price/Earnings Per Share Based Relative Valuation (Illustrative)
Technical Overview:
Daily Price Chart
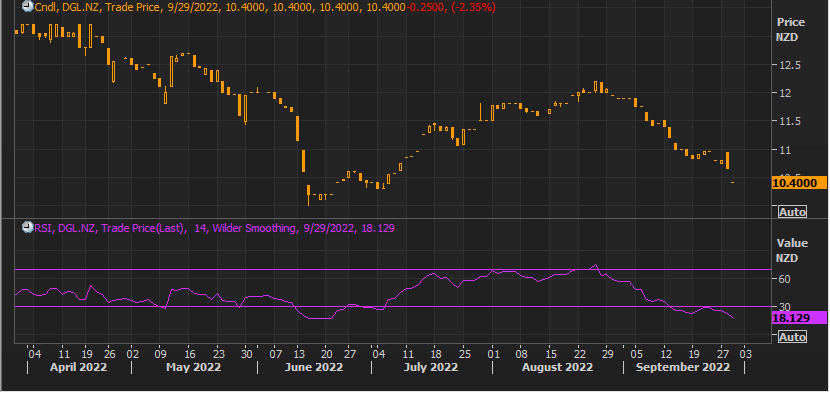
Source: REFINITIV, Note: Purple color line reflects Relative Strength Index (14-Period)
Stock Recommendation
The stock has been valued using P/E multiple-based illustrative relative valuation, and the target price so arrived reflects a rise of low double-digit (in % terms). A slight premium has been applied to P/E Multiple (NTM) (Peer Average), considering record global case sales in FY22 and the positive outlook for FY23.
Considering the facts above, a ‘Buy’ recommendation on the stock has been provided at the closing market price of NZD10.40 per share, down 0.48% as of 29 September 2022.
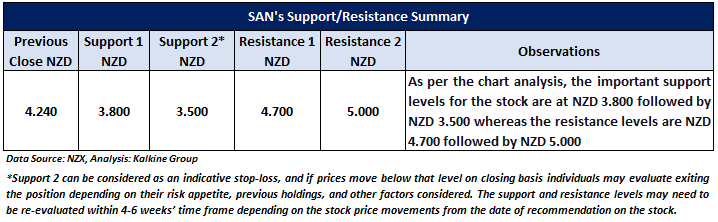
2) Sanford Limited (Recommendation: Speculative Buy, Potential Upside: Low Double-Digit) (M-Cap: NZD396.47 million)
Business Description:
Sanford Limited (NZX: SAN) is New Zealand's largest and oldest seafood company and the only fully integrated seafood business.
Outlook:
The overall outlook is positive demand improvements will drive that. Five-year capex (growth and maintenance) is estimated to be $300-$395 million, and the key focus area will be aquaculture growth in salmon and mussels. Also, it will focus on protecting the core wildcatch business via maintenance of the deepwater fleet and mussel diversification (powder and oil).
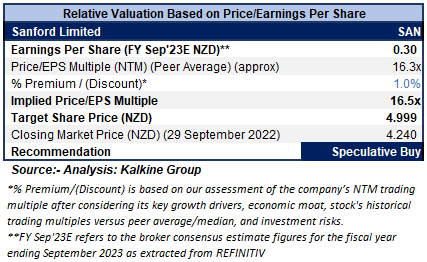
Valuation Methodology: Price/Earnings Per Share Based Relative Valuation (Illustrative)
Technical Overview:
Daily Price Chart
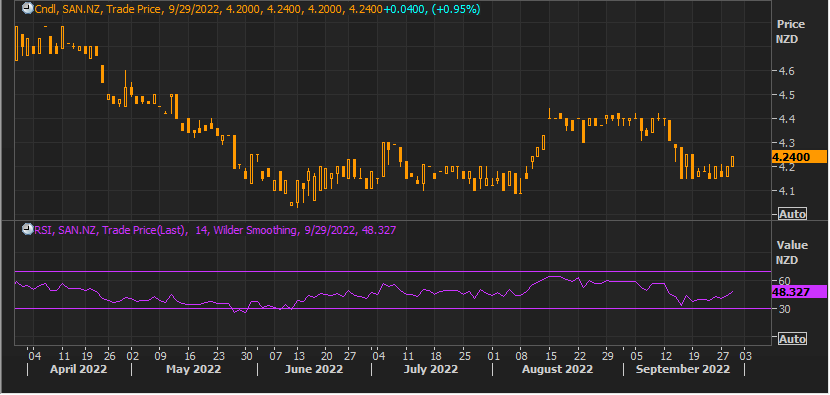
Source: REFINITIV, Note: Purple color line reflects Relative Strength Index (14-Period)
Stock Recommendation
The stock has been valued using P/E multiple-based illustrative relative valuation, and the target price so arrived reflects a rise of low double-digit (in % terms). A slight premium has been applied to P/E Multiple (NTM) (Peer Average), considering the positive outlook for FY22 and growth strategies.
Considering the facts above, a ‘Speculative Buy’ recommendation on the stock has been provided at the closing market price of NZD4.24 per share, up 0.95% as of 29 September 2022.
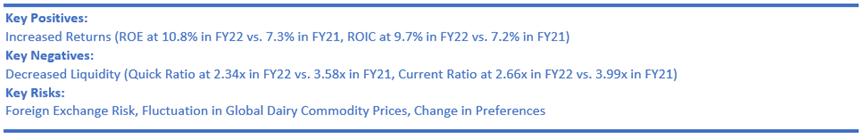
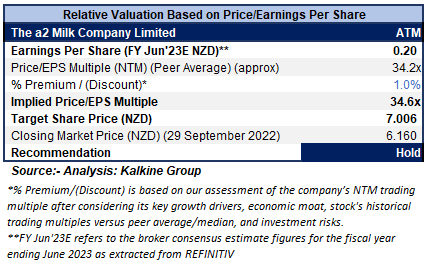
3) The a2 Milk Company Limited (Recommendation: Hold, Potential Upside: Low Double-Digit) (M-Cap: NZD4.58 billion)
Business Description:
The a2 Milk Company Limited (NZX: ATM) is engaged in the branded milk business, produced from cows having only the A2 protein type.
Outlook
China label IMF sales are estimated to grow in FY23 with higher growth in sales in 1H’FY23 versus 1H’FY22. English label IMF sales are estimated to increase in FY23, where 1H’FY23 sales are projected to be in line with 2H’FY22 due to the continuing impact of managing the transition. Further, Australian liquid milk sales are estimated to be in line with FY22, with reduced in-home consumption. USA liquid milk sales are estimated to grow in FY23, led by continued growth in core liquid milk and innovation. Overall, the company is projecting high single-digit revenue growth in FY23, and the gross margin percentage is projected to be in line with FY22.
Valuation Methodology: Price/Earnings Per Share Based Relative Valuation (Illustrative)
Technical Overview:
Daily Price Chart
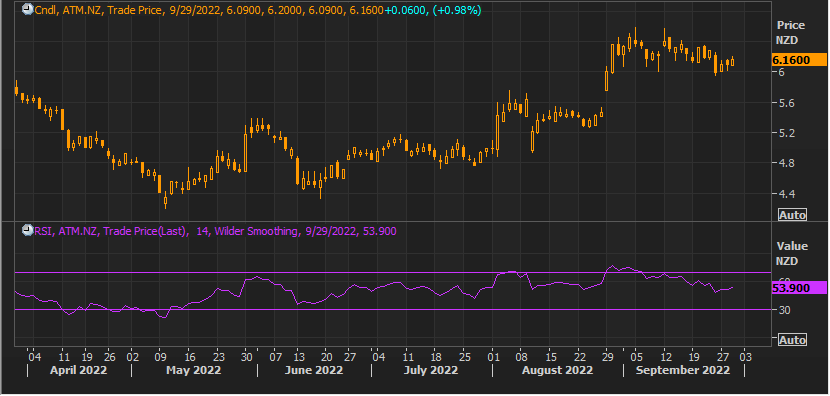
Source: REFINITIV, Note: Purple color line reflects Relative Strength Index (14-Period)
Stock Recommendation
The stock has been valued using P/E multiple-based illustrative relative valuation, and the target price reflects a rise of low double-digit (in % terms). A slight premium has been applied to P/E Multiple (NTM) (Peer Average), considering the positive outlook for FY23 and continued brand investment in FY23.
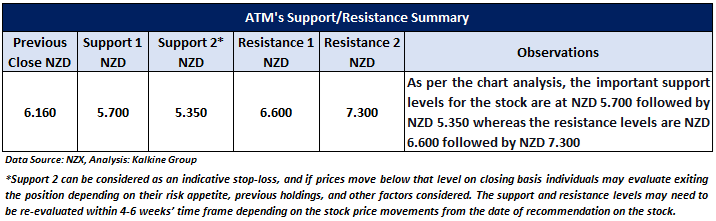
Considering the facts above, a ‘Hold’ recommendation on the stock has been provided at the closing market price of NZD6.16 per share, up 0.98% as of 29 September 2022.
Markets are trading in a highly volatile zone currently due to certain macro-economic issues and geopolitical tensions prevailing. Therefore, it is prudent to follow a cautious approach while investing.
Note 1: Past performance is not a reliable indicator of future performance.
Note 2: The reference date for all price data, currency, technical indicators, support, and resistance levels is September 29, 2022. The reference data in this report has been partly sourced from REFINITIV.
Note 3: Investment decisions should be made depending on an individual's appetite for upside potential, risks, holding duration, and any previous holdings. An 'Exit' from the stock can be considered if the Target Price mentioned as per the Valuation and or the technical levels provided has been achieved and is subject to the factors discussed above.
Note 4: Annual Dividend Yield is on a Trailing Twelve Month (TTM1) basis and are subject to change based on factors such as company performance, stock price changes, etc.
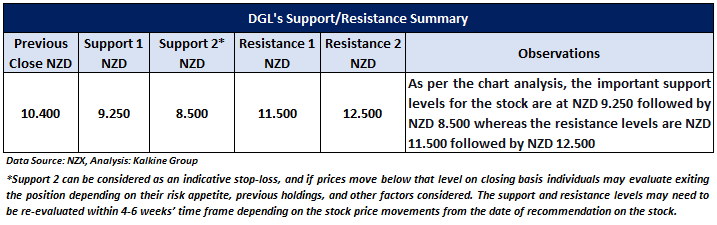
Technical Indicators Defined: -
Support: A level at which the stock prices tend to find support if they are falling, and a downtrend may take a pause backed by demand or buying interest. Support 1 refers to the nearby support level for the stock and if the price breaches the level, then Support 2 may act as the crucial support level for the stock.
Resistance: A level at which the stock prices tend to find resistance when they are rising, and an uptrend may take a pause due to profit booking or selling interest. Resistance 1 refers to the nearby resistance level for the stock and if the price surpasses the level, then Resistance 2 may act as the crucial resistance level for the stock.
Stop-loss: It is a level to protect further losses in case of unfavourable movement in the stock prices.
Disclaimer
Kalkine New Zealand Limited is a Financial Advice Provider (“FAP”) and is authorised by a Transitional FAP license issued by Financial Markets Authority (“FMA”) to provide financial advice. Kalkine provides only general financial advice through its research reports following a person becoming a member. The reports contain buy/sell/hold and other recommendations in relation to equity financial products. The recommendations and opinions [on this website] / [in this report] do not take into account any of your investment objectives, financial situation or needs. Before you make a decision about whether to acquire a financial product, you should obtain the Product Disclosure Statement from the product issuer. You should consider the appropriateness of advice taking into account your own objectives, financial situation and needs and seek independent financial advice before making any financial decisions. If you act on the advice in the research reports, you may have to pay fees, expenses or other amounts (but not to Kalkine). Further information about the complaints and dispute resolution process, as well as information about Kalkine’s duties are available on Kalkine’s website. Please read our Financial Advice Provider (FAP) disclosure statement and Complaints Handling Guide, which are available on the website.
Past performance is not a reliable indicator of future performance.
 Please wait processing your request...