
1. Sector Landscape and Outlook
As per the ‘Fortnightly Economic Update’ released by The Treasury, inflation continues to hold ~3.6% level, the highest since 1991, as annual food price inflation increased in October 2022, reaching a 14-year high of 10.1%, due to a rise in fruit and vegetable prices by 17.1%. Rental price inflation also remained high, increasing 4% YoY in October 2022. Hence the demand is softening, which is indicated by the international trade value and volume. However, the labour market continues to report persistent resilience from the US, euro area (EA) and Canada, showing strength in employment and household incomes.
Australia Leads Monthly Export while China Leads Import in October 2022
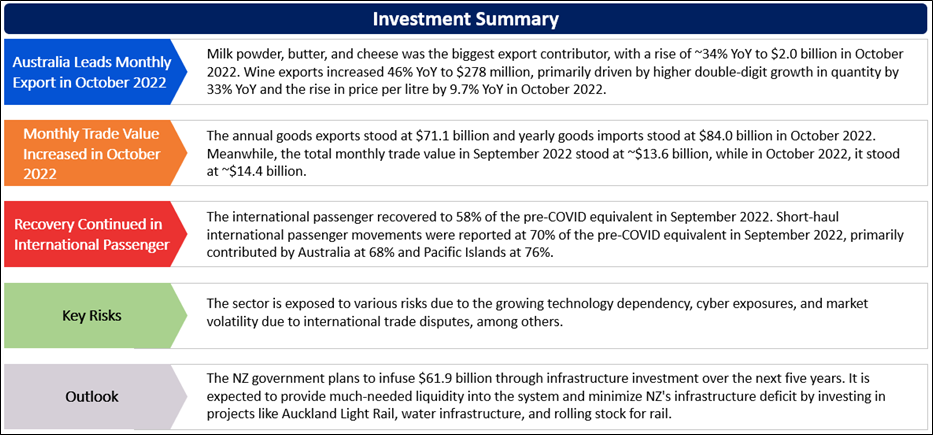
As per Stats.NZ, Milk powder, butter, and cheese was the biggest export contributor, with a rise of ~34% YoY to $2.0 billion in October 2022. Wine exports increased 46% YoY to $278 million, primarily driven by higher double-digit growth in quantity by 33% YoY and the rise in price per litre by 9.7% YoY in October 2022. The increase in wine value was driven by the USA, up $29 million (46% YoY) to $94 million, followed by Australia, up $22 million (59% YoY) to $59 million, and the EU, up $16 million (109%) to $32 million. However, Fruit exports decreased $69 million in value (down 30% YoY) to $160 million, primarily driven by the slowdown in demand for kiwifruit, which fell $68 million (36% YoY) to $122 million.
Exhibit 1: Top Export and Import Partners in October 2022 over October 2021
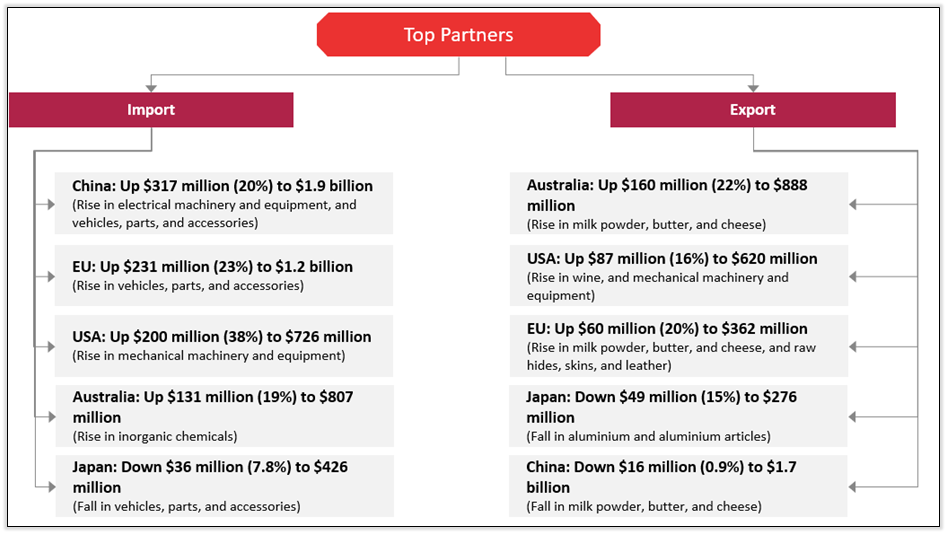
Data Source: This work is based on/includes Stats NZ’s data which are licensed by Stats NZ for reuse under the Creative Commons Attribution 4.0 International Licence; Chart Created by Kalkine Group
Monthly Trade Value Increased in October 2022
As per Stats.NZ, goods exports increased by 14% to $6.1 billion, while goods imports grew by 24% to $8.3 billion, resulting in a monthly trade deficit of $2.1 billion in October 2022 versus October 2021. Meanwhile, the annual trade deficit was $12.9 billion in October 2022 as annual goods exports stood at $71.1 billion, up $9.0 billion from the previous year, and yearly goods imports stood at $84.0 billion, up $17.0 billion from the prior year. Total monthly trade value in September 2022 stood at ~$13.6 billion, while in October 2022, it stood at ~$14.4 billion.
Exhibit 2 Trend in Goods Export and Import in October 2022
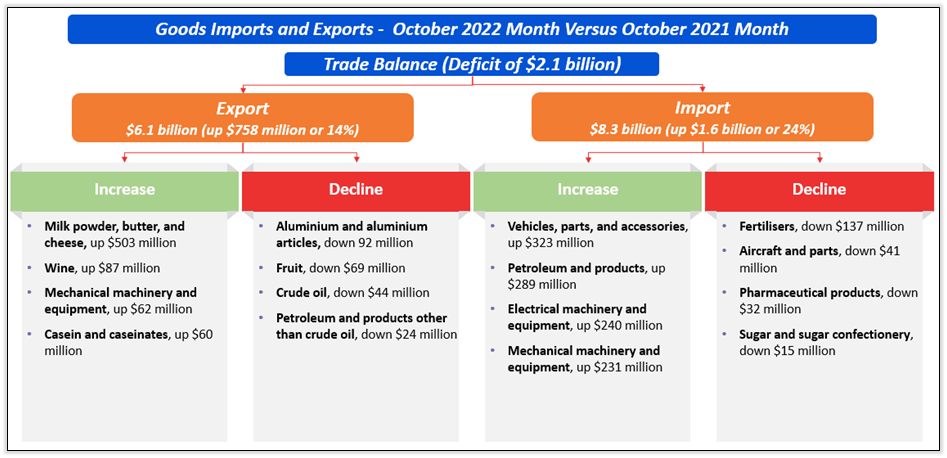
Data Source: This work is based on/includes Stats NZ’s data which are licensed by Stats NZ for reuse under the Creative Commons Attribution 4.0 International Licence; Chart Created by Kalkine Group
Recovery Continued in International Passenger
As per the announcement by Auckland International Airport Limited (NZX: AIA) on 17 November 2022, the international passenger recovered to 58% of the pre-COVID equivalent in September 2022. Short-haul international passenger movements were reported at 70% of the pre-COVID equivalent in September 2022, primarily contributed by Australia at 68% and Pacific Islands at 76%. Long-haul international passenger movements were reported at 41% of pre-COVID equivalent and an increase from the 36% recovery reported in September 2022. Domestic passenger movements in September 2022 were reported at 87% of the pre-COVID equivalent. Queenstown airport passenger numbers surpassed pre-COVID equivalent levels, with international passengers at 112% of pre-COVID and domestic passengers at 109% in September 2022.
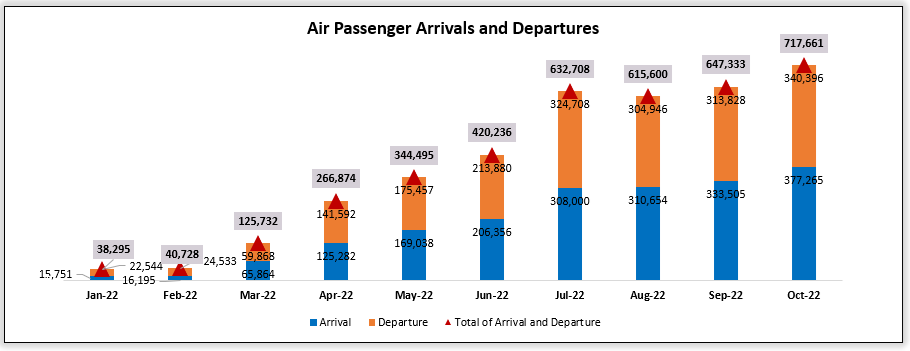
Data Source: This work is based on/includes Customs NZ data which are licensed by Customs NZ for reuse under the Creative Commons Attribution 4.0 International Licence; Chart Created by Kalkine Group
Index Performance:
The S&P/NZX All Industrials (Sector) Index generated a 2-year return of ~4.19% versus ~-9.81% by the S&P/NZX 50 Index. Therefore, NZX All Industrials Index overperformed NZX50 Index by ~14.0% in 2-year.
Exhibit 3: S&P/NZX All Industrials (Sector) vs S&P/NZX50 Index
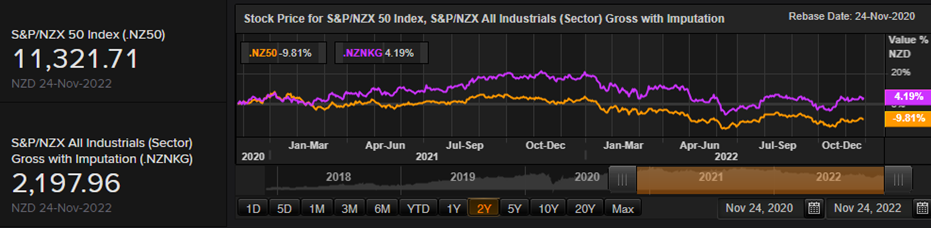
Source: REFINITIV
Key Risks and Challenges:
The soft demand outlook, building inflationary pressure, tight monetary policies by the government to bring down inflation to a comfortable level, the Russo-Ukrainian war causing supply chain disruption, volatile crude oil prices, and weak business confidence, among others, are critical challenges faced by the industrials sector. Recently, China indicated a fall in annual export growth for the first time since May 2020. The slowdown in demand was visible for exports to the US and Europe. This indicates subdued growth in the near term and that a material reopening boost is still some months away.
Exhibit 4. Key Risks in Industrials Sector:
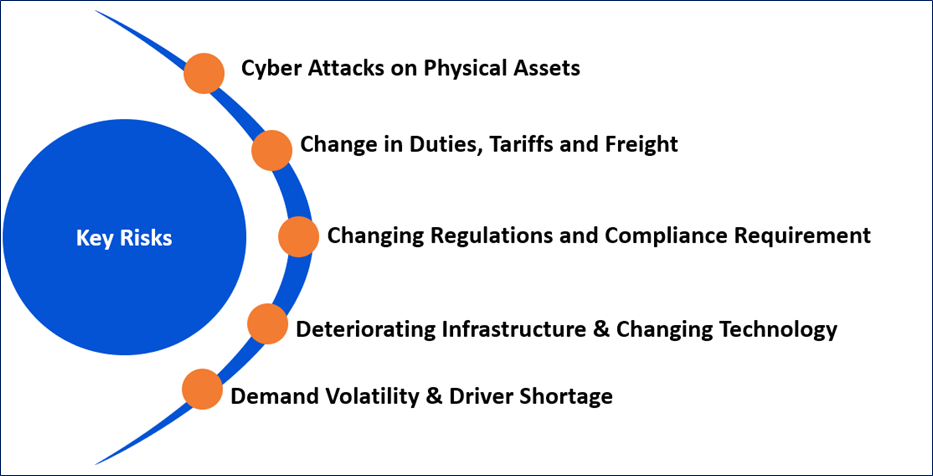
Source: Analysis by Kalkine Group
Outlook:
Recent data released by regulators in NZ indicate that the labour market remains tight, and wage growth has increased further, supporting household spending growth. Further, the unemployment rate stood at 3.3% in the September 2022 quarter as a 1.3% increase in employment was supported by a 0.8%-point rise in the participation rate to a record high of 71.7%. Globally, central banks are facing similar challenges as tight labour markets keep pressure on wages and inflation. Meanwhile, the NZ government plans to infuse $61.9 billion through infrastructure investment over the next five years. It is expected to provide much-needed liquidity into the system and minimize NZ's infrastructure deficit by investing in projects like Auckland Light Rail, water infrastructure, and rolling stock for rail.
Apart from the sector-specific factors, an analysis on three NZX-listed companies is provided. This report covers their insights, outlook, performance and potential as expected to be delivered in the near to medium term.
1) Napier Port Holdings Limited (Recommendation: Buy, Potential Upside: Low Double-Digit) (M-Cap: NZD396.47 million, Annual Dividend Yield: 3.80%1)
Business Description:
Napier Port Holdings Limited (NZX: NPH) is the premier freight gateway for the central and lower North Island of NZ.
Outlook:
Notably, the trade outlook for region’s food as well as fibre exports is positive, and as NPH is moving into the new financial year, cruise ships have returned to Hawke’s Bay after the 2-year COVID-19 induced hiatus. Notably, underlying result from operating activities for FY 2023 is expected between $42 Mn - $48 Mn. The company has also entered the new financial year in the robust position.
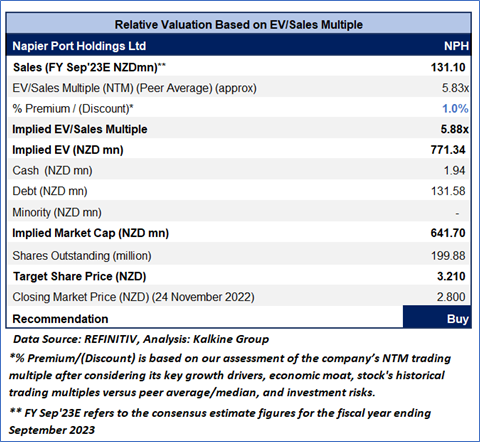
Valuation Methodology: EV/Sales Based Relative Valuation (Illustrative)
Technical Overview:
Daily Price Chart
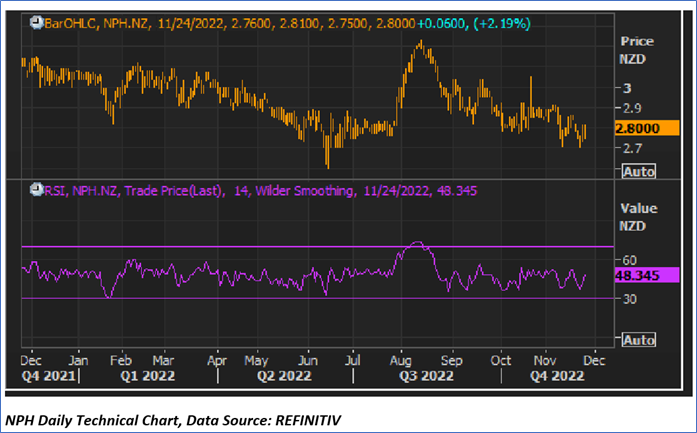
Note: Purple color line reflects Relative Strength Index (14-Period)
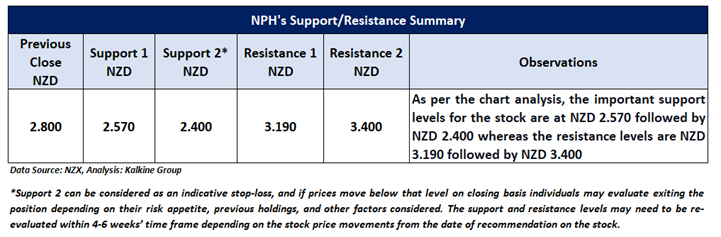
Stock Recommendation
The stock has been valued using EV/Sales multiple-based illustrative relative valuation, and the target price so arrived reflects a rise of low double-digit (in % terms). A slight premium has been applied to EV/Sales Multiple (NTM) (Peer Average), considering decent outlook as well as its robust position.
Considering the facts above, a ‘Buy’ recommendation on the stock has been provided at the closing market price of NZD2.80 per share, up by 2.19% as of 24 November 2022.
2) MOVE Logistics Group Limited (Recommendation: Speculative Buy, Potential Upside: Low Double-Digit) (M-Cap: NZD123.3 million)
Business Description:
MOVE Logistics Group Limited (NZX: MOV) is one of NZ's largest private domestic freight as well as logistics platforms, with the nationwide network of branches, depots and warehouses.
Outlook:
MOV has advised that, following an unexpected contract loss of ~$14 Mn revenue, full year results for the Freight division would be below the expectations. However, trading within Contract Logistics and International (including the MOVe Oceans initiative) is robust. Notably, the Atlas Wind is anticipated to arrive in NZ before calendar year-end as well as would deliver the robust profit from the maiden voyage. As per the release dated 20th October 2022, MOV’s near term focus is towards resetting as well as strengthening the core business. Over the medium to longer term, its focus would increasingly be towards growth and capitalising on numerous opportunities which have been identified.
Technical Overview:
Daily Price Chart
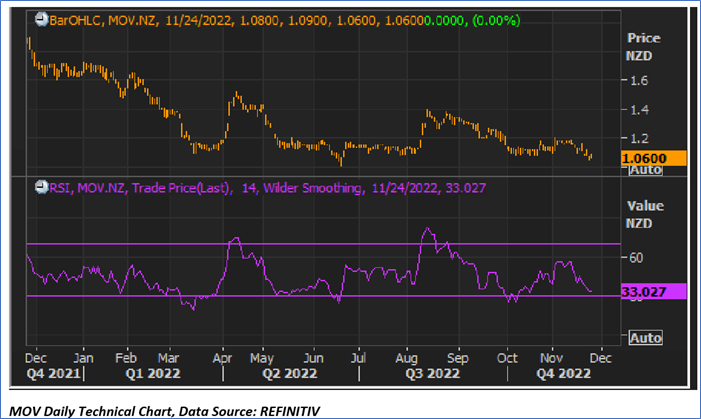
Note: Purple color line reflects Relative Strength Index (14-Period)
Technical Commentary
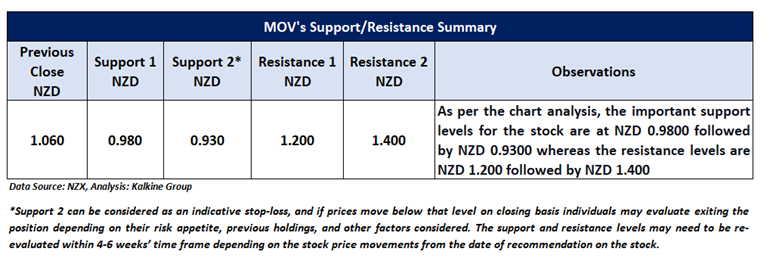
On the daily chart, MOV stock prices recently broke its horizontal support on the downside and are sustaining below the same from the past few trading sessions. However, the momentum oscillator RSI (14-period) is moving around the oversold zone and showing a reading of ~33.027 level, indicating the possibility of an upside rebound hereon. An important support level for the stock is placed at NZD0.930 while the key resistance level is placed at NZD1.400.
Stock Recommendation
The company has also stated that business transformation is continuing and increased benefits are expected from FY 2024 onwards. Also, significant deployments are being made towards the company’s digital transformation, which would drive operational leverage.
Considering the facts above, a ‘Speculative Buy’ recommendation on the stock has been provided at the closing market price of NZD1.060 per share as on November 24, 2022.
3) Metro Performance Glass Limited (Recommendation: Speculative Buy, Potential Upside: Low Double-Digit) (M-Cap: NZD33.9 million))
Business Description:
Metro Performance Glass Limited (NZX: MPG) produces the range of customised glass products which are predominantly utilised in residential as well as non-residential construction applications.
Outlook
MPG would be releasing its results for the 6 months ended 30 September 2022 on 29th November 2022. Notably, the board as well as management initiated the cost out programme in order to ensure that the business capacity and resources are appropriate to service demand as the cycle witnesses the change. The initiatives could achieve annualised savings, in the NZ business, between $8.0Mn - $9.0 Mn and benefits could accrue from H2 FY 2023. The company is expecting group EBIT for H1 FY 2023 to be ~$5.6 Mn.
Valuation Methodology: EV/Sales Based Relative Valuation (Illustrative)

Technical Overview:
Daily Price Chart
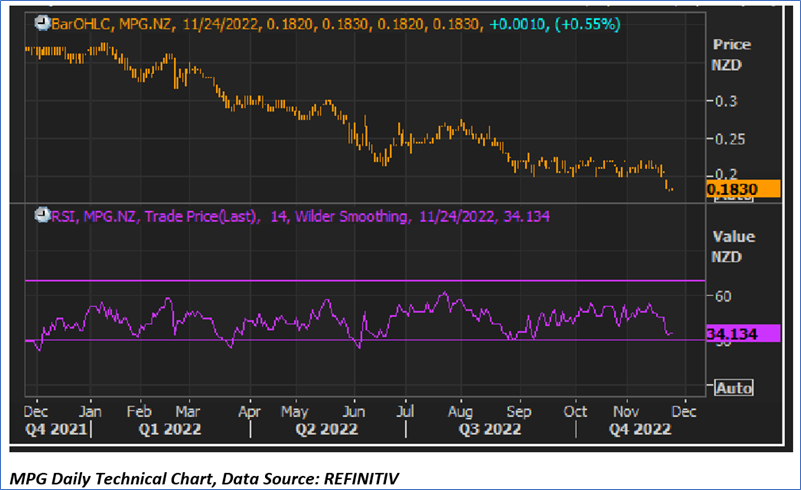
Note: Purple color line reflects Relative Strength Index (14-Period)
Stock Recommendation
The stock has been valued using EV/Sales multiple-based illustrative relative valuation, and the target price reflects a rise of low double-digit (in % terms). A slight premium has been applied to EV/Sales (NTM) (Peer Average), considering the decent long-term outlook.
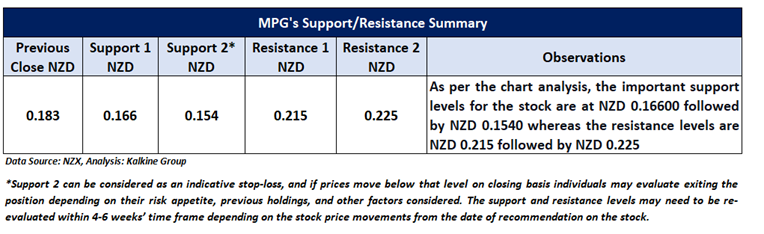
Considering the facts above, a ‘Speculative Buy’ recommendation on the stock has been provided at the closing market price of NZD0.183 per share, up 0.55% as of 24th November 2022.
Markets are trading in a highly volatile zone currently due to certain macro-economic issues and geopolitical tensions prevailing. Therefore, it is prudent to follow a cautious approach while investing.
Note 1: Past performance is not a reliable indicator of future performance.
Note 2: The reference date for all price data, currency, technical indicators, support, and resistance levels is November 24, 2022. The reference data in this report has been partly sourced from REFINITIV.
Note 3: Investment decisions should be made depending on an individual's appetite for upside potential, risks, holding duration, and any previous holdings. An 'Exit' from the stock can be considered if the Target Price mentioned as per the Valuation and or the technical levels provided has been achieved and is subject to the factors discussed above.
Note 4: Annual Dividend Yield is on a Trailing Twelve Month (TTM1) basis and are subject to change based on factors such as company performance, stock price changes, etc.
Technical Indicators Defined: -
Support: A level at which the stock prices tend to find support if they are falling, and a downtrend may take a pause backed by demand or buying interest. Support 1 refers to the nearby support level for the stock and if the price breaches the level, then Support 2 may act as the crucial support level for the stock.
Resistance: A level at which the stock prices tend to find resistance when they are rising, and an uptrend may take a pause due to profit booking or selling interest. Resistance 1 refers to the nearby resistance level for the stock and if the price surpasses the level, then Resistance 2 may act as the crucial resistance level for the stock.
Stop-loss: It is a level to protect further losses in case of unfavourable movement in the stock prices.
Disclaimer
Kalkine New Zealand Limited is a Financial Advice Provider (“FAP”) and is authorised by a Transitional FAP license issued by Financial Markets Authority (“FMA”) to provide financial advice. Kalkine provides only general financial advice through its research reports following a person becoming a member. The reports contain buy/sell/hold and other recommendations in relation to equity financial products. The recommendations and opinions [on this website] / [in this report] do not take into account any of your investment objectives, financial situation or needs. Before you make a decision about whether to acquire a financial product, you should obtain the Product Disclosure Statement from the product issuer. You should consider the appropriateness of advice taking into account your own objectives, financial situation and needs and seek independent financial advice before making any financial decisions. If you act on the advice in the research reports, you may have to pay fees, expenses or other amounts (but not to Kalkine). Further information about the complaints and dispute resolution process, as well as information about Kalkine’s duties are available on Kalkine’s website. Please read our Financial Advice Provider (FAP) disclosure statement and Complaints Handling Guide, which are available on the website.
Past performance is not a reliable indicator of future performance.
 Please wait processing your request...