
1. Sector Landscape and Outlook
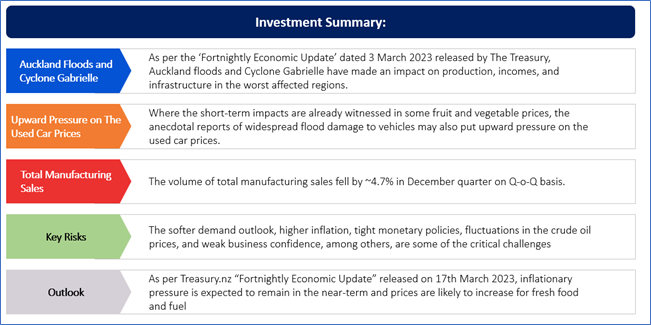
As per the ‘Fortnightly Economic Update’ dated 3 March 2023 released by The Treasury, Auckland floods and Cyclone Gabrielle have made an impact on production, incomes, and infrastructure in the worst affected regions. In the production category, the impacts are concentrated, the primary industries in the Hawkes Bay have been particularly impacted, especially the region’s apple growers, which account for ~70% of the nation’s NZD 900mn apple export industry. Besides, the extent of damage to land, buildings and infrastructure will take longer time to assess and will require expert opinion.
Where the short-term impacts are already witnessed in some fruit and vegetable prices, the anecdotal reports of widespread flood damage to vehicles may also put upward pressure on the used car prices. The quickness in the rebuilding in the economy and the availability of spare resources to meet the demand will dictate the implication of price pressures and monetary policy in the medium term.
Volume of Total Manufacturing Sales
As per Stats.NZ report “Business Financial Data”, published on 10 March 2023, the volume of total manufacturing sales fell by ~4.7% in December quarter on Q-o-Q basis. The volume of finished goods stocks for total manufacturing fell ~9.7% (NZD 1.1bn) in the December 2022 quarter compared with the December 2021 quarter.
The labour productivity rose ~3.1% in manufacturing industry, owing to a rise in output and a fall in labour inputs.
Exhibit 1: Transport equipment; machinery and equipment manufacturing (NZD mn of December Quarter)
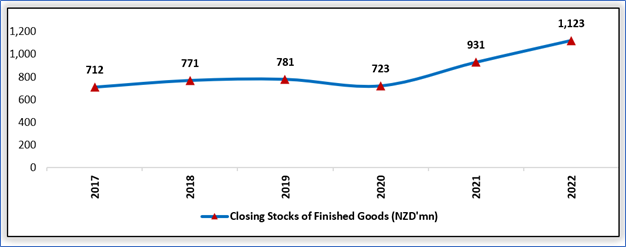
Data Source: This work is based on/includes Stats NZ’s data which are licensed by Stats NZ for reuse under the Creative Commons Attribution 4.0 International Licence; Chart Created by Kalkine Group
Terms of Trade
As per Treasury.NZ Fortnightly report, the goods terms of trade rose ~1.8% in the December quarter, driven by lower petrol prices which fell over ~22%, while the total import prices were down 2.1% in the quarter. Prices for other commodity imports eased ~2.5% but import prices for capital and consumption goods continued to rise firmly.
Exhibit: 2 Petroleum and coal product manufacturing (NZD mn of December Quarter)
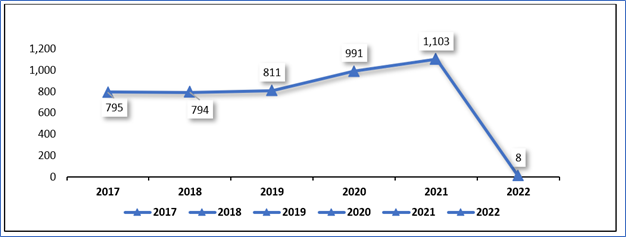
Data Source: This work is based on/includes Stats NZ’s data which are licensed by Stats NZ for reuse under the Creative Commons Attribution 4.0 International Licence; Chart Created by Kalkine Group
Index Performance:
The S&P/NZX All Industrials (Sector) Index generated a 3-month return of ~5.39% versus ~2.75% by the S&P/NZX All Index. Therefore, NZX All Industrials Index outperformed S&P/NZX All Index by ~2.64%.
Exhibit 3: S&P/NZX All Industrials (Sector) vs S&P/NZX50 Index
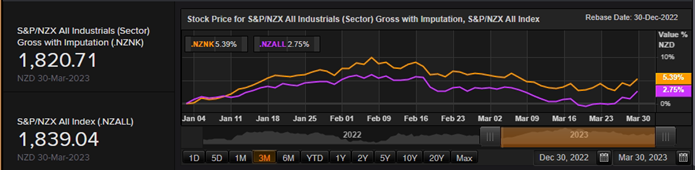
Source: REFINITIV
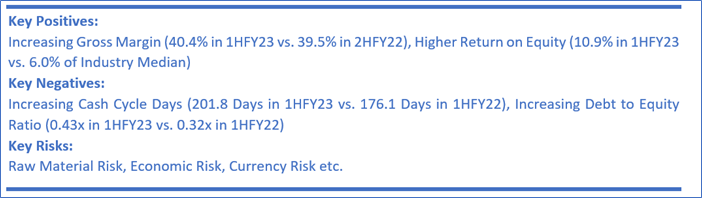
Key Risks and Challenges:
The softer demand outlook, higher inflation, tight monetary policies, fluctuations in the crude oil prices, and weak business confidence, among others, are some of the critical challenges faced by the industrials sector. As per the recent Fortnightly Economic Update dated 3 March 2023, the easing trend in price pressures witnessed over the H2 of 2022 seems to have stalled with the proportion of firms’ reporting rising costs, as well as intentions to increase prices, remaining around November’s levels.
The ANZ Business Outlook (ANZBO) reported an improvement in business confidence and activity in February, but sentiment remained weak.
Exhibit 4. Key Risks in Industrials Sector:
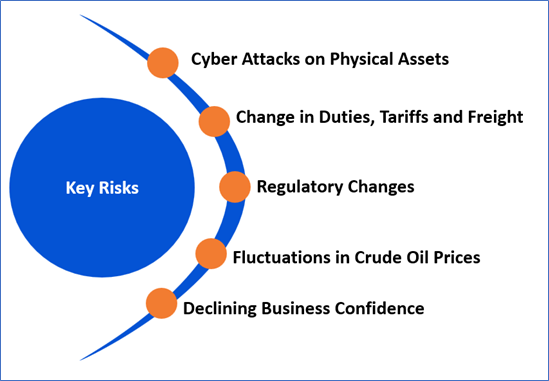
Source: Analysis by Kalkine Group
Outlook:
As per treasury.nz “Fortnightly Economic Update” released on 17th March 2023, inflationary pressure is expected to remain in the near-term and prices are likely to increase for fresh food and fuel, as freight is redirected through longer routes away from damaged road and rail.
There might be a slowdown including consumption decline, company credit defaults in the residential construction sector, banks being more risk averse and restricting lending to existing clients, continued labor market pressures and shortages in certain sectors, the high interest rate environment, that in turn lowers household incomes. The Reserve Bank’s suggested that an additional ~1% economic activity over the medium term appears to be reasonable to rebuild the lost in flood and cyclone.
Apart from the sector-specific factors, an analysis on 2 NZX-listed companies is provided. This report covers their insights, outlook, performance and potential as expected to be delivered in the near to medium term.
1) Move Logistics Group Limited (Recommendation: Speculative Buy, Potential Upside: Low Double-Digit) (M-Cap: NZD 111.73 million)
Business Description:
Move Logistics Group Limited (NZX: MOV) is NZ's largest end-to-end logistics experts, freight forwarders as well as warehousing providers.
Outlook:
Keeping in mind the expected moderation in customer activity due to wet weather implications, MOV is focused on strengthening the business foundation and investing into resources, capability, and technology. The company’s primary focus is on freight reset, gain from which will improve company’s financial returns. Another focus area remains on Oceans operations. Moreover, Contract Logistics and International are performing the expectations with good demand and margins.
Technical Overview:
Daily Price Chart
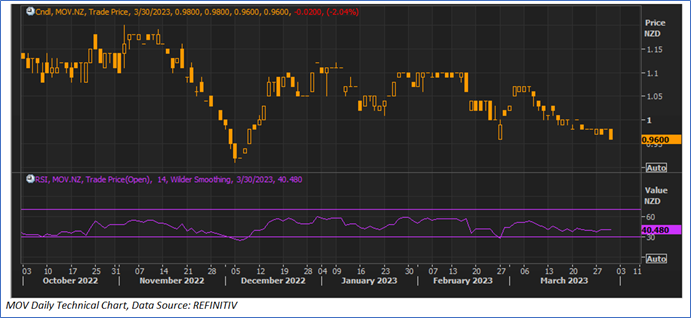
Technical Commentary
On the daily chart, MOV prices are trading above the horizontal trendline support zone. Moreover, the momentum oscillator RSI (14-period) is showing a reading of ~40.480 level. However, the prices are trading below the trend-following indicators 21-period SMA, which may act as a resistance zone.
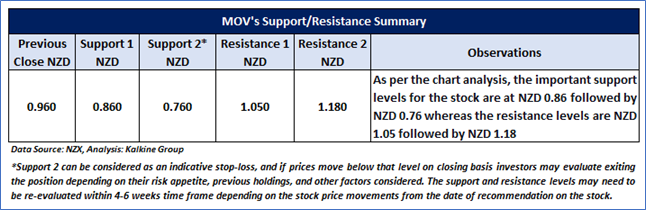
Stock Recommendation
Considering the aforementioned factors, a ‘Speculative Buy’ rating is given on the stock at the closing market price of NZD 0.960, down by ~2.04% as of 30th March 2023.
2) Skellerup Holdings Limited (Recommendation: Buy, Potential Upside: Low Double-Digit) (M-Cap: NZD 999.96 million, Annual Dividend Yield (TTM)1: 5.037%)
Business Description:
Skellerup Holdings Limited (NZX: SKL) is involved in the design, manufacture and distribution of precision engineered products. Its segments include Agriculture, Industrial and Corporate.
Outlook:
Heading to 2HFY23, SKL remains confident and continues to expect NPAT to be in the range of NZD 48-52 Mn for FY23. With a positive operating cash generation of NZD 20.2 Mn, SKL operates at very low debt. The company focusses on investing in new and existing people, equipment, technology and presence to strengthen market and sustainable growth.
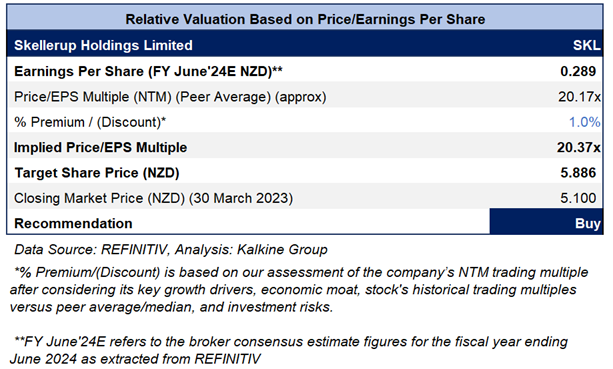
Fundamental Valuation: Price/EPS Based Valuation
Technical Overview:
Daily Price Chart
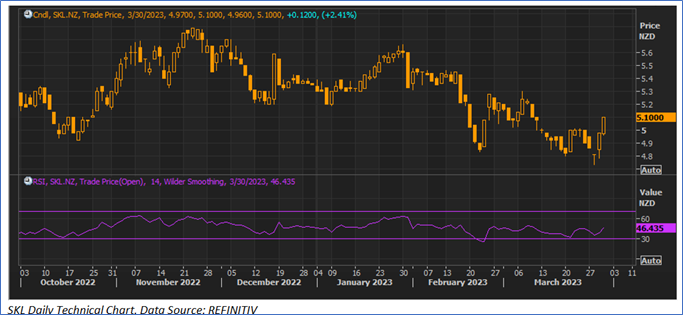
Technical Commentary
SKL's prices started to move upward after taking the support from a downward sloping trendline, indicating the possibility of a positive movement hereon. Moreover, the momentum oscillator RSI (14-period) surpassed the midpoint and is showing a reading of 46.435 The 21-period SMA is below the current market price (CMP), supporting a positive bias; however, the 50-period SMA, which is placed above the CMP, may act as a dynamic resistance for the stock.
Stock Recommendation
Considering the aforementioned factors, and undervaluation, a ‘Buy’ is given on the stock at the closing market price of NZD 5.100, up by 2.41% as of 30 March 2023.
Markets are trading in a highly volatile zone currently due to certain macro-economic issues and geopolitical tensions prevailing. Therefore, it is prudent to follow a cautious approach while investing.
Note 1: Past performance is neither an indicator nor a guarantee of future performance.
Note 2: The reference date for all price data, currency, technical indicators, support, and resistance levels is March 30, 2023. The reference data in this report has been partly sourced from REFINITIV.
Note 3: Investment decisions should be made depending on an individual's appetite for upside potential, risks, holding duration, and any previous holdings. An 'Exit' from the stock can be considered if the Target Price mentioned as per the Valuation and or the technical levels provided has been achieved and is subject to the factors discussed above.
Note 4: Annual Dividend Yield is on a Trailing Twelve Month (TTM1) basis and are subject to change based on factors such as company performance, stock price changes, etc.
Technical Indicators Defined: -
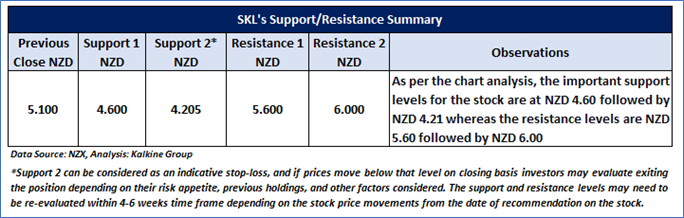
Support: A level at which the stock prices tend to find support if they are falling, and a downtrend may take a pause backed by demand or buying interest. Support 1 refers to the nearby support level for the stock and if the price breaches the level, then Support 2 may act as the crucial support level for the stock.
Resistance: A level at which the stock prices tend to find resistance when they are rising, and an uptrend may take a pause due to profit booking or selling interest. Resistance 1 refers to the nearby resistance level for the stock and if the price surpasses the level, then Resistance 2 may act as the crucial resistance level for the stock.
Stop-loss: It is a level to protect further losses in case of unfavourable movement in the stock prices.
Disclaimer
Kalkine New Zealand Limited is a Financial Advice Provider (“FAP”) and is authorised by a Class 1 Financial Advice Provider Licence issued by Financial Markets Authority (“FMA”) to provide financial advice. Kalkine provides only general financial advice through its research reports following a person becoming a member. The reports contain buy/sell/hold and other recommendations in relation to equity financial products. The recommendations and opinions [on this website] / [in this report] do not take into account any of your investment objectives, financial situation or needs. Before you make a decision about whether to acquire a financial product, you should obtain the Product Disclosure Statement from the product issuer. You should consider the appropriateness of advice taking into account your own objectives, financial situation and needs and seek independent financial advice before making any financial decisions. If you act on the advice in the research reports, you may have to pay fees, expenses or other amounts (but not to Kalkine). Further information about the complaints and dispute resolution process, as well as information about Kalkine’s duties are available on Kalkine’s website. Please read our Financial Advice Provider (FAP) disclosure statement and Complaints Handling Guide, which are available on the website.
Past performance is not a reliable indicator of future performance.
 Please wait processing your request...