
1.Sector Landscape and Outlook
As per Stats.NZ, the electronic card spending in the retail industries witnessed a fall of 2.5% (or $166 million) as compared to November 2022. The spending in the core retail industries encountered a fall of 2.3% (or $132 million). By the spending category, the durables were down $95 million (or 5.7%), apparel declined $17 million (or 4.7%). However, consumables rose by $39 million (or 1.5%). On the positive side, the spending in the hospitality industry witnessed a rise of 24% (or $261 million) between December 2021 and December 2022. In actual terms, cardholders were able to make 180 million transactions throughout all the industries in December 2022 and average value stood at $58 per transaction. Therefore, the total amount which was spent using electronic cards amounted to $10 billion.
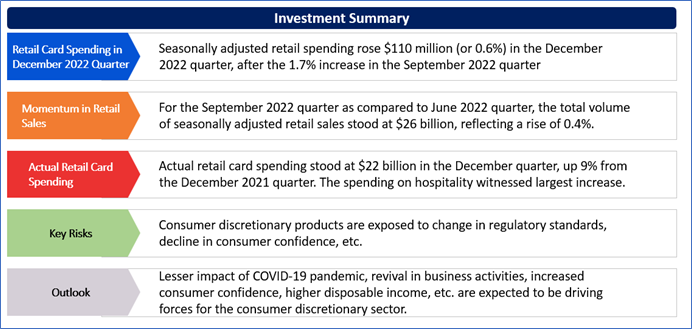
As per Stats.NZ, in the December 2022 quarter, spending in the retail industries witnessed a rise of $110 million (or 0.6%) as compared to September 2022 quarter. Also, spending in the core retail industries rose by $153 million (or 1.0%).
Retail Card Spending in December 2022
As per Stats.NZ, retail card spending witnessed a fall of $166 million (or 2.5%) in December 2022 as compared to November 2022, when adjusted for seasonal effects. Notably, decline in spending witnessed a fall in 5 of the 6 retail industries and the largest fall was witnessed in sales of durables – down $95 million (or 5.7%). Durables consists of items including furniture, hardware, and appliances.
However, the seasonally adjusted retail spending rose $110 million (or 0.6%) in the December 2022 quarter, after the 1.7% increase in the September 2022 quarter.
Exhibit 1: Trend in Seasonally Adjusted Retail Card Transactions by Industry
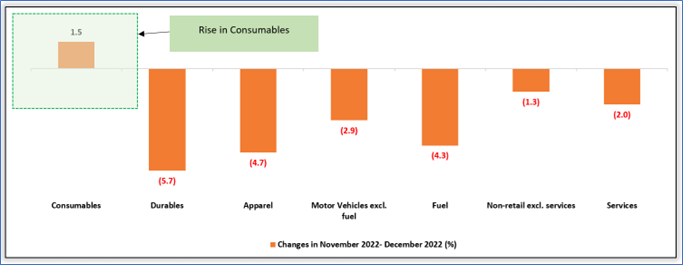
Data Source: This work is based on/includes Stats NZ’s data which are licensed by Stats NZ for reuse under the Creative Commons Attribution 4.0 International Licence; Chart Created by Kalkine Group
Continued Momentum in Retail Sales in September 2022 Quarter
The retail trade survey measures the sales as well as stock of businesses offering household and personal goods and services such as car yards, petrol stations, supermarkets, cafes and restaurants, and hotels.
As per Stats.NZ, for the September 2022 quarter as compared to June 2022 quarter, the total volume of seasonally adjusted retail sales amounted to $26 billion, reflecting a rise of 0.4% and total value of seasonally adjusted retail sales stood at $30 billion, up 2.5% (or $718 million). Notably, 15 of the 16 regions witnessed higher seasonally adjusted sales values. The total actual value of retail sales amounted to $29 billion, reflecting an increase of 15% (or $3.9 billion) as compared to the September 2021 quarter.
According to Stats.NZ, 11 of the 15 industries encountered higher seasonally adjusted sales values in the September 2022 quarter as compared to the June 2022 quarter. With price effects included, the largest industry movements were witnessed in department stores (an increase of 18%), electrical and electronic goods retailing ( a decline of 16%), supermarket and grocery stores ( a rise of 2.8%), fuel retailing (up 5.3%) and food and beverage services (up 3.1%).
Exhibit 2: Trend in Total Retail Trade Sales ($bn), Volumes, September 2017–September 2022 Quarters
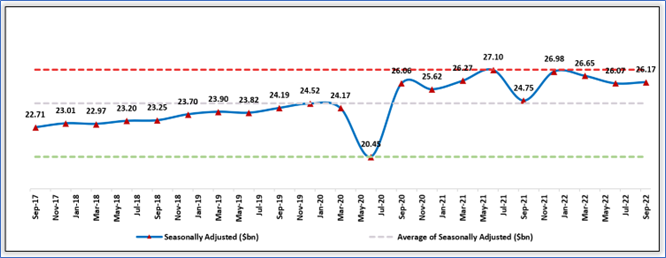
Data Source: This work is based on/includes Stats NZ’s data which are licensed by Stats NZ for reuse under the Creative Commons Attribution 4.0 International Licence; Chart Created by Kalkine Group
Key Risks and Challenges:
The consumer discretionary market is exposed to high competition from domestic as well as international tech- e-commerce companies, new brands and stores. This could create significant pressure on margins. Notably, the broader consumer discretionary sector is exposed to supply chain costs, labour shortages and higher hourly rates as well as the general economic cost pressures. Apart from these challenges, COVID-19 pandemic has had a major impact on several businesses operating in New Zealand in the same industry. Also, such challenges might arise in the future which could impact the margins of the companies and demand of the products. Short-term effects on prices, choice and availability of discretionary items, etc. are some of the risks.
Exhibit 3. Key Risks in Consumer Discretionary Sector:
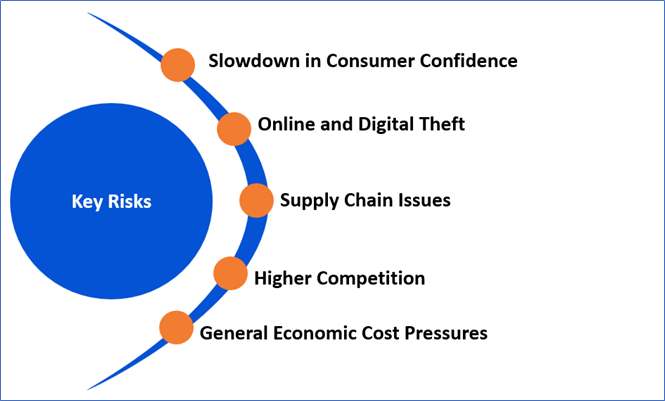
Source: Analysis by Kalkine Group
Outlook:
The development of new stores in the retail grocery sector needs capital expenditure (such as land costs, building costs, store fit-out) from the prospective new entrant or expanding firm. For entry as well as expansion to be viable, requirement of customer base of sufficient size is needed to enable new stores to earn enough return in order to justify investment.
Therefore, population density is expected to be relevant to entry and expansion. This is because it affects the size of customer bases that stores would have access to in their catchment area. Notably, areas having high population density is expected to be more likely to offer the prospective store access to the suitably sized customer base. Moving forward, lesser impact of COVID-19 pandemic, revival in business activities, increased consumer confidence, higher disposable income, etc. are expected to be driving forces for the consumer discretionary sector. Notably, the factors which motivate as well as influence consumers to choose where they purchase their discretionary items are known as the drivers of store choice. Some of the important drivers of store choice are price, location and ease of access, product range and quality, as well as consumer perceptions of, and familiarity with grocery stores.
Apart from the sector-specific factors, an analysis on 2 NZX-listed companies is provided. This report covers their insights, outlook, performance and potential as expected to be delivered in the near to medium term.
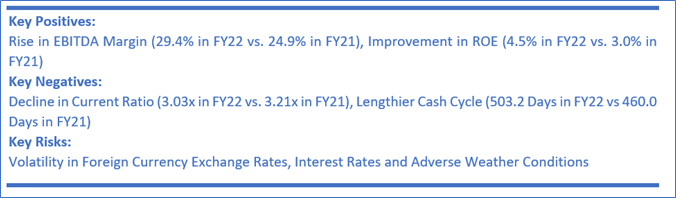
1) Burger Fuel Group Limited (Recommendation: Speculative Buy, Potential Upside: Low Double-Digit) (M-Cap: NZD13.8 million)
Business Description:
Burger Fuel Group Limited (NZX: BFG) is involved in the restaurants business and operates 3 brands: Shake Out, BurgerFuel and Winner Winner
Outlook:
The group expects the impact of increasing supply chain costs, labour shortages and rising hourly rates, and general economic cost pressures to persist going forward. Further, the Group will continue to invest significantly in its new brands - Winner Winner & Shake Out New Zealand going forward. BFG continues to hold healthy cash reserves (cash reserves of NZD7.4 million as on 30 September 2022) and would pursue further opportunities for the development of current brands and growth prospects.
Technical Overview:
Daily Price Chart
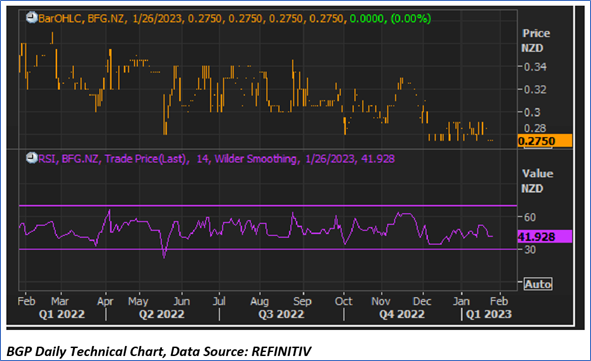
Source: REFINITIV, Note: Purple color line reflects Relative Strength Index (14-Period)
Technical Commentary:
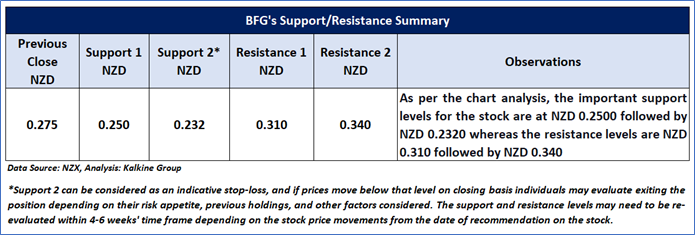
BFG prices are moving around its crucial support zone and stock prices seem to rebound after forming a base near the immediate support levels. Moreover, momentum indicator RSI (14-period) is placed below the mid-point and shows a reading of ~41.928. An important support level for the stock is placed at NZ$ 0.250 while the key resistance level is placed at NZ$ 0.310.
Stock Recommendation
On a TTM basis, the stock of BFG is trading at an EV/Sales multiple of 1.6x compared to the industry (Hotels & Entertainment Services) median of 2.2x, and thus seems undervalued.
Besides, the group opened the 60th NZ BurgerFuel store in Rolleston, Christchurch, on 31 October 2022, and it targets to open another store in Dunedin before the end of FY23.
Considering the facts above and undervaluation as indicated by the TTM valuation, a ‘Speculative Buy’ recommendation on the stock has been provided at the closing market price of NZD0.275 per share as of 26 January 2023.
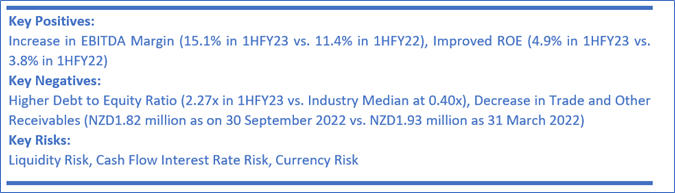
2) Foley Wines Limited (Recommendation: Speculative Buy, Potential Upside: Low Double-Digit) (M-Cap: NZD89.4 million, Annual Dividend Yield (TTM)1: 4.09%)
Business Description:
Foley Wines Limited (NZX: FWL) is in the wineries business and holds iconic wineries and brands from New Zealand’s most acclaimed wine regions.
Outlook:
FWL is better positioned to further build on the platform set driven by its decent inventory levels and excellent global relationships for its portfolio. Further, the company continues to invest in vineyard productivity. The Grove Mill winery would be expanded by the further 1,000 tonnes of processing capacity in time for the 2023 vintage.
Technical Overview:
Daily Price Chart
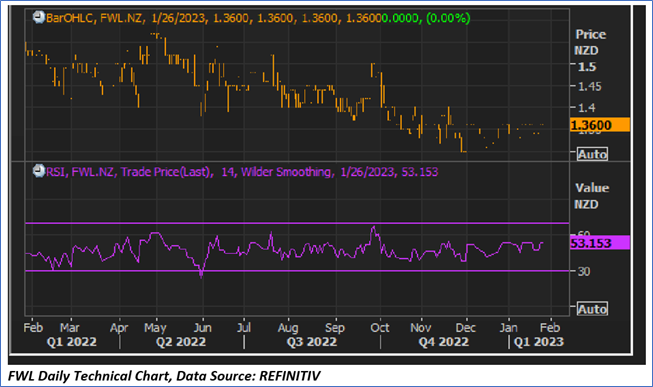
Technical Commentary
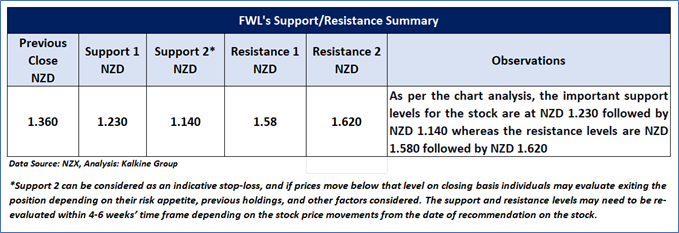
FWL’s prices are in a consolidation phase on the chart and taking support at the lower band of the falling wedge pattern, indicating the possibility of an upside. Moreover RSI-14 period is inching higher with a reading of ~53.153, suggesting momentum build-up in the stock. An important support level for the stock is placed at NZ$1.23 while the key resistance level is placed at NZ$1.58.
Stock Recommendation
On a TTM basis, the stock of FWL is trading at an EV/EBITDA multiple of 9.1x compared to the industry (Beverages) median of 11.4x, and thus seems undervalued.
Besides, the company is optimistic about its premiumisation strategy, which continues to deliver results in uncertain times. Additionally, the company is eyeing new opportunities both in New Zealand and globally.
Considering the aforementioned factors, and undervaluation as indicated by the TTM valuation, a ‘Speculative Buy’ is given on the stock at the closing market price of NZD1.36 as of 26 January 2023.
Markets are trading in a highly volatile zone currently due to certain macro-economic issues and geopolitical tensions prevailing. Therefore, it is prudent to follow a cautious approach while investing.
Note 1: Past performance is neither an indicator nor a guarantee of future performance.
Note 2: The reference date for all price data, currency, technical indicators, support, and resistance levels is January 26, 2023. The reference data in this report has been partly sourced from REFINITIV.
Note 3: Investment decisions should be made depending on an individual's appetite for upside potential, risks, holding duration, and any previous holdings. An 'Exit' from the stock can be considered if the Target Price mentioned as per the Valuation and or the technical levels provided has been achieved and is subject to the factors discussed above.
Note 4: Annual Dividend Yield is on a Trailing Twelve Month (TTM1) basis and are subject to change based on factors such as company performance, stock price changes, etc.
Technical Indicators Defined: -
Support: A level at which the stock prices tend to find support if they are falling, and a downtrend may take a pause backed by demand or buying interest. Support 1 refers to the nearby support level for the stock and if the price breaches the level, then Support 2 may act as the crucial support level for the stock.
Resistance: A level at which the stock prices tend to find resistance when they are rising, and an uptrend may take a pause due to profit booking or selling interest. Resistance 1 refers to the nearby resistance level for the stock and if the price surpasses the level, then Resistance 2 may act as the crucial resistance level for the stock.
Stop-loss: It is a level to protect further losses in case of unfavourable movement in the stock prices.
Disclaimer
Kalkine New Zealand Limited is a Financial Advice Provider (“FAP”) and is authorised by a Transitional FAP license issued by Financial Markets Authority (“FMA”) to provide financial advice. Kalkine provides only general financial advice through its research reports following a person becoming a member. The reports contain buy/sell/hold and other recommendations in relation to equity financial products. The recommendations and opinions [on this website] / [in this report] do not take into account any of your investment objectives, financial situation or needs. Before you make a decision about whether to acquire a financial product, you should obtain the Product Disclosure Statement from the product issuer. You should consider the appropriateness of advice taking into account your own objectives, financial situation and needs and seek independent financial advice before making any financial decisions. If you act on the advice in the research reports, you may have to pay fees, expenses or other amounts (but not to Kalkine). Further information about the complaints and dispute resolution process, as well as information about Kalkine’s duties are available on Kalkine’s website. Please read our Financial Advice Provider (FAP) disclosure statement and Complaints Handling Guide, which are available on the website.
Past performance is not a reliable indicator of future performance.
 Please wait processing your request...