
1. Sector Landscape and Outlook
As per Stats.NZ, the electronic card spending in the retail industries increased by 1.4% (up $88 million), and spending in the core retail industries increased by 2.2% (up $122 million) for the September 2022 month versus August 2022 month. The total value of electronic card spending, comprising the two non-retail categories (services and other non-retail), grew by $218 million (up 2.5%) in September 2022 month. Spending in the hospitality industry grew by $626 million between September 2021 and September 2022. Meanwhile, the cardholders completed 158 million transactions across all industries in September 2022 month, with an average value of $54 per transaction. The cumulative amount spent using electronic cards was $8.6 billion.
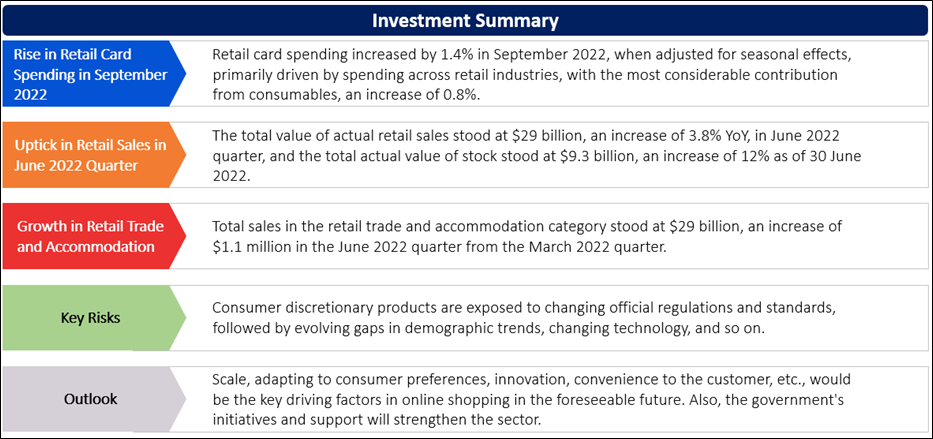
Rise in Retail Card Spending in September 2022
As per Stats.NZ, retail card spending increased by 1.4% in September 2022, when adjusted for seasonal effects, primarily driven by spending across retail industries, with the largest contribution from consumables, an increase of 0.8%. In actual terms, total card spending reached $8.6 billion, an increase of 32.9% from September 2021. September 2022 is the third consecutive monthly rise for consumables. Meanwhile, seasonally adjusted total billings in NZ stood at $4.4 billion in August 2022, up 5.1% from July 2022, indicating the highest seasonally adjusted value. Seasonally adjusted domestic billings on NZ issued cards stood at $3.9 billion in August 2022, a rise of 1.7% from July 2022.
Exhibit 1: Trend in Seasonally Adjusted Retail Card Transaction Values by Industry
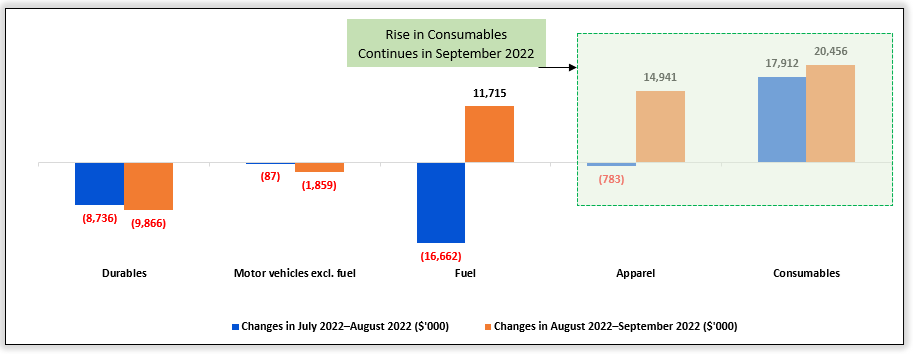
Data Source: This work is based on/includes Stats NZ’s data which are licensed by Stats NZ for reuse under the Creative Commons Attribution 4.0 International Licence; Chart Created by Kalkine Group
Continued Momentum in Retail Sales in June 2022 Quarter
As per Stats.NZ, the total value of actual retail sales stood at $29 billion, an increase of 3.8% YoY, in June 2022 quarter, and the total actual value of stock stood at $9.3 billion, an increase of 12% as of 30 June 2022. However, the total volume of seasonally adjusted retail sales stood at $26 billion, down 2.3% YoY. In comparison, the total value of seasonally adjusted retail sales stood at $29 billion, relatively unchanged in June 2022 quarter. Eight of the sixteen regions reported higher seasonally adjusted sales values. The top four industries in the June 2022 quarter were Food and beverage services, Accommodation, Department stores, clothing, footwear, and personal accessories.
Exhibit 2: Trend in Total Retail Trade Sales ($bn), Volumes, June 2017–June 2022 Quarters
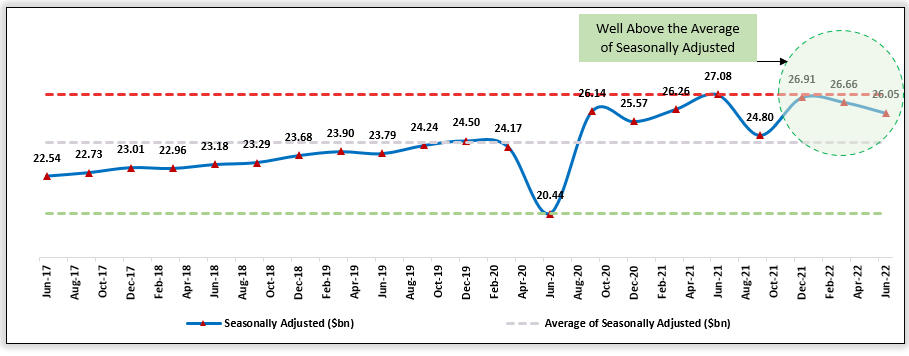
Data Source: This work is based on/includes Stats NZ’s data which are licensed by Stats NZ for reuse under the Creative Commons Attribution 4.0 International Licence; Chart Created by Kalkine Group
Rise in Retail Trade and Accommodation
As per Stats.NZ, total sales in the retail trade and accommodation category stood at $29 billion, an increase of $1.1 million in the June 2022 quarter from the March 2022 quarter. Actual purchases increased $1.2 billion (up 5.4%), and salaries and wages increased $182 million (up 5.0%) in the June 2022 quarter versus the June 2021 quarter.
Index Performance:
The S&P/NZX All Consumer Discretionary Index generated a 2-year return of ~-5.08% versus ~-13.14% by the S&P/NZX 50 Index. Therefore, S&P/NZX All Consumer Discretionary Index overperformed S&P/NZX 50 Index by ~8.06% in 2-year.
Exhibit 3: S&P/NZX All Consumer Discretionary Index vs S&P/NZX 50 Index
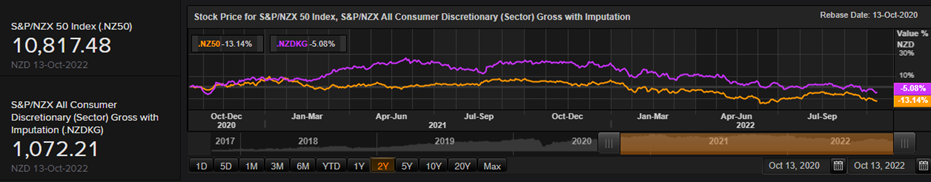
Source: REFINITIV
Key Risks and Challenges:
The retail and consumer market are exposed to high competition from domestic and international tech- e-commerce companies, new brands and stores, creating pressure on margins and increasing high demand for working capital requirements to manage the inventory level as per the need and season. Small start-ups compete with well-established players in modern technology and highly skilled talent backed by government support, including tax incentives and progressive attitudes. Meanwhile, consumer price inflation has grown above the desired level due to higher energy prices amid geopolitical tensions, supply chain disruptions and a tight workforce.
Exhibit 4. Key Risks in Retail & Consumer Sector:
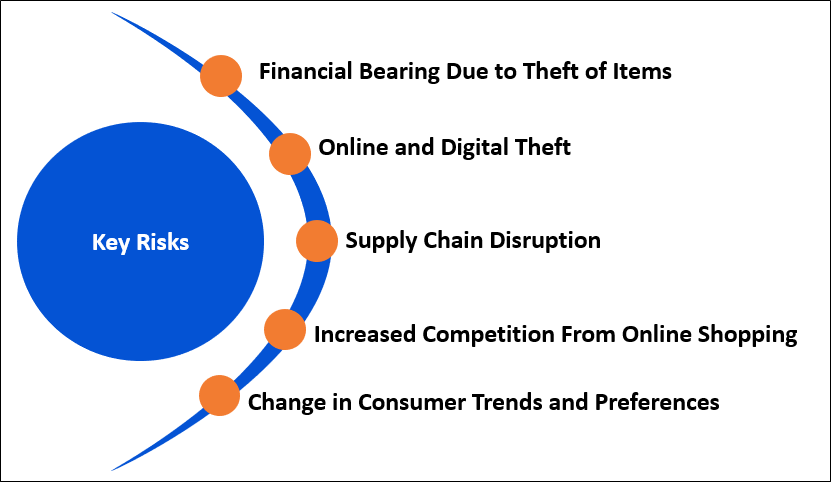
Source: Analysis by Kalkine Group
Outlook:
Multiline retail and speciality retail companies are focusing on online shopping due to increasing competition at the store, higher rental costs, rise in working capital and the convenience of shopping online. Though the percentage contribution from online sales is small, the pace of growth in online sales is faster than in-store sales. Consumer shopping behaviour could progress to such an extent in the foreseeable future that most well-established players will benefit more from online shopping than the physical presence of stores in malls and independent outlets. Aggressive innovation in tech-driven services at a competitive cost, less dependency on a qualified workforce and new product launches (SKUs) would determine the market leaders, who would then set the tone and market dynamics. Changes in the seasonally adjusted value of retail electronic card transactions for spending in the retail industries grew by $312 million (up 1.7%), and spending in the core retail industries grew by $402 million (up 2.6%) in the September 2022 quarter versus June 2022 quarter.
Apart from the sector-specific factors, an analysis on three NZX-listed companies is provided. This report covers their insights, outlook, performance and potential as expected to be delivered in the near to medium term.
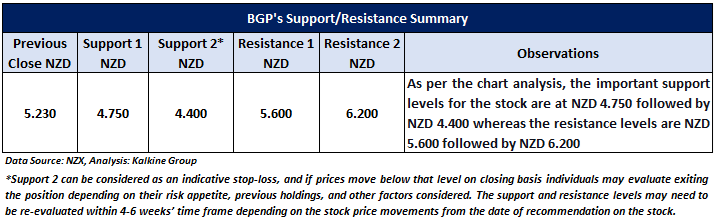
1) Briscoe Group Limited (Recommendation: Buy, Potential Upside: Low Double-Digit) (M-Cap: NZD1.16 billion, Annual Dividend Yield (TTM)1: 7.14%)
Business Description:
Briscoe Group Limited (NZX: BGP) acts as the holding company for its retail stores that operate within two retail sectors, namely, homeware and sporting goods, under different brand names viz; Briscoes Homeware, Living & Giving, and Rebel Sport.
Outlook:
The company estimates significant opportunity during 2H’FY23 for the Group, particularly in 3Q’FY23, which last year was impacted by enforced shutdowns from mid-August to early November 2021. Driven by the foundation in 1H’FY23 and the expectation of better 3Q’FY23 performance, the company anticipates finishing FY23 ahead of the $87.91 million NPAT reported last year.
Valuation Methodology: Price/Earnings Per Share Based Relative Valuation (Illustrative)
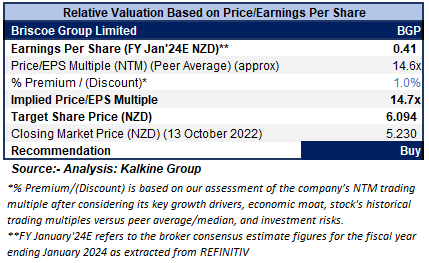
Technical Overview:
Daily Price Chart
Source: REFINITIV, Note: Purple color line reflects Relative Strength Index (14-Period)
Stock Recommendation
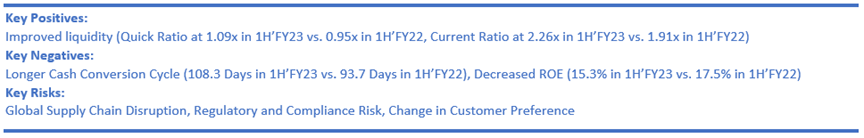
The stock has been valued using P/E multiple-based illustrative relative valuation, and the target price so arrived reflects a rise of low double-digit (in % terms). A slight premium has been applied to P/E Multiple (NTM) (Peer Average), considering the momentum seen in 1H’FY23 and the positive outlook for FY23.
Considering the facts above, a ‘Buy’ recommendation on the stock has been provided at the closing market price of NZD5.23 per share, down 2.24% as of 13 October 2022.
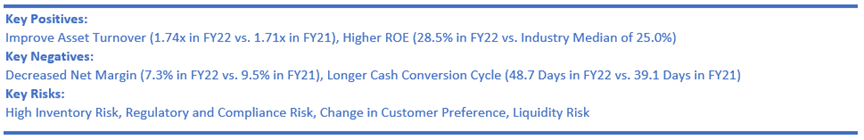
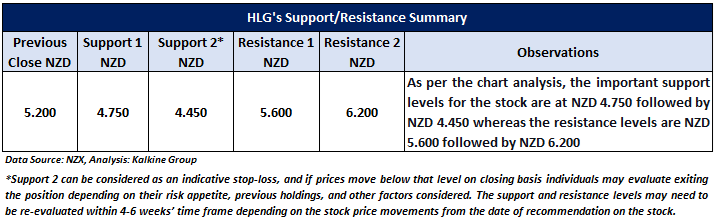
2) Hallenstein Glasson Holdings Limited (Recommendation: Buy, Potential Upside: Low Double-Digit) (M-Cap: NZD310.18 million, Annual Dividend Yield (TTM)1: 8.67%)
Business Description:
Hallenstein Glasson Holdings Limited (NZX: HLG) is a retailer of menswear and womenswear, operating business segments including Hallenstein Bros Limited, Glassons Limited, and Hallenstein Properties Limited.
Outlook:
The optimistic tone is set for forthcoming progress driven by improved sales in the first eight weeks of FY23, up by 68.49% YoY. The company is looking forward to its critical strategies of quality on-trend products, speed to market, customer service and investment in digital to drive growth. However, some operating costs pressure is building due to inflationary pressure. Moreover, the company is now focusing on performance for the critical peak trading months ahead.
Technical Overview:
Daily Price Chart
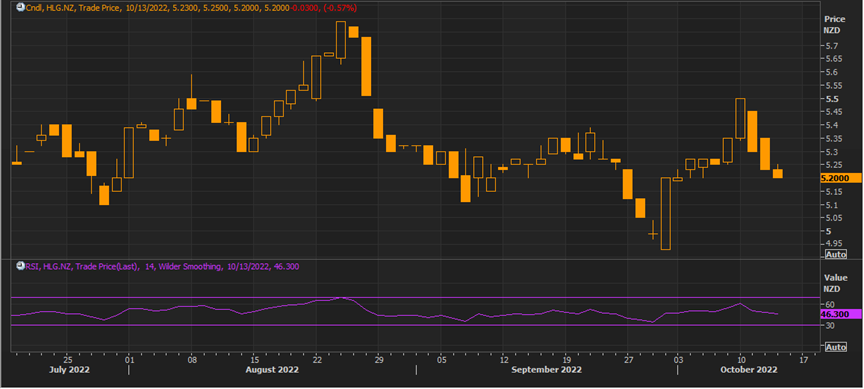
Source: REFINITIV, Note: Purple color line reflects Relative Strength Index (14-Period)
Stock Recommendation
Considering the facts above, a ‘Buy’ recommendation on the stock has been provided at the closing market price of NZD5.20 per share, down 0.57% as of 13 October 2022.
3) Turners Automotive Group Limited (Recommendation: Buy, Potential Upside: Low Double-Digit) (M-Cap: NZD310.39 million, Annual Dividend Yield (TTM)1: 8.92%)
Business Description:
Turners Automotive Group Limited (NZX: TRA) is an integrated automotive financial services company, mainly focused on the automotive sector in the three key areas: Automotive Retail, Finance, and Insurance, and Debt Management Systems.
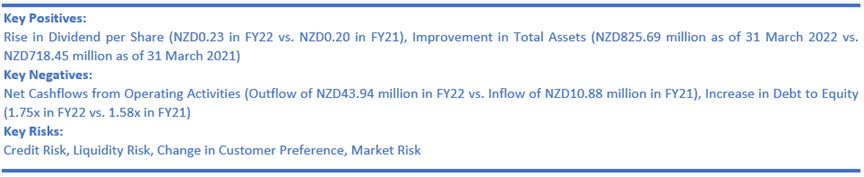
Outlook
Looking beyond FY23, the company is assured of medium to longer-term growth prospects. Further, its three-year plan focuses on organic growth and four key areas, including physical and digital investments. Going forwards, it has updated its three-year rolling target to achieve profit before tax of more than NZD50 million by FY25.
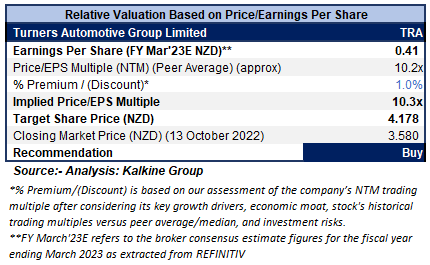
Valuation Methodology: Price/Earnings Per Share Based Relative Valuation (Illustrative)
Technical Overview:
Daily Price Chart
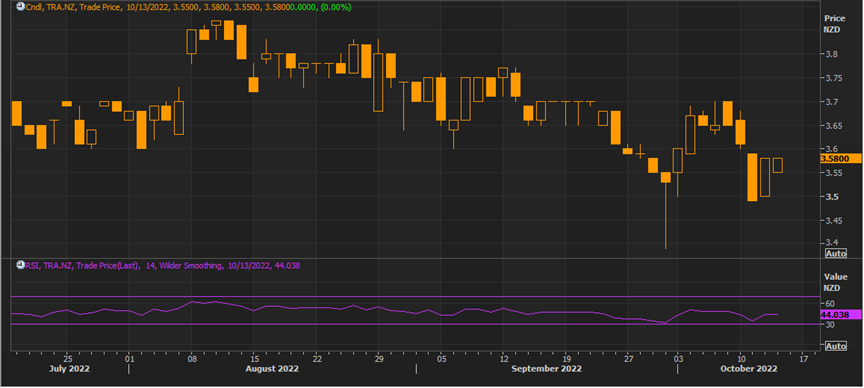
Source: REFINITIV, Note: Purple color line reflects Relative Strength Index (14-Period)
Stock Recommendation
The stock has been valued using P/E multiple-based illustrative relative valuation, and the target price reflects a rise of low double-digit (in % terms). A slight premium has been applied to P/E Multiple (NTM) (Peer Average), considering its healthy earnings growth in FY22 as well as decent outlook.
Considering the facts above, a ‘Buy’ recommendation on the stock has been provided at the closing market price of NZD3.58 per share, as of 13 October 2022.
Markets are trading in a highly volatile zone currently due to certain macro-economic issues and geopolitical tensions prevailing. Therefore, it is prudent to follow a cautious approach while investing.
Note 1: Past performance is not a reliable indicator of future performance.
Note 2: The reference date for all price data, currency, technical indicators, support, and resistance levels is October 13, 2022. The reference data in this report has been partly sourced from REFINITIV.
Note 3: Investment decisions should be made depending on an individual's appetite for upside potential, risks, holding duration, and any previous holdings. An 'Exit' from the stock can be considered if the Target Price mentioned as per the Valuation and or the technical levels provided has been achieved and is subject to the factors discussed above.
Note 4: Annual Dividend Yield is on a Trailing Twelve Month (TTM1) basis and are subject to change based on factors such as company performance, stock price changes, etc.
Technical Indicators Defined: -
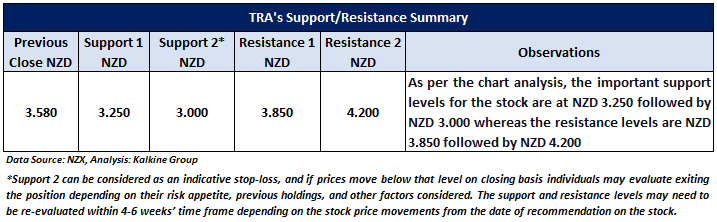
Support: A level at which the stock prices tend to find support if they are falling, and a downtrend may take a pause backed by demand or buying interest. Support 1 refers to the nearby support level for the stock and if the price breaches the level, then Support 2 may act as the crucial support level for the stock.
Resistance: A level at which the stock prices tend to find resistance when they are rising, and an uptrend may take a pause due to profit booking or selling interest. Resistance 1 refers to the nearby resistance level for the stock and if the price surpasses the level, then Resistance 2 may act as the crucial resistance level for the stock.
Stop-loss: It is a level to protect further losses in case of unfavourable movement in the stock prices.
Disclaimer
Kalkine New Zealand Limited is a Financial Advice Provider (“FAP”) and is authorised by a Transitional FAP license issued by Financial Markets Authority (“FMA”) to provide financial advice. Kalkine provides only general financial advice through its research reports following a person becoming a member. The reports contain buy/sell/hold and other recommendations in relation to equity financial products. The recommendations and opinions [on this website] / [in this report] do not take into account any of your investment objectives, financial situation or needs. Before you make a decision about whether to acquire a financial product, you should obtain the Product Disclosure Statement from the product issuer. You should consider the appropriateness of advice taking into account your own objectives, financial situation and needs and seek independent financial advice before making any financial decisions. If you act on the advice in the research reports, you may have to pay fees, expenses or other amounts (but not to Kalkine). Further information about the complaints and dispute resolution process, as well as information about Kalkine’s duties are available on Kalkine’s website. Please read our Financial Advice Provider (FAP) disclosure statement and Complaints Handling Guide, which are available on the website.
Past performance is not a reliable indicator of future performance.
 Please wait processing your request...