
1. Sector Landscape and Outlook
As per the Reserve Bank of New Zealand (RBNZ), seasonally adjusted total billings in NZ grew by 0.7% to $4.5 billion in September 2022 from August 2022, reflecting the highest seasonally adjusted value on record. The domestic billings on NZ-issued cards were reported at $4.0 billion in September 2022, like August 2022. Further, the outstanding advances at the end of September stood at $6.1 billion. Billings in NZ on overseas issued cards (actual) increased to $0.4 billion ($424 million) in September 2022, indicating the highest value recorded in a month since March 2020. Total credit limits were $21.3 billion (not seasonally adjusted), like August 2022.
Meanwhile, food prices are increasing due to supply constraints and other factors, impacting the economy, and pushing governments to impose price-controlling measures and trade restrictions. When food prices are higher, the consumers pay an increased price for the same items. Hence, they spend less on other discretionary items, which impacts the global economic recovery. However, some relief in terms of lower food prices is expected in 2023 that would benefit retailers, restaurants and packaged-food companies.
Continued Rise in Consumables in October 2022
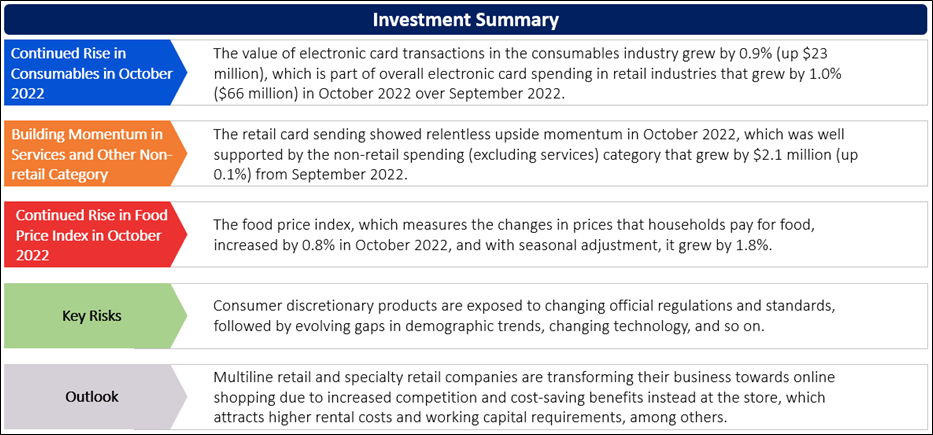
As per Stats.NZ, the value of electronic card transactions in the consumables industry grew by 0.9% (up $23 million), which is part of overall electronic card spending in retail industries that grew by 1.0% ($66 million) in October 2022 over September 2022. Meanwhile, spending in the core retail industries increased by 0.9% ($53 million). Not only the consumables industry was in the front runner, but it was also accompanied by durables, with an increase of $46 million (up 2.8%), motor vehicles (excluding fuel), an increase of $12 million (up 6.0%), fuel, an increase of $5.5 million (up 0.9%), and apparel, an increase of $1.3 million (up 0.4%) in October 2022 over September 2022.
Exhibit 1: Trend in Consumables Industry

Data Source: This work is based on/includes Stats NZ’s data which are licensed by Stats NZ for reuse under the Creative Commons Attribution 4.0 International Licence; Chart Created by Kalkine Group
Building Momentum in Services and Other Non-retail Category
As per Stats.NZ, the retail card sending showed relentless upside momentum in October 2022, which was well supported by the non-retail spending (excluding services) category that grew by $2.1 million (up 0.1%) from September 2022. This category comprises medical and other health care, travel and tour arrangement, postal and courier delivery, and other non-retail industries. Meanwhile, the services category increased by $11 million (up 3.3%), comprising categories like repair and maintenance, personal care, funeral, and other personal services. The overall value of electronic card spending, including the two non-retail categories (services and other non-retail), grew by $88 million (up 1.0%) in October 2022 from September 2022.
Exhibit 2: Trend in Retail Card Spending Since October 2019
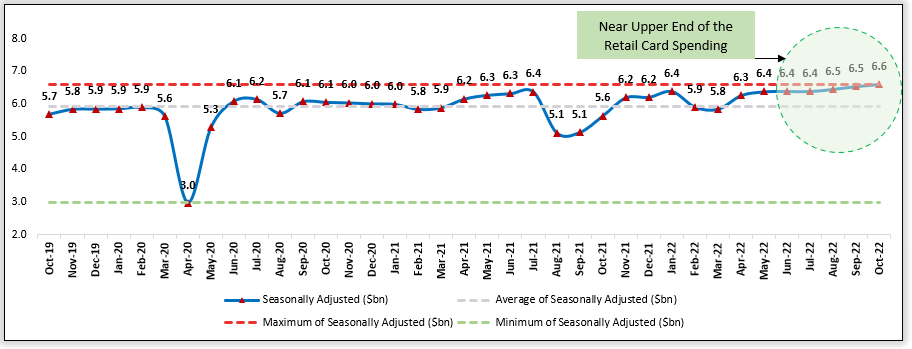
Data Source: This work is based on/includes Stats NZ’s data which are licensed by Stats NZ for reuse under the Creative Commons Attribution 4.0 International Licence; Chart Created by Kalkine Group
Continued Rise in Food Price Index in October 2022
As per Stats.NZ, the food price index that measures the changes in prices that households pay for food, increased by 0.8% in October 2022, and with seasonal adjustment, it grew by 1.8%. The primary contributor were meat, poultry, and fish prices, which grew by 2.7%. Grocery food prices rose 1.8% (up 2.0% after seasonal adjustment), and non-alcoholic beverage prices increased by 2.0%. Restaurant meals and ready-to-eat food prices increased by 1.0%, while fruit and vegetable prices decreased by 5.2% (up 1.3% after seasonal adjustment). The unemployment rate held strong at 3.3% in the September 2022 quarter due to a 1.3% increase in the employment rate with a 0.8%-point rise in the participation rate to pull it higher at 71.7%. Tight labour market conditions result in higher wage costs, with Labour Cost Index inflation increasing to 3.7%, driven by a 3.9% increase in the private sector index, surpassing its previous high in 2008.
Index Performance:
The S&P/NZX All Consumer Discretionary Index generated a 2-year return of ~-3.33% versus ~-11.52% by the S&P/NZX 50 Index. Therefore, S&P/NZX All Consumer Discretionary Index overperformed S&P/NZX 50 Index by ~8.19% in 2-year.
Exhibit 3: S&P/NZX All Consumer Discretionary Index vs S&P/NZX 50 Index
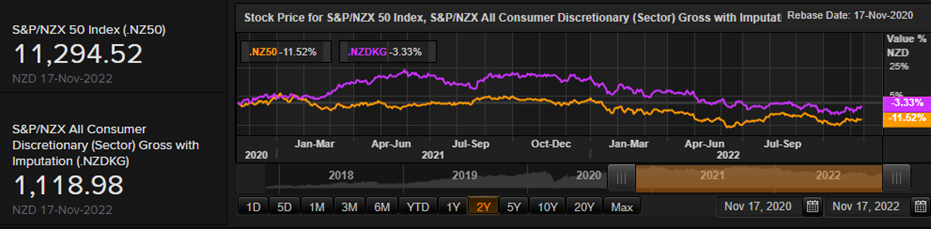
Source: REFINITIV
Key Risks and Challenges:
The retail and consumer sector are exposed to high competition from domestic and international high-tech e-commerce businesses, new brands and stores, placing established brands under pressure as their margins are getting eroded and the bottom line is under pressure. They are also increasing the demand for working capital requirements to manage the inventory level depending on the need and season. Meanwhile, consumer price inflation has grown well above the comfort level due to higher energy prices amid geopolitical tensions, supply chain disruptions and a tight workforce.
Exhibit 4. Key Risks in Retail & Consumer Sector:
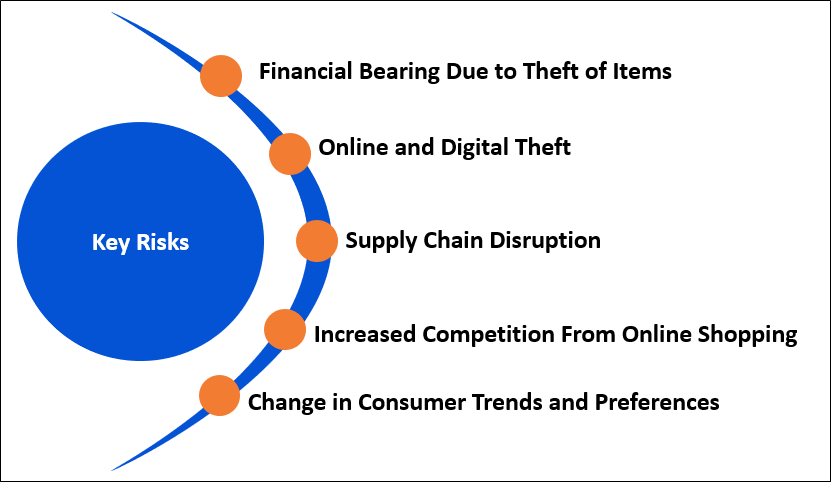
Source: Analysis by Kalkine Group
Outlook:
Multiline retail and specialty retail companies are transforming their business towards online shopping due to increased competition and cost-saving benefits instead at the store, which attracts higher rental costs and working capital requirements, among others. The physical stores and face-to-face customer engagement outlets are quickly shifting towards omnichannel strategies, including buy online, pick up in-store (BOPIS) mode to promptly take advantage of changing behaviours of customers. To remain competitive in this changing retail environment, the retailers and hospitality food service industry focus on digitization, innovation, transformation of services, and agile operating mode strategies, among others.
Apart from the sector-specific factors, an analysis on two NZX-listed companies is provided. This report covers their insights, outlook, performance and potential as expected to be delivered in the near to medium term.
1) Restaurant Brands New Zealand Limited (Recommendation: Buy, Potential Upside: Low Double-Digit) (M-Cap: NZD892.02 million, Annual Dividend Yield (TTM) 1: 6.23%)
Business Description:
Restaurant Brands New Zealand Ltd (NZX: RBD) is the corporate franchisee that specialises in managing multi-site branded food retail chains. RBD is based in NZ but has operations in Australia and the US (Hawaii, Guam and Saipan).
Outlook
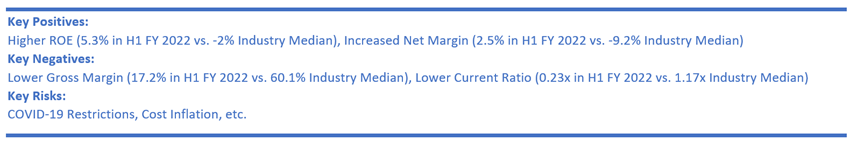
The company has been working to mitigate negative impacts as well as improve profitability over H2 FY 2022. In the interim report 2022, the company mentioned that the reported NPAT for the 2022 year is anticipated between $32-37 Mn. As at 30th June 2022, RBD had bank debt facilities totalling $NZ381.8 Mn available. The company remained comfortably within all the banking covenants with the Net Debt : EBITDA ratio of 2.1 : 1.
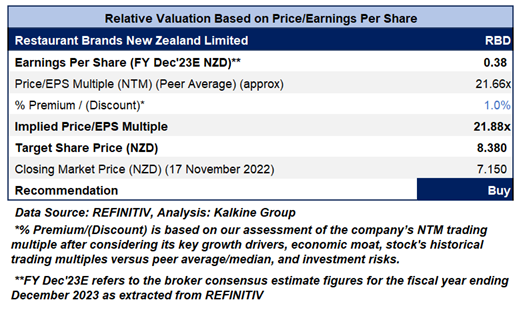
Valuation Methodology: Price/Earnings Per Share Based Relative Valuation (Illustrative)
Technical Overview:
Daily Price Chart
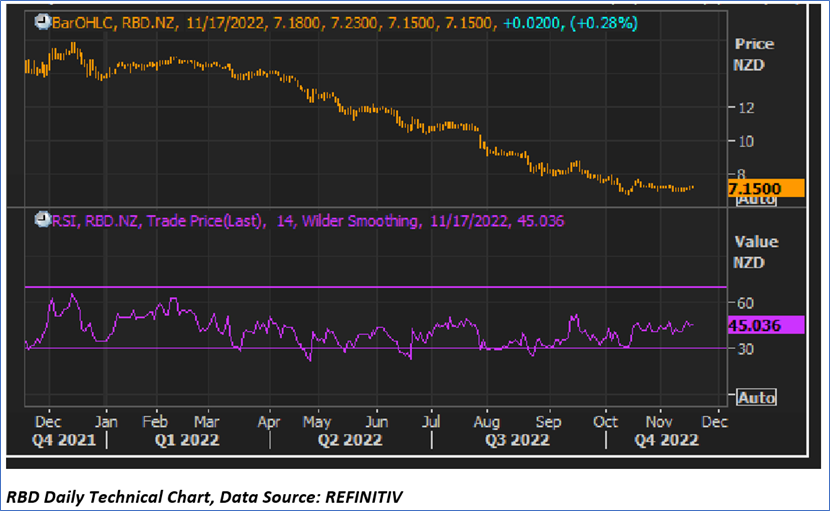
Source: REFINITIV, Note: Purple color line reflects Relative Strength Index (14-Period)
Stock Recommendation
The stock has been valued using P/E multiple-based illustrative relative valuation, and the target price reflects a rise of low double-digit (in % terms). A slight premium has been applied to P/E Multiple (NTM) (Peer Average) considering that the cost inflation as well as margins would stabilise over H2.
Considering the facts above, a ‘Buy’ recommendation on the stock has been provided at the closing market price of NZD7.150 per share, up by 0.28% as on 17th November 2022.
2) Turners Automotive Group Limited (Recommendation: Buy, Potential Upside: Low Double-Digit) (M-Cap: NZD312.1 million, Annual Dividend Yield (TTM) 1: 8.87%)
Business Description:
Turners Automotive Group Limited (NZX: TRA) is an integrated financial services group, which is primarily operating in the automotive sector.
Outlook:
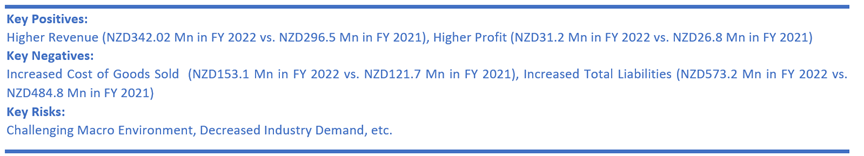
TRA is expecting H1 FY 2023 net profit before tax to be modestly ahead of H1 FY 2022 net profit before tax of $23.2 Mn for 6 months ended 30th September 2022. Despite the challenging macro environment, with 4 months of Omicron impact, higher interest rates, increased government regulation as well as fall in the industry demand, the company was able to increase the car units sold YoY. Therefore, robust growth in the market share was witnessed.
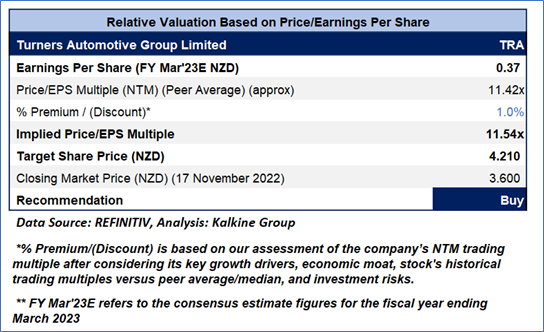
Valuation Methodology: Price/Earnings Per Share Based Relative Valuation (Illustrative)
Technical Overview:
Daily Price Chart
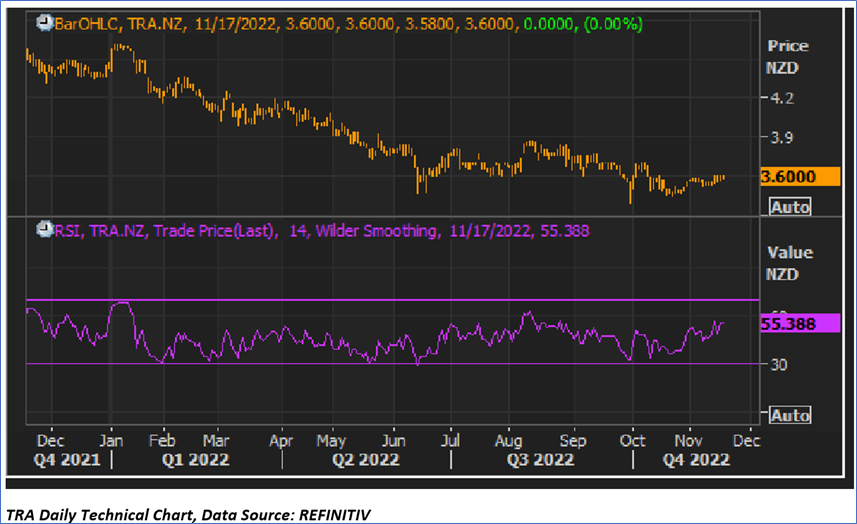
Source: REFINITIV, Note: Purple color line reflects Relative Strength Index (14-Period)
Stock Recommendation
The stock has been valued using P/E multiple-based illustrative relative valuation, and the target price so arrived reflects a rise of low double-digit (in % terms). A slight premium has been applied to P/E Multiple (NTM) (Peer Average) considering improved market share. Also, the resilience as well as diversification of the group continue to deliver robust earnings and consistent dividends.
Considering the facts above, a ‘Buy’ recommendation on the stock has been provided at the closing market price of NZD3.600 per share as on 17th November 2022.
Markets are trading in a highly volatile zone currently due to certain macro-economic issues and geopolitical tensions prevailing. Therefore, it is prudent to follow a cautious approach while investing.
Note 1: Past performance is neither an indicator nor a guarantee of future performance.
Note 2: The reference date for all price data, currency, technical indicators, support, and resistance levels is November 17, 2022. The reference data in this report has been partly sourced from REFINITIV.
Note 3: Investment decisions should be made depending on an individual's appetite for upside potential, risks, holding duration, and any previous holdings. An 'Exit' from the stock can be considered if the Target Price mentioned as per the Valuation and or the technical levels provided has been achieved and is subject to the factors discussed above.
Note 4: Annual Dividend Yield is on a Trailing Twelve Month (TTM1) basis and are subject to change based on factors such as company performance, stock price changes, etc.
Technical Indicators Defined: -
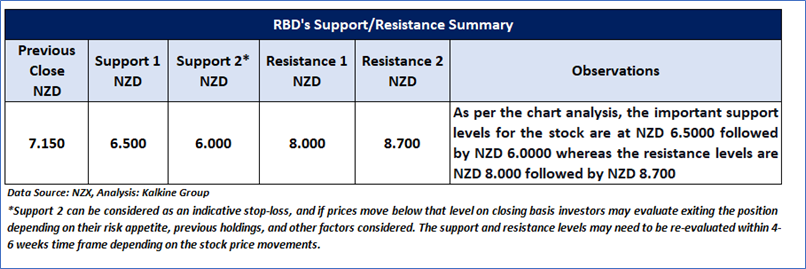
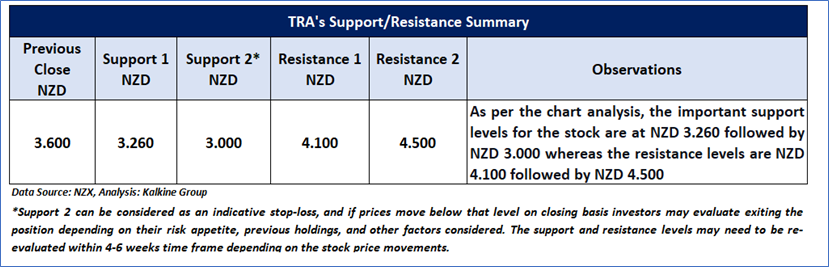
Support: A level at which the stock prices tend to find support if they are falling, and a downtrend may take a pause backed by demand or buying interest. Support 1 refers to the nearby support level for the stock and if the price breaches the level, then Support 2 may act as the crucial support level for the stock.
Resistance: A level at which the stock prices tend to find resistance when they are rising, and an uptrend may take a pause due to profit booking or selling interest. Resistance 1 refers to the nearby resistance level for the stock and if the price surpasses the level, then Resistance 2 may act as the crucial resistance level for the stock.
Stop-loss: It is a level to protect further losses in case of unfavourable movement in the stock prices.
Disclaimer
Kalkine New Zealand Limited is a Financial Advice Provider (“FAP”) and is authorised by a Transitional FAP license issued by Financial Markets Authority (“FMA”) to provide financial advice. Kalkine provides only general financial advice through its research reports following a person becoming a member. The reports contain buy/sell/hold and other recommendations in relation to equity financial products. The recommendations and opinions [on this website] / [in this report] do not take into account any of your investment objectives, financial situation or needs. Before you make a decision about whether to acquire a financial product, you should obtain the Product Disclosure Statement from the product issuer. You should consider the appropriateness of advice taking into account your own objectives, financial situation and needs and seek independent financial advice before making any financial decisions. If you act on the advice in the research reports, you may have to pay fees, expenses or other amounts (but not to Kalkine). Further information about the complaints and dispute resolution process, as well as information about Kalkine’s duties are available on Kalkine’s website. Please read our Financial Advice Provider (FAP) disclosure statement and Complaints Handling Guide, which are available on the website.
Past performance is not a reliable indicator of future performance.
 Please wait processing your request...