
I. Sector Landscape and Outlook
As per the Ministry of Business, Innovation and Employment (MBIE), energy production comes from renewable and non-renewable sources. NZ imports and exports fossil fuels, contributing to export revenue, simultaneously resulting in a dependency and vulnerability to energy commodity prices. Meanwhile, the energy generation from hydro grew 7.5% YoY in the June 2022 quarter, and generation from wind and geothermal increased 8% YoY and 5.3% YoY, respectively. The rise in hydro and wind generation resulted in a fall in reliance on fossil fuels for electricity generation. Electricity generated from coal veered sharply lower by 61.9% YoY in June quarter of 2022. Overall electricity consumption decreased by 3.3% YoY, led by a fall in all sectors. The Marsden Point refinery closed on 1 April 2022, resulting in a sharp rise in petrol and diesel imports by 104% YoY and 148% YoY, respectively, in June quarter of 2022. Jet-A1 imports grew to 1.3 million barrels from an average of 0.3 million barrels per quarter in the last five years.
Building Momentum for Renewable Sources of Energy
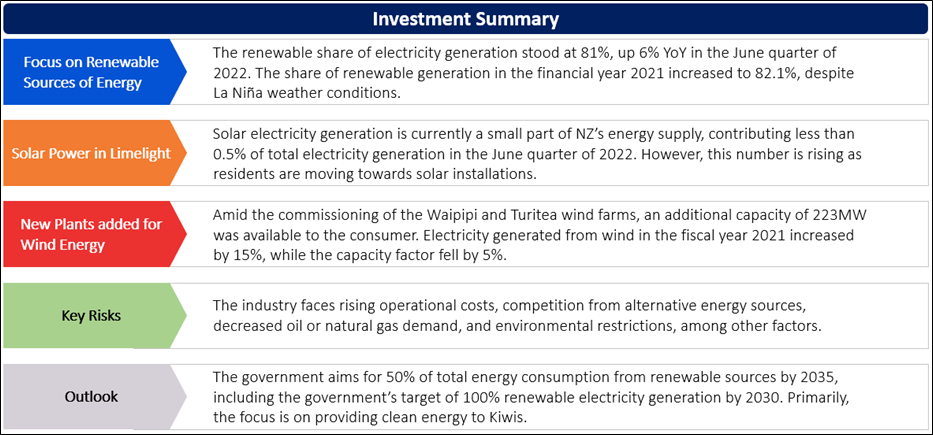
As per MBIE, the renewable share of electricity generation stood at 81%, up 6% YoY in June quarter of 2022. The share of renewable generation in the financial year 2021 increased to 82.1%, despite La Niña weather conditions. La Niña events typically bring warmer than normal temperatures in the country, along with a rise in the rain on the North Island and decreased rainfall on the South Island. Both hydro storage and inflows were below the 90-year average for the first half of 2021. Although annual electricity generation from hydro fell by 0.1%, hydro generation during the second half of 2021 alone was higher by 6.5% YoY.
Exhibit 1: Trend in Renewable Share in New Zealand Since March Quarter of 2018
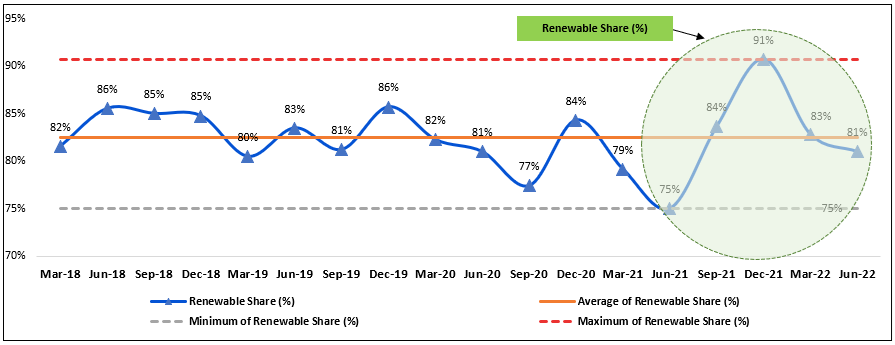
Data Source: This work is owned by the Ministry of Business, Innovation and Employment on behalf of the Crown which are licensed for reuse under the Creative Commons Attribution 4.0 International Licence; Chart Created by Kalkine Group
Electricity Generation from Solar Is Projected to Rise in Future
As per MBIE, electricity generation through solar is currently a small part of NZ’s energy supply, contributing less than 0.5% of total electricity generation in June quarter of 2022. However, this number is rising as residents are moving towards solar installations. In May 2021, Lodestone (a privately-owned renewable energy firm) stated its plans to roll out 229 megawatts of utility-scale solar capacity in NZ over the next four years for a Capex of $300 million. It anticipates generating up to 350 gigawatt-hours during the initial year and selling directly into the wholesale market. In December 2021, Christchurch Airport announced 400 hectares for constructing the Kōwhai Park energy hub, comprising 220 hectares for a 150-megawatt solar array and the first generation projected in 2025.
Exhibit 2: Trend in Solar Generation in New Zealand Since September Quarter of 2019
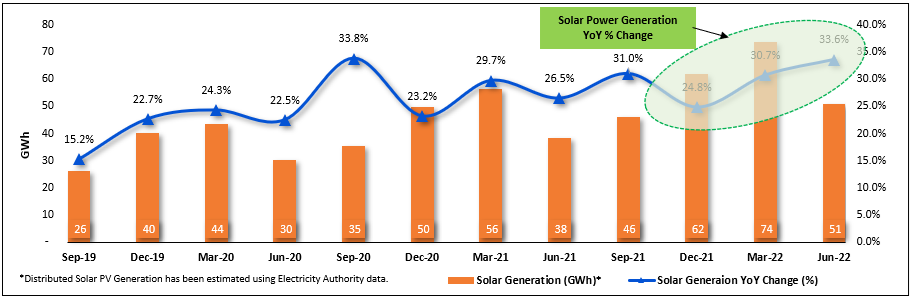
Data Source: This work is owned by the Ministry of Business, Innovation and Employment on behalf of the Crown which are licensed for reuse under the Creative Commons Attribution 4.0 International Licence; Chart Created by Kalkine Group
Wind Energy Adding Value to Electricity Generated
Amid the commissioning of the Waipipi and Turitea wind farms, an additional capacity of 223MW was available to the consumer. Electricity generated from wind in the fiscal year 2021 increased by 15%, while the capacity factor fell by 5%. This phenomenon indicates that the rise in wind generation was primarily driven by new plants addition instead of wind conditions being particularly favourable. Wind-generated 704 GWh of wind energy, up 8.0% YoY in June quarter 2022, indicating continued strength in the industry.
Index Performance:
The S&P/NZX All Utilities (Sector) Index generated a 5-year return of ~109.31% versus ~39.46% by the S&P/NZX 50 Index. Therefore, NZX All Utilities Index overperformed NZX50 Index by ~69.85% in 5-year.
Exhibit 3: S&P/NZX All Utilities (Sector) vs S&P/NZX50 Index
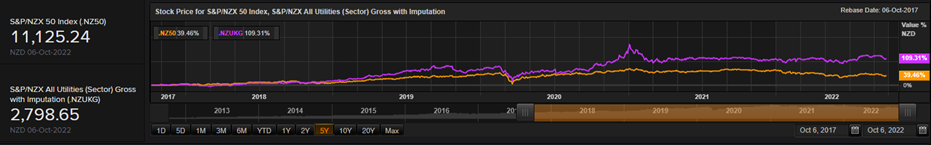
Source: REFINITIV
Key Risks and Challenges:
The government and private players have come together to support low-carbon electricity systems that are a very complex collaboration of multiple technologies with strategic functions to maximize reliable supply. Further, the disruption in the availability of raw materials used in electricity generation puts pressure on energy pricing. The choice between future non-fossil-fuel generation and fossil fuel technologies is also widening. In line with this, the power sector is also susceptible to changes in the climate suitable for energy generation, like rising water temperature, air temperature, and frequency/intensity of droughts are prospective circumstances that could impact the generation efficiency of hydropower generation and nuclear power plants.
Exhibit 4. Key Risks in Utilities Sector:
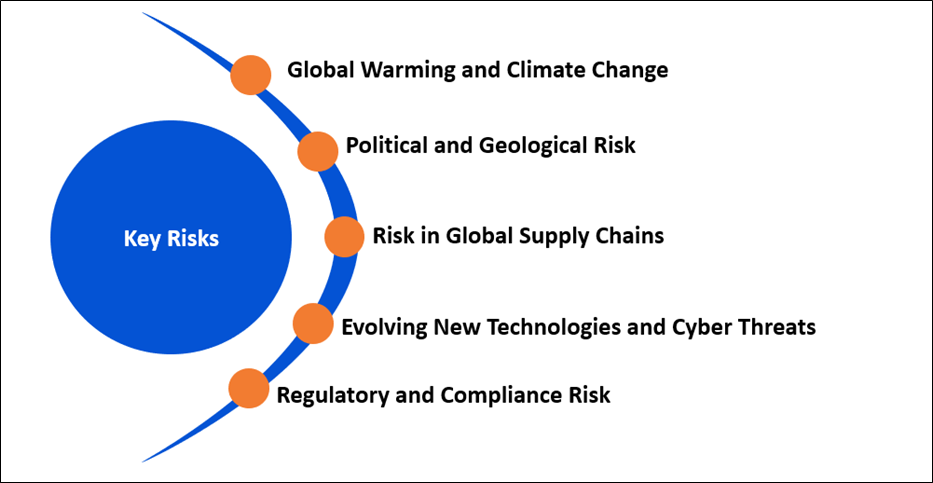
Source:- Analysis: Kalkine Group
Outlook:
The energy demand can be managed by using the energy efficiently, primarily driven by an improvement in business and household energy efficiency and the state sector’s energy efficiency and fuel switching. Further, the private and public sector undertakings are working effectively to ensure the electricity system is available to meet future needs. For this to fulfil, the focus is on developing new renewable electricity generation and developing an efficient use of transmission and distribution infrastructure to further electrify the economy. Steps have been taken towards lowering the dependency on fossil fuels, supporting the switch to low-emissions fuels, and reducing emissions and energy use in industry.
The government aims for 50% of total energy consumption from renewable sources by 2035, including the government’s target of 100% renewable electricity generation by 2030. The government is also capitalizing on energy strategies for 2024 and planning to build a new Energy Efficiency and Conservation Strategy to support the priorities rolled in the ERP and the energy strategy.
Apart from the sector-specific factors, an analysis on three NZX-listed companies is provided. This report covers their insights, outlook, performance and potential as expected to be delivered in the near to medium term.
1) Contact Energy Limited (Recommendation: Buy, Potential Upside: Low Double-Digit) (M-Cap: NZD5.83 billion, Annual Dividend Yield (TTM)1: 6.25%)
Business Description:
Contact Energy Limited (NZX: CEN) is involved in providing electricity, natural gas, and liquefied petroleum gas (LPG), along with broadband services. The electricity is generated through thermal, hydro, and geothermal sources.
Outlook
The company announced the development of a 51.4MW geothermal power station next to its existing Te Huka power station. The investment is expected to produce clean, low carbon, renewable electricity which is not reliant on the weather. Through this, the company’s renewable electricity generation capacity will increase by 25% and NZ’s total renewable electricity supply by over 5% on average per year. Further, the company stated an upgrade to the Tauhara power station’s expected capacity by 11%, from 152MW to 168MW.
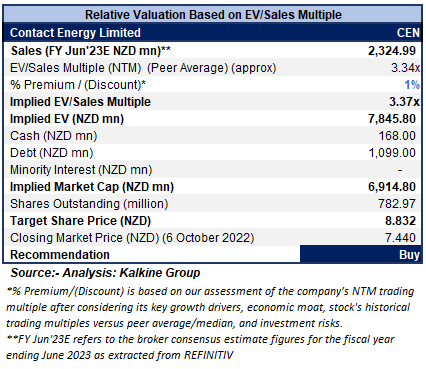
Valuation Methodology: EV/Sales Based Relative Valuation (Illustrative)
Technical Overview:
Daily Price Chart
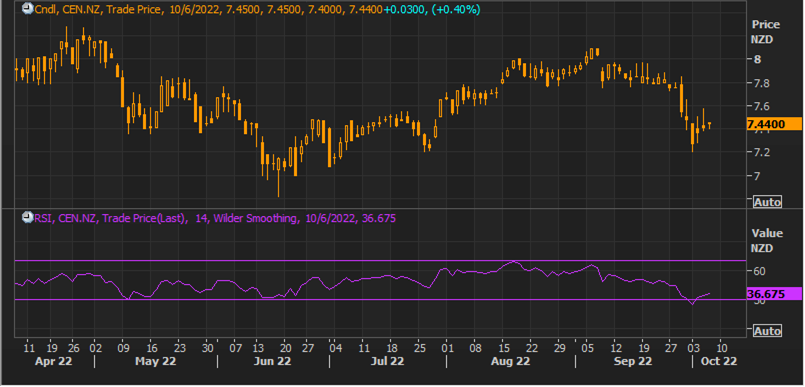
Source: REFINITIV, Note: Purple color line reflects Relative Strength Index (14-Period)
Stock Recommendation:
The stock has been valued using an EV/Sales multiple-based illustrative relative valuation, and the target price so arrived reflects a rise of low double-digit (in % terms). A slight premium has been applied to EV/Sales Multiple (NTM) (Peer Average), considering the continued growth in retail sales volumes and the focus on the renewable development pipeline.
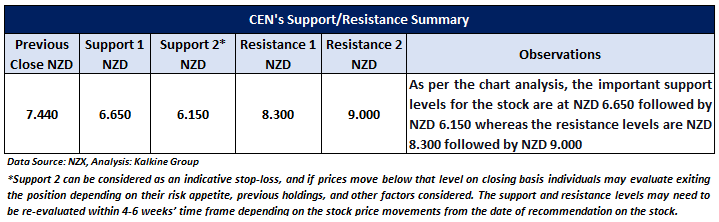
Considering the aforementioned factors, a ‘Buy’ rating on the stock has been assigned at the closing market price of NZD7.44 per share, up 0.40% as of 6 October 2022.
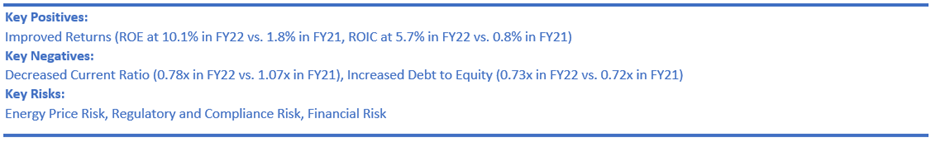
2) Manawa Energy Limited (Recommendation: Buy, Potential Upside: Low Double-Digit) (M-Cap: NZD1.73 billion, Annual Dividend Yield (TTM)1: 8.18%)
Business Desc1ription:
Manawa Energy Limited (NZX: MNW) is Aotearoa, New Zealand’s largest independent electricity generator and renewables developer.
Outlook
The company has over 30 new solar and wind development projects under active consideration, including four solar projects in the feasibility stage. It is projecting EBITDAF at $140-$160 million and capital expenditure between $45-$55 million for FY23. Moreover, it foresaw regulatory changes in the energy sector and market development opportunities to develop affordability and supply. In line with this, new technologies continue to evolve and mature into commercial viability, resulting in new investment requirements.
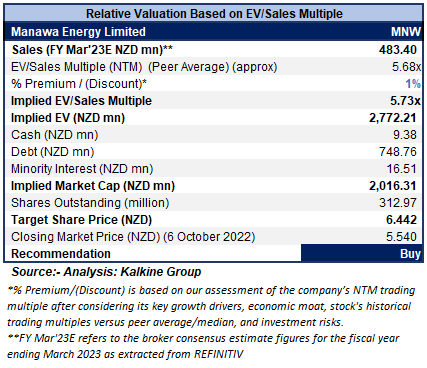
Valuation Methodology: EV/Sales Based Relative Valuation (Illustrative)
Technical Overview:
Daily Price Chart
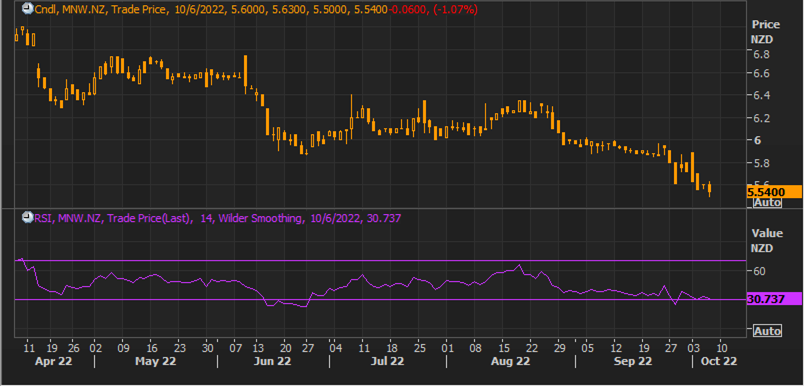
Source: REFINITIV, Note: Purple color line reflects Relative Strength Index (14-Period)
Stock Recommendation:
The stock has been valued using an EV/Sales multiple-based illustrative relative valuation, and the target price so arrived reflects a rise of low double-digit (in % terms). A slight premium has been applied to EV/Sales Multiple (NTM) (Peer Average), considering the solid financial performance in FY22 and the stable outlook.
Considering the aforementioned factors, a ‘Buy’ rating on the stock has been provided at the closing market price of NZD5.54 per share, down 1.07% as of 6 October 2022.
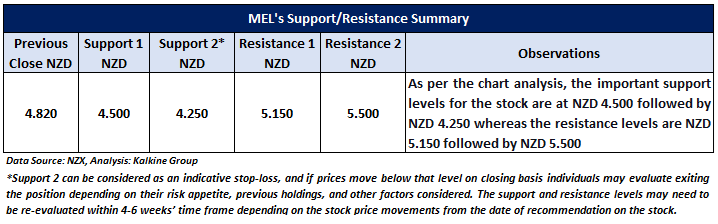
3) Meridian Energy Limited (Recommendation: Hold, Potential Upside: Low Double-Digit) (M-Cap: NZD12.44 billion, Annual Dividend Yield (TTM)1: 4.76%)
Business Description:
Meridian Energy Limited (NZX: MEL) is engaged in generating 100% renewable energy from renewable sources - wind, water, and sun. It supplies electricity to its customers from the electricity grid, which combines electricity supplied from renewable and non-renewable sources.
Outlook
The company is progressing well on the development pipeline with options secured across the wind, solar and batteries sites. The development pipeline stood at 2.4GW, comprising 1.2GW in secure options and advanced prospecting of 1.2GW. Further, the focus is on getting consent approved for the battery by the end of September 2022, and construction is anticipated to initiate in 2023 and completed in late 2024. Also, it aims to lodge consent for the solar farm by early 2023; construction is expected by early 2024 and completion in early 2025.
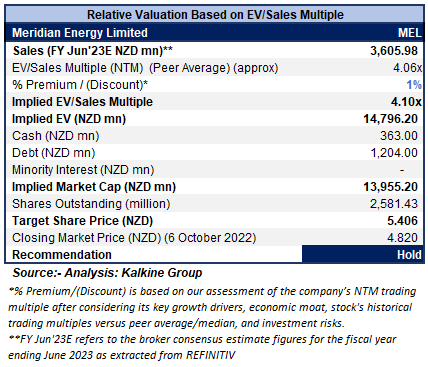
Valuation Methodology: EV/Sales Based Relative Valuation (Illustrative)
Technical Overview:
Daily Price Chart
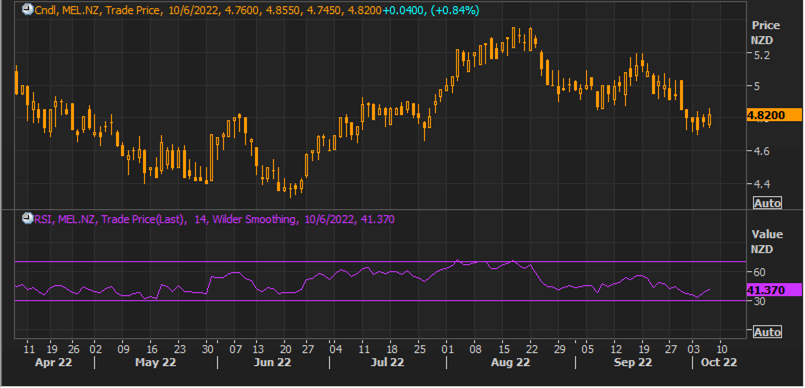
Source: REFINITIV, Note: Purple color line reflects Relative Strength Index (14-Period)
Stock Recommendation:
The stock has been valued using an EV/Sales multiple-based illustrative relative valuation, and the target price so arrived reflects a rise of low double-digit (in % terms). A slight premium has been applied to EV/Sales Multiple (NTM) (Peer Average), considering a solid development pipeline and rise in customer base.
Considering the aforementioned factors, a ‘Hold’ rating on the stock has been provided at the closing market price of NZD4.82 per share, up 0.84% as of 6 October 2022.
Markets are trading in a highly volatile zone currently due to certain macro-economic issues and geopolitical tensions prevailing. Therefore, it is prudent to follow a cautious approach while investing.
Note 1: Past performance is not a reliable indicator of future performance.
Note 2: The reference date for all price data, currency, technical indicators, support, and resistance levels is October 6, 2022. The reference data in this report has been partly sourced from REFINITIV.
Note 3: Investment decisions should be made depending on an individual's appetite for upside potential, risks, holding duration, and any previous holdings. An 'Exit' from the stock can be considered if the Target Price mentioned as per the Valuation and or the technical levels provided has been achieved and is subject to the factors discussed above.
Note 4: Annual Dividend Yield is on a Trailing Twelve Month (TTM1) basis and are subject to change based on factors such as company performance, stock price changes, etc.
Technical Indicators Defined: -
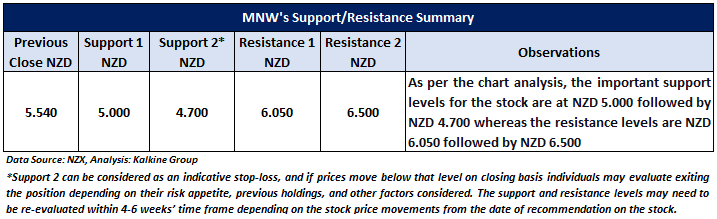
Support: A level at which the stock prices tend to find support if they are falling, and a downtrend may take a pause backed by demand or buying interest. Support 1 refers to the nearby support level for the stock and if the price breaches the level, then Support 2 may act as the crucial support level for the stock.
Resistance: A level at which the stock prices tend to find resistance when they are rising, and an uptrend may take a pause due to profit booking or selling interest. Resistance 1 refers to the nearby resistance level for the stock and if the price surpasses the level, then Resistance 2 may act as the crucial resistance level for the stock.
Stop-loss: It is a level to protect further losses in case of unfavourable movement in the stock prices.
Disclaimer
Kalkine New Zealand Limited is a Financial Advice Provider (“FAP”) and is authorised by a Transitional FAP license issued by Financial Markets Authority (“FMA”) to provide financial advice. Kalkine provides only general financial advice through its research reports following a person becoming a member. The reports contain buy/sell/hold and other recommendations in relation to equity financial products. The recommendations and opinions [on this website] / [in this report] do not take into account any of your investment objectives, financial situation or needs. Before you make a decision about whether to acquire a financial product, you should obtain the Product Disclosure Statement from the product issuer. You should consider the appropriateness of advice taking into account your own objectives, financial situation and needs and seek independent financial advice before making any financial decisions. If you act on the advice in the research reports, you may have to pay fees, expenses or other amounts (but not to Kalkine). Further information about the complaints and dispute resolution process, as well as information about Kalkine’s duties are available on Kalkine’s website. Please read our Financial Advice Provider (FAP) disclosure statement and Complaints Handling Guide, which are available on the website.
Past performance is not a reliable indicator of future performance.
 Please wait processing your request...