
1.Sector Landscape and Outlook
As per the ‘Fortnightly Economic Update’ dated 9 December 2022 released by The Treasury, recent developments in China reflect fluctuating short-term outlook. This is because easing COVID-19 restrictions resulted in higher infections as well as worker absenteeism, with China’s health system vulnerable from low vaccination rates and limited capacity. However, there were robust gains throughout wholesale trade, manufacturing, construction, and business services. Notably, pickup in transport services reflects stronger demand from tourists, construction, and in manufacturing as pandemic-related constraints are unwinding.
Overseas Merchandise Trade For the Month of November 2022
In the month of November 2022, goods exports witnessed a rise of $1.0 billion (or 18%) as compared to November 2021 to $6.7 Bn.
For the same month, goods imports rose $1.8 billion YoY to $8.5 Bn. Petroleum and products was the biggest contributor to the rise, reflecting a rise of $557 Mn (or 117%) to $1.0 Bn. Diesel increased $411 Mn (or 502%) in value, to $493 Mn. The quantity imported witnessed a rise of 216%. The average unit value rose 91%. The main country contributing to the rise was South Korea, making up 61% ($301 Mn) of the total diesel import value.
However, petrol rose $253 Mn (or 305%) in value to $336 Mn. Regarding this, the main country which contributed to the rise was Singapore.
Exhibit 1: Top Export and Import Partners in November 2022
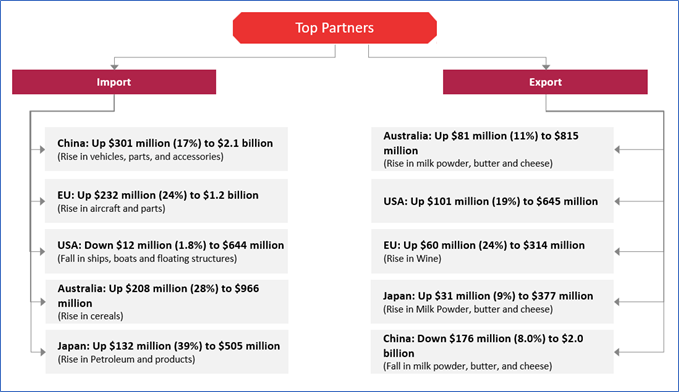
Data Source: This work is based on/includes Stats NZ’s data which are licensed by Stats NZ for reuse under the Creative Commons Attribution 4.0 International Licence; Chart Created by Kalkine Group
Imports- Other Contributors
Goods imports rise was also contributed by vehicles, parts, and accessories. Notably, vehicles, parts, and accessories witnessed a rise of $374 million (or 48%) to $1.1 Bn. Passenger motor car imports increased $277 Mn (or 63%) to $717 Mn, driven by EV imports, up $151 Mn (or 216%).
Mechanical machinery and equipment encountered a rise of $140 Mn (or 15%) to $1.1 Bn. The largest rise was witnessed in turbo-jets, up $55 Mn (64%). Electrical machinery and equipment increased $90 Mn (or 14%) to $759 Mn, with the largest rise being encountered in electric generating sets, up $12 Mn (or 352%).
Exhibit: 2 Trend in Goods Export and Import
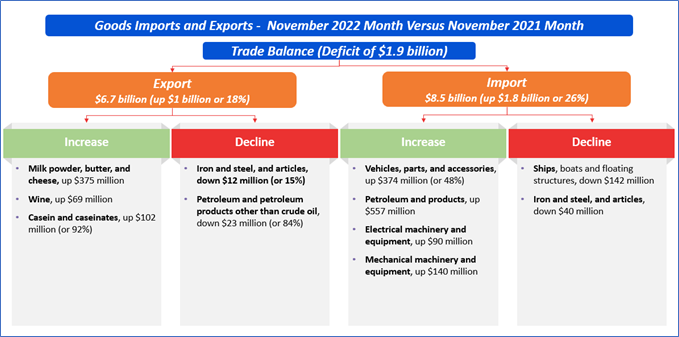
Data Source: This work is based on/includes Stats NZ’s data which are licensed by Stats NZ for reuse under the Creative Commons Attribution 4.0 International Licence; Chart Created by Kalkine Group
Index Performance:
The S&P/NZX All Industrials (Sector) Index generated a 6-month return of ~7.91% versus ~6.48% by the S&P/NZX 50 Index. Therefore, NZX All Industrials Index outperformed NZX50 Index by ~1.43%.
Exhibit 3: S&P/NZX All Industrials (Sector) vs S&P/NZX50 Index
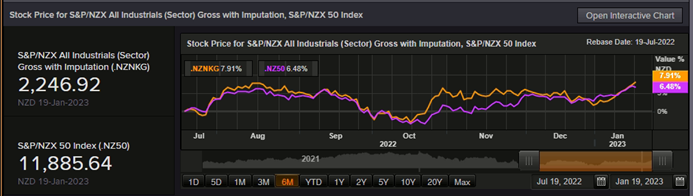
Source: REFINITIV
Key Risks and Challenges:
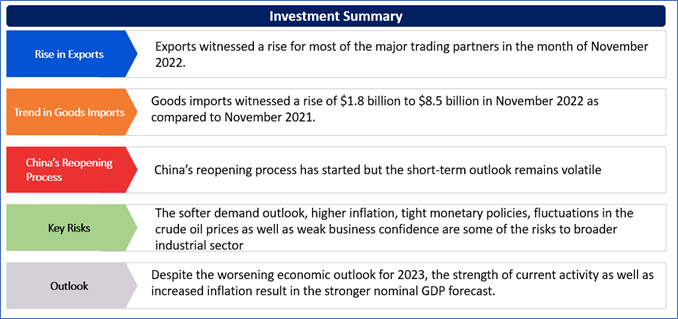
The softer demand outlook, higher inflation, tight monetary policies, fluctuations in the crude oil prices, and weak business confidence, among others, are some of the critical challenges faced by the industrials sector. As per the recent Fortnightly Economic Update dated 9 December 2022, business sentiment as well as construction demand have eased and consumer spending has softened.
Exhibit 4. Key Risks in Industrials Sector:
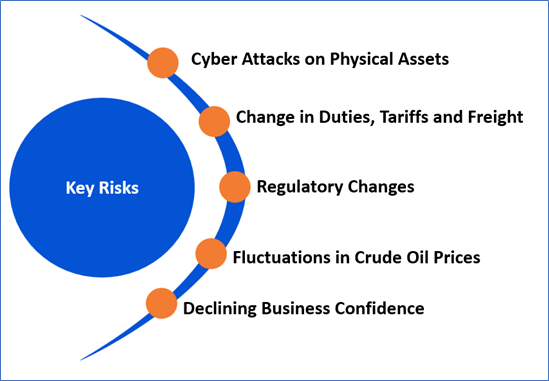
Source: Analysis by Kalkine Group
Outlook:
Decades-high consumers price index (CPI) inflation, significant growth in nominal wages as well as to some extent, the increase in the current account deficit, are indicators that the economy is operating above capacity. Despite the worsening economic outlook for 2023, the strength of current activity as well as higher inflation result in the stronger nominal GDP forecast. This, along with the stronger tax base at 30 June 2022, contributes to increased forecast tax revenue.
In total, core Crown tax revenue forecasts are $9.0 Bn higher as compared to the Budget Update forecasts or on average $2.3 Bn per annum. Notably, total core Crown revenue is anticipated to rise slightly quicker than the nominal GDP.
The Aotearoa New Zealand economy witnessed a solid growth over the H1 FY 2022, and this momentum has been forecasted to have continued over H2 FY 2022. The growth is supported by the recovery from effects of COVID-19 on household spending on services as well as the tight labour market is helping household income growth.
Apart from the sector-specific factors, an analysis on 2 NZX-listed companies is provided. This report covers their insights, outlook, performance and potential as expected to be delivered in the near to medium term.
1) MOVe Logistics Group Limited (Recommendation: Speculative Buy, Potential Upside: Low Double-Digit) (M-Cap: NZD122.2 million)
Business Description:
MOVe Logistics Group Limited (NZX: MOV) is NZ's largest end-to-end logistics experts, freight forwarders as well as warehousing providers.
Outlook:
Trading within Contract Logistics and International (including the MOVe Oceans initiative) is robust. The Atlas Wind would deliver a robust profit from its maiden voyage. The company has expanded in industry verticals where it has robust competency. Notably, it has assessed several M&A opportunities.
Technical Overview:
Daily Price Chart
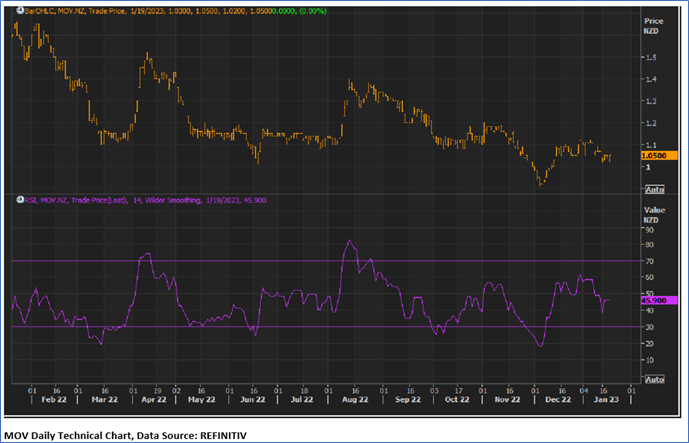
Technical Commentary
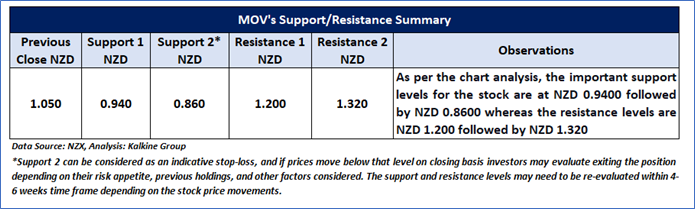
On the daily chart, MOV prices are trading above the horizontal trendline support level and taking the support from the same. Moreover, the momentum oscillator RSI (14-period) is showing a reading of ~45.90 level. However, the prices are trading below the trend-following indicators 21- period SMA, which may act as a resistance level. An important support level for the stock is placed at NZD 0.94 while the key resistance level is placed at NZD 1.20.
Stock Recommendation
Considering the aforementioned factors, a ‘Speculative Buy’ rating is given on the stock at the closing market price of NZD1.050 as of 19th January 2023.
2) Scott Technology Limited (Recommendation: Hold, Potential Upside: Low Double-Digit) (M-Cap: NZD221.33 million, Annual Dividend Yield (TTM)1: 2.91%)
Business Description:
Scott Technology Limited (NZX: SCT) is engaged in delivering smart automation as well as robotic solutions for transforming industries.
Outlook:
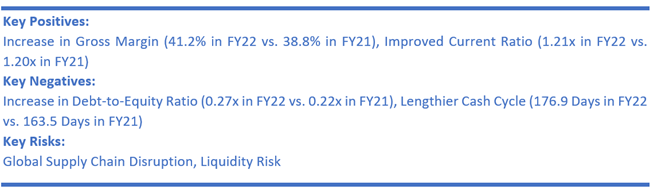
The company's core sectors are witnessing demand momentum for automation to help drive efficiency, safety and offset the global labour shortages. Further, SCT has a record NZD190 million of forward work across on-strategy meat and mining solutions. Its net debt position was $8.0 Mn as funding was deployed towards growth as well as working capital. Besides, the company is witnessing traction in customer engagement across the business, evidenced by recent large orders. This has contributed to a healthy order pipeline, which bodes well for the company in the year ahead.
Technical Overview:
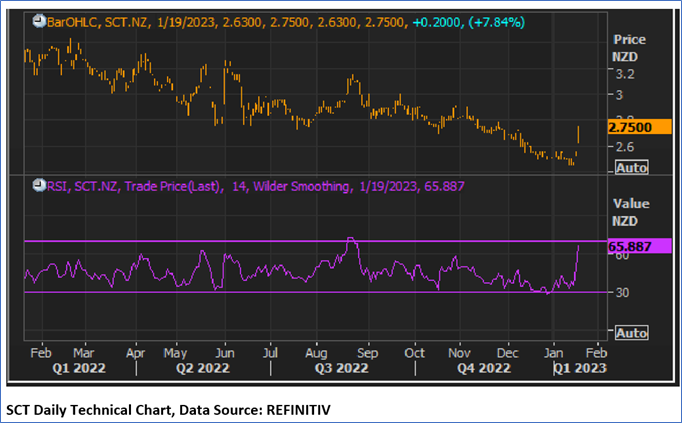
Daily Price Chart
Technical Commentary
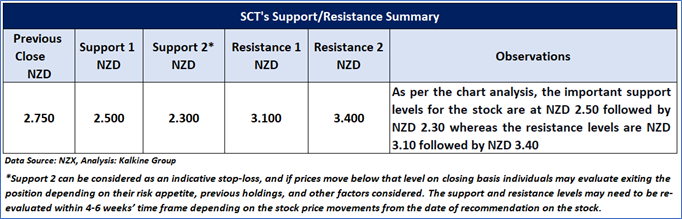
SCT stock prices breached the downward-sloping trendline by an up move, indicating a possibility to gather momentum moving ahead. Moreover, the stock is trading above the 21 & 50-period SMA, while the momentum oscillator RSI-14 period with a reading of ~65.89, suggesting a potential up move. SCT stock prices may face resistance near NZD 3.10 & NZD 3.40 levels, whereas it might struggle to test the NZD 2.50 & NZD 2.30 support levels.
Stock Recommendation
On a TTM basis, the stock of SCT is trading at an EV/Sales multiple of 1.0x compared to the industry (Machinery, Tools, Heavy Vehicles, Trains & Ships) median of 1.7x, and thus seems undervalued.
Considering the aforementioned factors, and undervaluation as indicated by the TTM valuation, a ‘Hold’ is given on the stock at the closing market price of NZD2.75, up by 7.84% as of 19 January 2023.
Markets are trading in a highly volatile zone currently due to certain macro-economic issues and geopolitical tensions prevailing. Therefore, it is prudent to follow a cautious approach while investing.
Note 1: Past performance is neither an indicator nor a guarantee of future performance.
Note 2: The reference date for all price data, currency, technical indicators, support, and resistance levels is January 19, 2023. The reference data in this report has been partly sourced from REFINITIV.
Note 3: Investment decisions should be made depending on an individual's appetite for upside potential, risks, holding duration, and any previous holdings. An 'Exit' from the stock can be considered if the Target Price mentioned as per the Valuation and or the technical levels provided has been achieved and is subject to the factors discussed above.
Note 4: Annual Dividend Yield is on a Trailing Twelve Month (TTM1) basis and are subject to change based on factors such as company performance, stock price changes, etc.
Technical Indicators Defined: -
Support: A level at which the stock prices tend to find support if they are falling, and a downtrend may take a pause backed by demand or buying interest. Support 1 refers to the nearby support level for the stock and if the price breaches the level, then Support 2 may act as the crucial support level for the stock.
Resistance: A level at which the stock prices tend to find resistance when they are rising, and an uptrend may take a pause due to profit booking or selling interest. Resistance 1 refers to the nearby resistance level for the stock and if the price surpasses the level, then Resistance 2 may act as the crucial resistance level for the stock.
Stop-loss: It is a level to protect further losses in case of unfavourable movement in the stock prices.
Disclaimer
Kalkine New Zealand Limited is a Financial Advice Provider (“FAP”) and is authorised by a Transitional FAP license issued by Financial Markets Authority (“FMA”) to provide financial advice. Kalkine provides only general financial advice through its research reports following a person becoming a member. The reports contain buy/sell/hold and other recommendations in relation to equity financial products. The recommendations and opinions [on this website] / [in this report] do not take into account any of your investment objectives, financial situation or needs. Before you make a decision about whether to acquire a financial product, you should obtain the Product Disclosure Statement from the product issuer. You should consider the appropriateness of advice taking into account your own objectives, financial situation and needs and seek independent financial advice before making any financial decisions. If you act on the advice in the research reports, you may have to pay fees, expenses or other amounts (but not to Kalkine). Further information about the complaints and dispute resolution process, as well as information about Kalkine’s duties are available on Kalkine’s website. Please read our Financial Advice Provider (FAP) disclosure statement and Complaints Handling Guide, which are available on the website.
Past performance is not a reliable indicator of future performance.
 Please wait processing your request...