
Company Overview: Scales Corporation Limited (NZX: SCL) is the diversified agribusiness portfolio. It comprises 3 operating divisions: Horticulture, Storage & Logistics and Food Ingredients. PGG Wrightson Limited (NZX: PGW) is an agricultural services business operating throughout New Zealand. Kalkine’s Sector Report covers the Key Financial Metrics, Risks, Outlook, Technical Analysis along with the Valuation, Target Price, and Recommendation on the stock.
1. Sector Landscape and Outlook
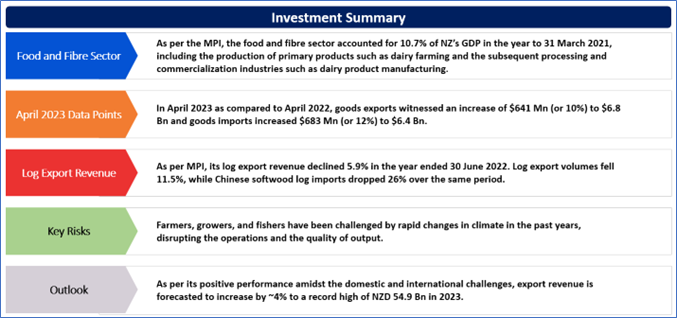
As per the Ministry for Primary Industries (MPI), the food and fibre sector accounted for 10.7% of NZ’s GDP in the year to 31 March 2021, including the production of primary products such as dairy farming and the subsequent processing and commercialisation industries such as dairy product manufacturing. The dairy export revenue increased to NZD 21.9 Bn for the year ended 30 June 2022 from NZD 19.09 Bn in 2021, owing to increased inventory from the previous season being exported this year despite the fall in dairy, meat and forestry prices in the overseas markets due to weaker NZD. Overall, Food and fibre sector export revenue also increased ~11% Y-o-Y, mainly owing to an increase in prices for most sectors. The government and agribusiness leaders signed an MOU (memorandum of understanding) for a joint venture (JV) as a part of the new Centre for Climate Action on Agricultural Emissions. This will initially invest NZD 172 Mn over the next four years to develop and commercialise practical tools and technologies for farmers.
As per its positive performance amidst the domestic and international challenges, export revenue is forecasted to increase by ~4% to a record high of NZD 54.9 Bn in 2023. The forecasted percentage has been an upgrade from the previous judgement, primarily because of sector’s performance in the market and steep fall in the New Zealand dollar (NZD).
NZ’s Consumers Price Index
As per Stats.NZ, goods exports increased NZD 40 million (up 0.6% Y-o-Y) to NZD 6.5 billion in March 2023 versus March 2022, primarily driven by the rise in the export of milk powder, butter, and cheese, wine, preparations of cereals, flour, starch, and milk and others like logs, wood, and casein etc. The export rose with all the export partners except China & Japan.
In April 2023 as compared to April 2022, goods exports witnessed an increase of $641 Mn (or 10%) to $6.8 Bn and goods imports increased $683 Mn (or 12%) to $6.4 Bn. Therefore, the monthly trade balance was the surplus of $427 Mn. Notably, milk powder, butter, and cheese (the largest export commodity group) increased $406 Mn (or 26%) to $2.0 Bn. China has led the monthly exports rise. Coming to the imports, goods imports increased $683 Mn (or 12%) to $6.4 Bn in April 2023 as compared to April 2022. The imports rise was led by petroleum and products.
Exhibit 1: Annual Change in Consumers Price Index (March 2018-March 2023)
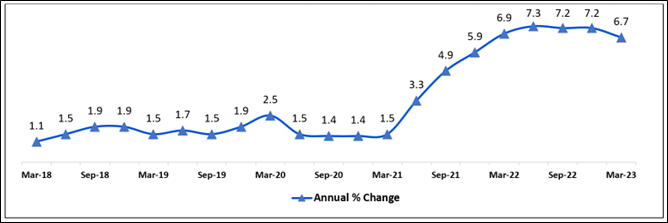
Data Source: This work is based on/includes Stats NZ’s data which are licensed by Stats NZ for reuse under the Creative Commons Attribution 4.0 International Licence; Chart Created by Kalkine Group
Forestry and Dairy Export Revenue
As per MPI, its log export revenue declined 5.9% in the year ended 30 June 2022. Log export volumes fell 11.5%, while Chinese softwood log imports dropped 26% over the same period. New Zealand’s market share in China has increased as supply from Europe comes off. Going forward, log demand is anticipated to decline as China’s economy slows down and global demand also weakens, resulting into reduced log prices and export volumes. On the other hand, panels are expected to be stable, as medium-density fibreboard prices in Japan are strong, resulting into increment of export revenue. In the year to 30 June 2023, panel export revenue is forecast to increase to $490 million.
With the easing of supply chain issues, Horticulture export revenue for the year ended 30 June 2022 grew ~2% to NZD 6.8 billion and forecast for the period ending 30 June 2023 is a further increase of ~5% rise to NZD 7.1 billion. The forestry export revenue is set to rise slightly to $6.6 Bn for the year ended 30 June 2023 because of the exchange rate offsetting the slowdown in demand.
Seafood export revenue is forecasted to recover 4% to $2.0 Bn in the year ended 30 June 2023 after the challenging 2 years dealing with the effects of COVID-19. While some challenges like air freight, labour challenges and high fuel costs remain, the export volumes increased with the return of tourism as well as growth in food service driving demand in some markets.
Exhibit 2: Trend in Dairy & Forestry Export Revenue 2018–24Forecast (F) (Year to 30 June, NZD Mn)
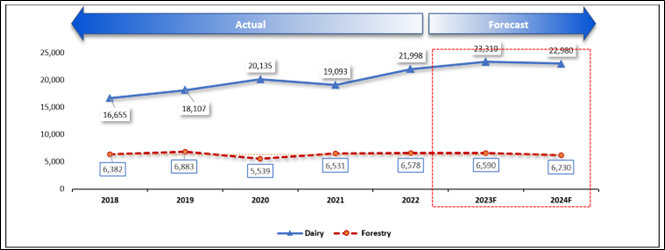
Data Source: This work is based on/includes the Ministry for Primary Industries data which are licensed under Crown for reuse under the Creative Commons Attribution 4.0 International Licence; Chart Created by Kalkine Group
Key Risks and Challenges:
Farmers, growers, and fishers have been challenged by rapid changes in climate in the past years, disrupting the operations and the quality of output. Further, frequent changes in regulatory rules to preserve the environment and reduce carbon are challenging the businesses, warehousing and logistics, thereby impacting product margins without adding any value. Rising input costs, supply chain issues and tight labour environment are other factors that affect the businesses and their operations.
Due to technological innovation, interdependency is increasing, resulting in the requirement for capital and technical know-how. For wine products, the land bank expansion is restricted due to the unavailability of fertile fields suitable for good harvesting.
At a global level, there are various challenges faced like weaker global economy due to high levels of inflation. As a result, this causes increase in the cost of living in many countries, destabilisation of the global economy caused by Russia’s conflict with Ukraine and a COVID-19 influenced slowdown in economic growth in China. The Russia-Ukraine war has also majorly affected agriculture markets and has reduced food exports from Ukraine and Russia, specifically in wheat, maize and sunflower oil, increasing the price of these commodities. Moreover, it has also resulted in reduced fertiliser exports and, combined with the high energy costs, has added upward pressure to fertiliser prices.
Exhibit 3. Key Risks in Consumer Staples Sector:
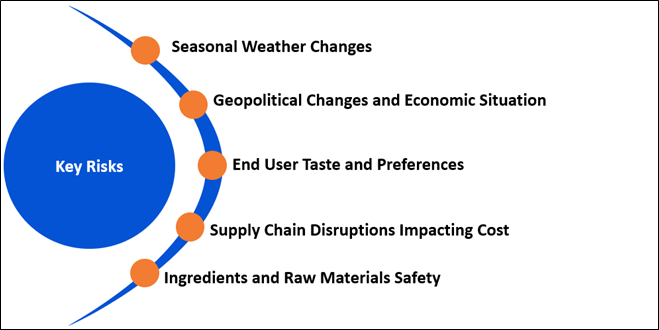
Source: Analysis by Kalkine Group
Outlook:
Going forward, for the year ending on 30 June 2023, dairy exports are forecasted to increase ~6% to NZD 23.3 Bn and NZD 22.98 Bn for 2024. The results are impacted by the weakening of the New Zealand dollar, selling the previous seasons' inventories in the current year and reduced supply from key dairy exporting regions. On the other hand, forestry export revenue hiked ~1% on a Y-o-Y basis in 2022 mainly because record-high pulp prices offset a drop in the demand for logs. And it is expected to remain flat at NZD 6.6bn for 2023 due to the weakening of the New Zealand dollar offsetting the reduced demand.
Horticulture export revenue continues to grow with a forecast of 5% to NZD 7.1 Bn in FY23, driven by high yields from the 2022 grape harvest and rising wine, avocado and onion export prices. The forecast for the year ending June 2024 is expected to increase to NZD 7.66 Bn, where wine is supposed to contribute NZD 2,400 Mn. Export revenue for processed food & other products (Includes live animals, honey and processed food) sector is forecasted to reach NZD 3.3 Bn in the year ending to 30 June 2023, which is up ~3% on a pcp basis. Innovative processed foods and cereal products are the main contributors to this growth. On the contrary, for FY 2024, the export is supposed to decline to NZD 3.06 Bn, mainly owing to the impending ban on live cattle exports via sea as of 30 April 2023.
The International Monetary Fund (IMF)’s latest forecast projects global growth of ~3.2 % in 2022 and is anticipated to slow down to ~2.7 % in 2023.
Apart from the sector-specific factors, an analysis on two NZX-listed companies is provided. This report covers their insights, outlook, performance and potential as expected to be delivered in the near to medium term.
1) Scales Corporation Limited (Recommendation: Buy, Potential Upside: Low Double-Digit) (M-Cap: NZD 450.7 Mn, Annual Dividend Yield (TTM)1: 5.71%)
Business Description:
Scales Corporation Limited (NZX: SCL) is the diversified agribusiness portfolio. It comprises 3 operating divisions: Horticulture, Storage & Logistics and Food Ingredients.
Outlook:
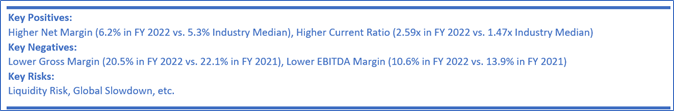
SCL mentioned that guidance for FY 2023 underlying net profit after tax attributable to shareholders has been reinstated at $14.0 Mn - $19.0 Mn. This follows an assessment of the impact of Cyclone Gabrielle as well as the review of trading forecasts in all group businesses. With respect to global proteins, early trading for FY 2023 was encouraging as well as its current initiatives are making positive progress. The company is positive about the division’s prospects for 2024 and future years.
Technical Overview:
Daily Price Chart
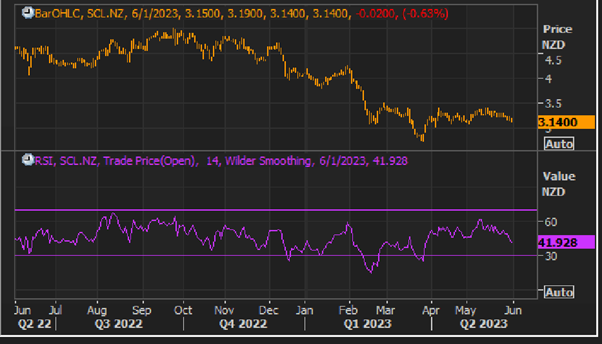
SCL Daily Technical Chart, Data Source: REFINITIV
Technical Commentary:
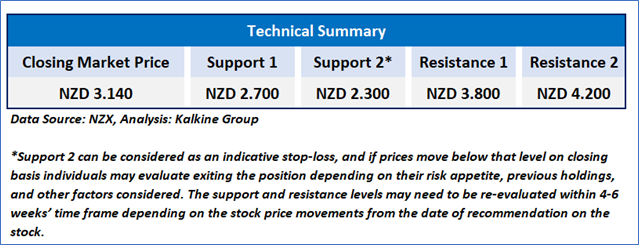
On the daily chart, SCL prices are trading above the falling trendline support zone. Moreover, the momentum oscillator RSI (14-period) is showing a reading of ~41.928 level. However, the prices are trading below the trend-following indicators 21-period SMA, which may act as a resistance zone. An important support level for the stock is placed at NZD 2.7 while the key resistance level is placed at NZD 3.8.
Fundamental Valuation:
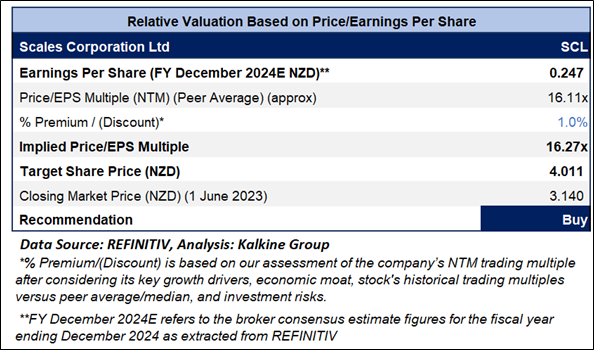
P/E Based Relative Valuation
Stock Recommendation
Considering the facts above, a ‘Buy’ recommendation on the stock has been provided at the closing market price of NZD 3.14 per share, down by 0.63% as on 1 June 2023.
2 ) PGG Wrightson Limited (Recommendation: Buy, Potential Upside: Low Double-Digit) (M-Cap: NZD 313.2 million)
Business Description:
PGG Wrightson Limited (NZX: PGW) is an agricultural services business operating throughout New Zealand.
Outlook:
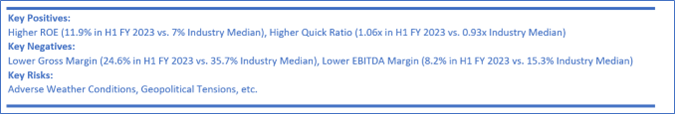
PGW reaffirmed its forecast Operating EBITDA guidance at ~ NZD 57 Mn for the financial year ended 30 June 2023. The company’s outlook remains cautious because of the volatile operating environment at the macro level. However, it has been performing well as well as executing on its strategy and there is strength in the diversity of the businesses. Therefore, the company is confident that it is well placed.
Technical Overview:
Daily Price Chart
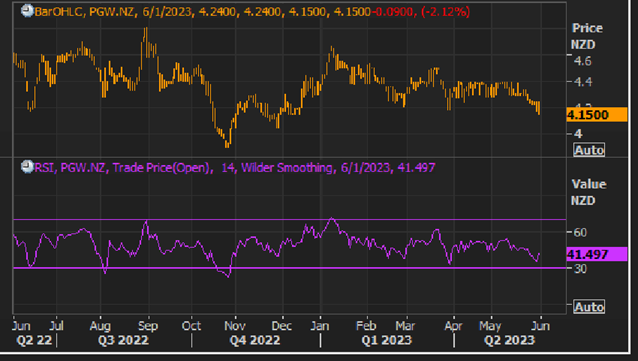
PGW Daily Technical Chart, Data Source: REFINITIV
Technical Commentary
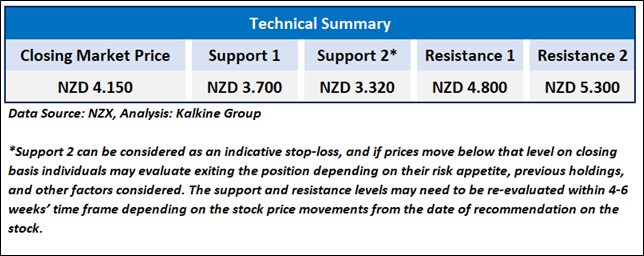
On the daily chart, PGW prices are trading above the horizontal trendline support zone. Moreover, the momentum oscillator RSI (14-period) is showing a reading of ~41.497 level. However, the prices are trading below the trend-following indicators 21-period SMA, which may act as a resistance zone. An important support level for the stock is placed at NZD 3.7 while the key resistance level is placed at NZD 4.80.
Fundamental Valuation:
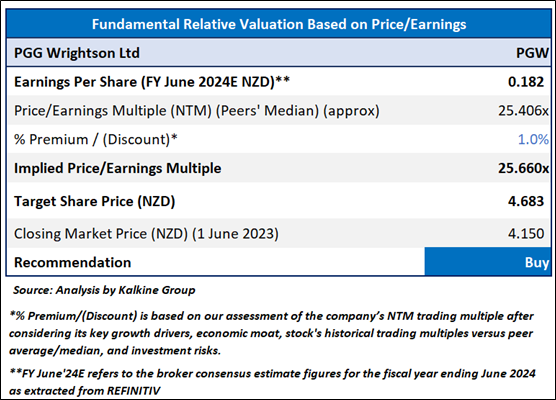
P/E Based Relative Valuation
Stock Recommendation
Considering the facts above and undervaluation as indicated valuation, a ‘Buy’ recommendation on the stock has been provided at the closing market price of NZD 4.15 per share, down by 2.12% as on 1 June 2023.
Markets are trading in a highly volatile zone currently due to certain macro-economic issues and geopolitical tensions prevailing. Therefore, it is prudent to follow a cautious approach while investing.
Note 1: Past performance is neither an indicator nor a guarantee of future performance.
Note 2: The reference data in this report has been partly sourced from REFINITIV.
Note 3: Investment decisions should be made depending on an individual's appetite for upside potential, risks, holding duration, and any previous holdings. An 'Exit' from the stock can be considered if the Target Price mentioned as per the Valuation and or the technical levels provided has been achieved and is subject to the factors discussed above.
Note 4: Annual Dividend Yield is on a Trailing Twelve Month (TTM1) basis and are subject to change based on factors such as company performance, stock price changes, etc.
Technical Indicators Defined: -
Support: A level at which the stock prices tend to find support if they are falling, and a downtrend may take a pause backed by demand or buying interest. Support 1 refers to the nearby support level for the stock and if the price breaches the level, then Support 2 may act as the crucial support level for the stock.
Resistance: A level at which the stock prices tend to find resistance when they are rising, and an uptrend may take a pause due to profit booking or selling interest. Resistance 1 refers to the nearby resistance level for the stock and if the price surpasses the level, then Resistance 2 may act as the crucial resistance level for the stock.
Stop-loss: It is a level to protect further losses in case of unfavourable movement in the stock prices.
Disclaimer
Kalkine New Zealand Limited is a Financial Advice Provider (“FAP”) and is authorised by a Class 1 Financial Advice Provider Licence issued by Financial Markets Authority (“FMA”) to provide financial advice. Kalkine provides only general financial advice through its research reports following a person becoming a member. The reports contain buy/sell/hold and other recommendations in relation to equity financial products. The recommendations and opinions [on this website] / [in this report] do not take into account any of your investment objectives, financial situation or needs. Before you make a decision about whether to acquire a financial product, you should obtain the Product Disclosure Statement from the product issuer. You should consider the appropriateness of advice taking into account your own objectives, financial situation and needs and seek independent financial advice before making any financial decisions. If you act on the advice in the research reports, you may have to pay fees, expenses or other amounts (but not to Kalkine). Further information about the complaints and dispute resolution process, as well as information about Kalkine’s duties are available on Kalkine’s website. Please read our Financial Advice Provider (FAP) disclosure statement and Complaints Handling Guide, which are available on the website.
Past performance is not a reliable indicator of future performance.
 Please wait processing your request...