
I. Sector Landscape and Outlook
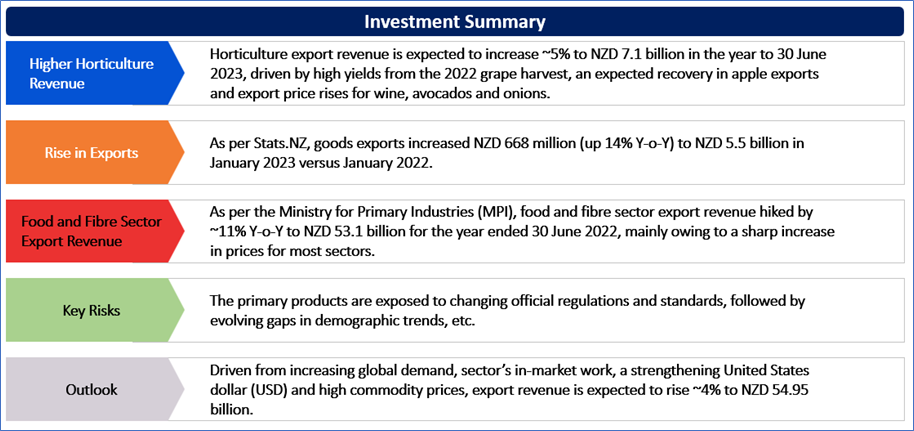
As per the Ministry for Primary Industries (MPI), food and fibre sector export revenue hiked by ~11% Y-o-Y to NZD 53.1 billion for the year ended 30 June 2022, mainly owing to a sharp increase in prices for most sectors. As per its positive performance amidst the domestic and international challenges, export revenue is forecasted to increase by ~4% to a record high of NZD 55.0 billion in 2022/23. The forecasted percentage has been an upgrade from previous judgement, primarily because of sector’s performance in the market and steep fall in the New Zealand dollar (NZD).
Horticulture export revenue is expected to increase ~5% to NZD 7.1 billion in the year to 30 June 2023, driven by high yields from the 2022 grape harvest, an expected recovery in apple exports and export price rises for wine, avocados and onions. On one hand, supply chain issues are easing for most exporters, on the other hand, labour supply and rising input costs continue to be headwinds for the sector.
Dairy products’ overseas demand weakened as well as there is an estimated 2% decline in milk production. Still, the dairy export revenue is forecasted to increase by ~6% to reach NZD 23.3 billion in the year to 30 June 2023, owing to the weaken NZD. Though the farmgate milk price of NZD 8.95 per kilogram of milk-solids seems to be relatively on a higher side, however, the margins are expected to be subdued due to higher input costs.
Major Contributors of Exports in New Zealand in January 2023
As per Stats.NZ, goods exports increased NZD 668 million (up 14% Y-o-Y) to NZD 5.5 billion in January 2023 versus January 2022, primarily driven by the rise in the export of milk powder, butter, and cheese by NZD 406 million (up 25% YoY), Wine by 31% YoY, Preparations of cereals, flour, starch, and milk by 34% Y-o-Y, among others. Where the export rose with all the export partners, China led the export marathon by upscaling it to NZD 1.5 billion in January month 2023.
Exhibit 1: Trend in Monthly Import & Export of NZ with Trade Balance

Data Source: This work is based on/includes Stats NZ’s data which are licensed by Stats NZ for reuse under the Creative Commons Attribution 4.0 International Licence; Chart Created by Kalkine Group
Recovery Phase in Horticulture and Seafood
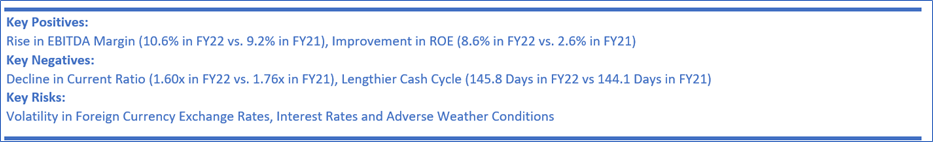
As per MPI, with the easing of supply chain issues, horticulture export revenue for the year ended 30 June 2022 grew ~2% to NZD 6.8 billion and forecast for the period ending 30 June 2023 is a further increase of ~5% rise to NZD 7.1 billion. This is expected to be mainly driven by high yields from the 2022 grape vintage, an expected recovery in apple exports and forecast export price increases for wine, avocados, and onions. Apple and pear crop production for the 2023 is forecasted to recover to 580,000 tonnes (up ~12%) assuming average to unfavourable climatic conditions.
Moreover, seafood segment is also seeing a mode of recovery because of the return of tourism and growth in food service driving demand in some markets.
Exhibit 2: Trend in Wine & Seafood Export Revenue 2018–24Forecast (F) (Year to 30 June, NZ)
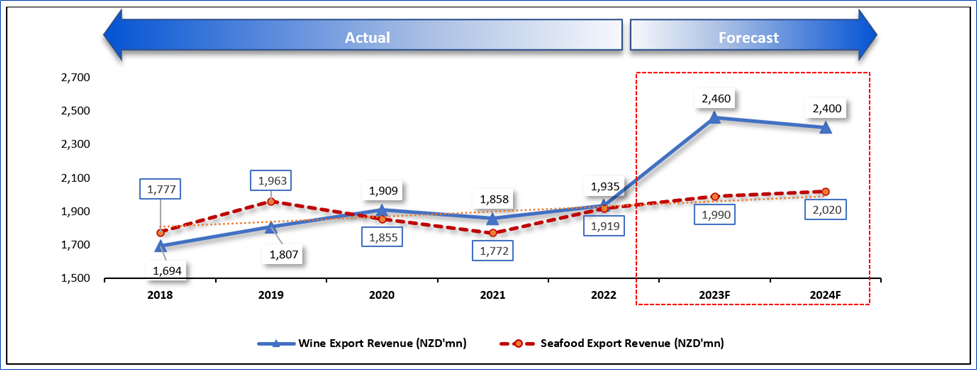
Data Source: This work is based on/includes the Ministry for Primary Industries data which are licensed under Crown for reuse under the Creative Commons Attribution 4.0 International Licence; Chart Created by Kalkine Group
Index Performance:
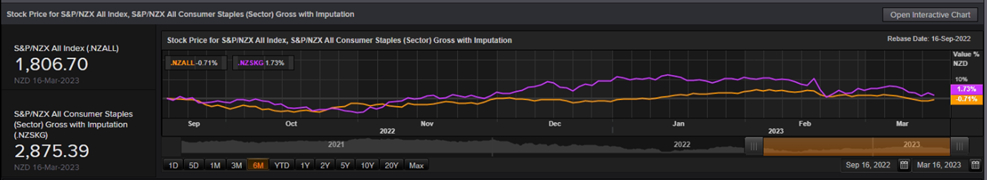
The S&P/NZX All Consumer Staples Index generated a 6-month return of ~1.73% versus ~-0.71% by the S&P/NZX All Index. Therefore, S&P/NZX All Consumer Staples Index overperformed S&P/NZX All Index by ~2.44% in 6 months
Exhibit 3: S&P/NZX All Consumer Staples Index vs S&P/NZX All Index
Source: REFINITIV
Key Risks and Challenges:
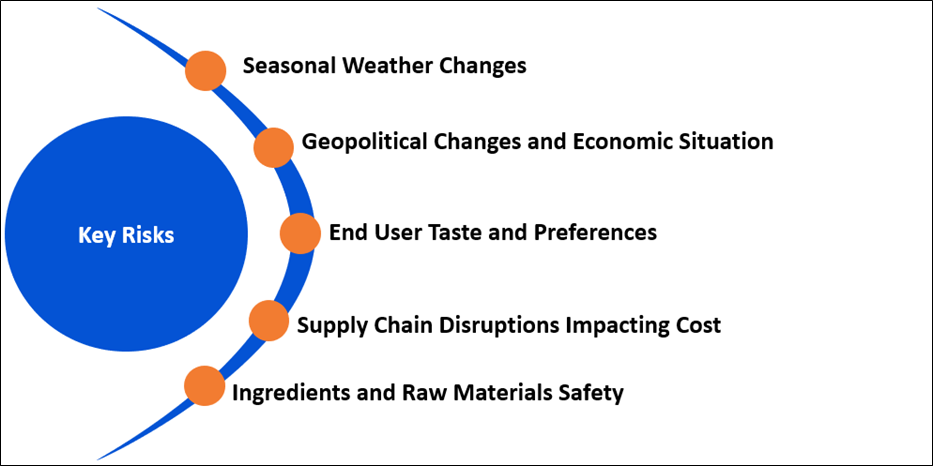
Farmers, growers, and fishers have been challenged by rapid changes in climate in the past years, disrupting the operations and the quality of output. Further, frequent changes in regulatory rules to preserve the environment and reduce carbon are challenging the businesses, warehousing and logistics, thereby impacting product margins without adding any value. Rising input costs, supply chain issues and tight labour environment are other factors that affect the businesses and their operations. Due to technological innovation, interdependency is increasing, resulting in the requirement for capital and technical know-how. For wine products, the land bank expansion is restricted due to the unavailability of fertile fields suitable for good harvesting.
At a global level, there are various challenges faced like weaker global economy due to high levels of inflation. As a result, this causes increase in the cost of living in many countries, destabilisation of the global economy caused by Russia’s conflict with Ukraine and a COVID-19 influenced slowdown in economic growth in China.
Exhibit 4. Key Risks in Consumer Staples Sector:
Source: Analysis by Kalkine Group
Outlook:
Driven from increasing global demand, sector’s in-market work, a strengthening United States dollar (USD) and high commodity prices, export revenue is expected to rise ~4% to NZD 54.95 billion. Despite the forecast increases in the export revenue for all the sectors in 2022/23, the margins would be affected for most sectors due to high input costs. A further drop in shipping costs is anticipated as COVID-19 issues have resolved. The increased availability and falling costs of containers will aid New Zealand exports return to the markets, unlike previously non-competitive in past. The drop in prices would also enable a transfer of some of the gains across the supply chain both upstream to farmers and downstream to consumers. The International Monetary Fund (IMF)’s latest forecast projects global growth of ~3.2 % in 2022 and is expected to slow down to ~2.7% in 2023. With the pause growth in the world’s three largest economies – the United States (US), the EU and China - New Zealand food and fibre sector’s might also get impacted in the short to medium term. However, movements in the NZD can have a material impact on export revenue of NZ.
Apart from the sector-specific factors, an analysis on two NZX-listed companies is provided. This report covers their insights, outlook, performance and potential as expected to be delivered in the near to medium term.
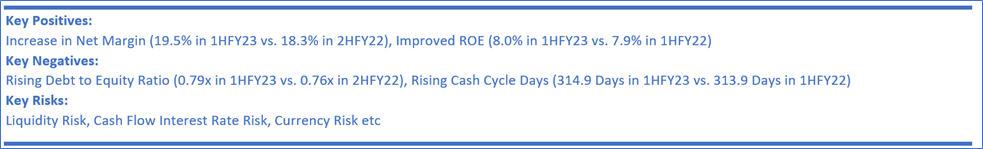
1) Delegat Group Limited (Recommendation: Buy, Potential Upside: Low Double-Digit) (M-Cap: NZD 910.17 million), Annual Dividend Yield (TTM)1: 3.086%)
Business Description:
Delegat Group Limited (NZX: DGL) is a New Zealand based wine company. Its segments include Delegat Limited, Delegat Australia Pty Ltd, Delegat Europe Limited, Delegat USA, Inc. and Other Segments.
Outlook:
During the year, the Group has invested in vineyard developments and winery expansion (including NZD39.9 million purchase of the previously leased Dashwood vineyard in Marlborough) to provide for future earnings growth. The company is working towards achieving a global case sales growth to 3,649,000 cases in FY23 (~9% upside on pcp). Based on the prevailing exchange rates, the Group forecasts its operating profit guidance in the range of NZD 59 million to NZD 62 million.
Fundamental Valuation:
P/E Multiple Based Relative Valuation

Technical Overview:
Daily Price Chart
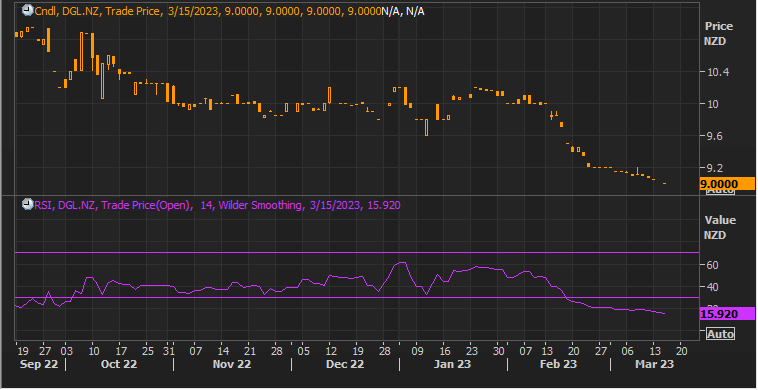
DGL Daily Technical Chart, Data Source: REFINITIV
Note: Purple color line reflects Relative Strength Index (14-Period)
Technical Commentary
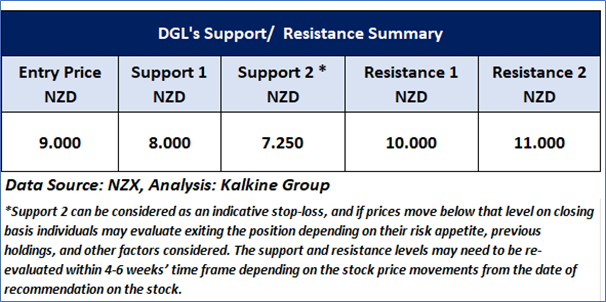
On the daily chart, DGL prices are trading below the falling trendline resistance level and facing resistance from the same. Moreover, the momentum oscillator RSI (14-period) is showing a reading of ~15.92 level. Further, the prices are trading below the trend-following indicators 21-period SMA, which may act as a resistance zone. An important support level for the stock is placed at NZD8.00 while the key resistance level is placed at NZD10.00
Stock Recommendation
Considering the facts above and undervaluation as indicated by the relative valuation, a ‘Buy’ recommendation on the stock has been provided at the closing market price of NZD 9.000 per share as of 15 March 2023.
2) Sanford Limited (Recommendation: Buy, Potential Upside: Low Double-Digit) (M-Cap: NZD 377.76 million, Annual Dividend Yield (TTM)1: 3.429%)
Business Description:
Sanford Limited (NZX: SAN) is engaged in the fishing and aquaculture farming business and is focused on farming, harvesting, processing, storage and marketing seafood products and investments in related activities.
Outlook:
As per its trading update for 1QFY23, prices in all divisions have improved. The company is confident that it would achieve the expected sales volumes over the full year, subject to catch as well as harvest meeting expectations. The management estimated capital expenditure to be between NZD 280 Mn and NZD 340 Mn from FY23 to FY27.
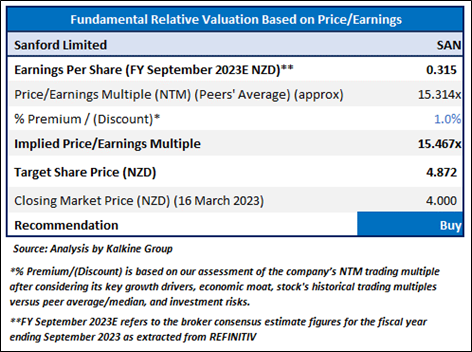
Fundamental Valuation:
P/E Multiple Based Relative Valuation
Technical Overview:
Daily Price Chart
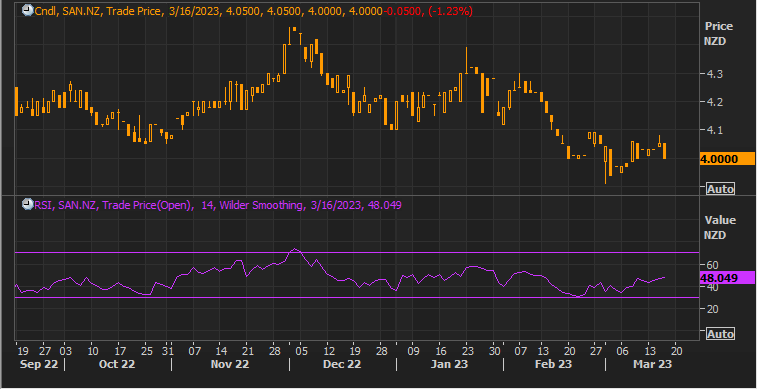
SAN Daily Technical Chart, Data Source: REFINITIV
Note: Purple color line reflects Relative Strength Index (14-Period)
Technical Commentary
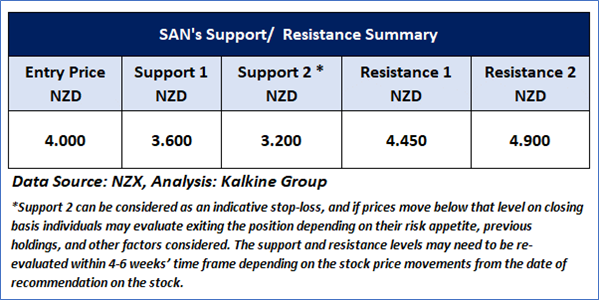
On the daily chart, SAN prices are sustaining below the rising trendline support zone and facing resistance from the trendline. Moreover, the momentum oscillator RSI (14-period) is showing a reading of ~48.049 level. Further, the prices are trading below the trend-following indicators 21-period SMA, which may act as a resistance zone. An important support level for the stock is placed at NZD3.60 while the key resistance level is placed at NZD 4.45.
Stock Recommendation
Considering the facts above and undervaluation as indicated by the relative valuation, a ‘Buy’ recommendation on the stock has been provided at the closing market price of NZD 4.000 per share, down by ~1.23% as of 16 March 2023.
Markets are trading in a highly volatile zone currently due to certain macro-economic issues and geopolitical tensions prevailing. Therefore, it is prudent to follow a cautious approach while investing.
Note 1: Past performance is neither an indicator nor a guarantee of future performance.
Note 2: The reference date for all price data, currency, technical indicators, support, and resistance levels is March 16, 2023. The reference data in this report has been partly sourced from REFINITIV.
Note 3: Investment decisions should be made depending on an individual's appetite for upside potential, risks, holding duration, and any previous holdings. An 'Exit' from the stock can be considered if the Target Price mentioned as per the Valuation and or the technical levels provided has been achieved and is subject to the factors discussed above.
Technical Indicators Defined: -
Support: A level at which the stock prices tend to find support if they are falling, and a downtrend may take a pause backed by demand or buying interest. Support 1 refers to the nearby support level for the stock and if the price breaches the level, then Support 2 may act as the crucial support level for the stock.
Resistance: A level at which the stock prices tend to find resistance when they are rising, and an uptrend may take a pause due to profit booking or selling interest. Resistance 1 refers to the nearby resistance level for the stock and if the price surpasses the level, then Resistance 2 may act as the crucial resistance level for the stock.
Stop-loss: It is a level to protect further losses in case of unfavourable movement in the stock prices.
Disclaimer
Kalkine New Zealand Limited is a Financial Advice Provider (“FAP”) and is authorised by a Class 1 Financial Advice Provider Licence issued by Financial Markets Authority (“FMA”) to provide financial advice. Kalkine provides only general financial advice through its research reports following a person becoming a member. The reports contain buy/sell/hold and other recommendations in relation to equity financial products. The recommendations and opinions [on this website] / [in this report] do not take into account any of your investment objectives, financial situation or needs. Before you make a decision about whether to acquire a financial product, you should obtain the Product Disclosure Statement from the product issuer. You should consider the appropriateness of advice taking into account your own objectives, financial situation and needs and seek independent financial advice before making any financial decisions. If you act on the advice in the research reports, you may have to pay fees, expenses or other amounts (but not to Kalkine). Further information about the complaints and dispute resolution process, as well as information about Kalkine’s duties are available on Kalkine’s website. Please read our Financial Advice Provider (FAP) disclosure statement and Complaints Handling Guide, which are available on the website.
Past performance is not a reliable indicator of future performance.
 Please wait processing your request...