
1. Sector Landscape and Outlook
As per the Ministry for Primary Industries (MPI), the momentum in the primary industry is anticipated to boost food and fibre export revenue to reach $56.8 billion for the year to 30 June 2026. Dairy export revenue is on a decent trend as the export revenue is increasing month over month, as indicated by the ‘Overseas merchandise trade’ published in September 2022 and October 2022. From the wine segment, the shift is towards exporting premium wine in the bottle instead of lower-priced bulk wine. Export revenue from wine is projected to increase by 4.4% in the year to 30 June 2022, despite last year’s production falling 19%. This rise will be driven by sales volumes and tight supplies resulting in higher prices. Seafood export revenue is anticipated to rise 9% to reach $1.9 billion in the year to 30 June 2022, primarily driven by the reopening of food service and demand rebounding.
Dairy Extended its Lead in Export Values in October 2022
As per Stats.NZ, goods exports increased $758 million (up 14% YoY) to $6.1 billion in October 2022 versus October 2021, primarily driven by the rise in the export of milk powder, butter, and cheese by $503 million (up 34% YoY) to $2.0 billion. In this rise, the primary contributor was milk powder, which grew by $218 million (up 26% YoY) in value to $1.1 billion. The price per kilogram grew by 25% YoY in October 2022. Milk fats and butter followed the momentum and increased by $194 million (up 82% YoY) to $432 million, primarily driven by the rise in price per kilogram by 32% YoY.
Exhibit 1: Trend in Monthly Exports of Milk Powder per kg
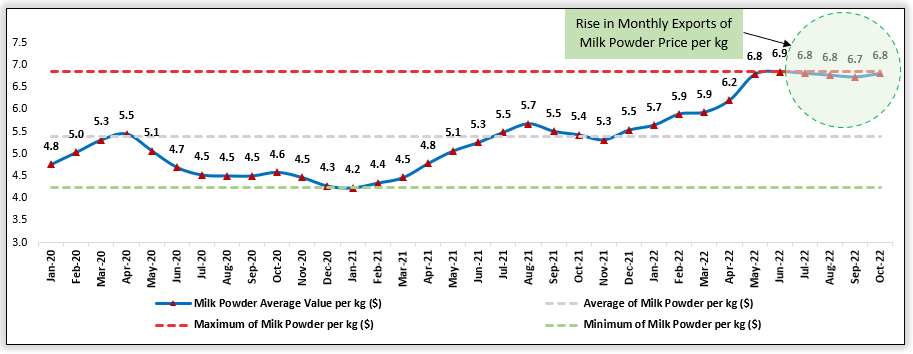
Data Source: This work is based on/includes Stats NZ’s data which are licensed by Stats NZ for reuse under the Creative Commons Attribution 4.0 International Licence; Chart Created by Kalkine Group
Higher Production Volume of Wine is Expected to Boost Export
As per MPI, overseas demand for wine has been solid since the pandemic began, which is highly supported by higher production volumes in 2022. This momentum is expected to continue, primarily driven by the major exporting countries (US, UK, EU, Australia, and Canada). Export revenue is projected to rise 12% in the year to 30 June 2023 to $2.2 billion. The slight rise in the 2021 vintage drove higher prices and related inventories. However, export volume is projected to fall by 4.5% in the year to 30 June 2022, while prices are projected to grow by 12.8% in response to tighter supplies. The strategic shift from lower-priced bulk exports to high-quality bottled exports is also attributable to higher average export prices. In addition, export prices grew by ~6.5% in most categories.
Exhibit 2: Trend in Wine Export Value 2018–23Forecast (F) (Year to 30 June, NZ$ million)
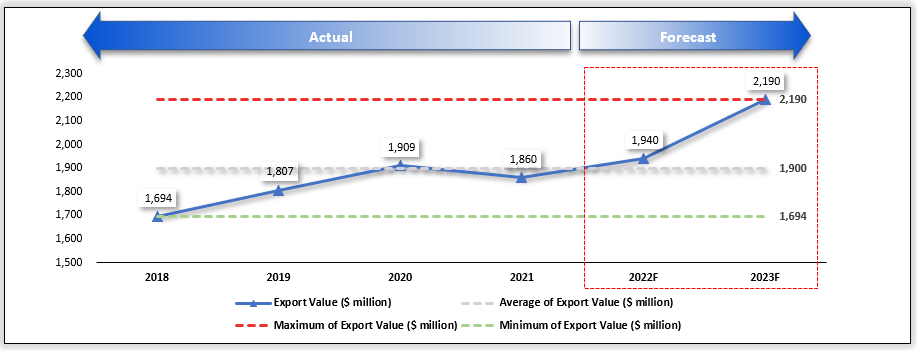
Data Source: This work is based on/includes the Ministry for Primary Industries data which are licensed under Crown for reuse under the Creative Commons Attribution 4.0 International Licence; Chart Created by Kalkine Group
Seafood Export Revenue is Expected to Rise in FY22
As per MPI, seafood export revenue is anticipated to rise by 9% to $1.9 billion for the year to 30 June 2022, primarily driven by the rise in prices and volumes. Prices are expected to increase due to tight global supply, demand revival, and food service reopening despite ongoing logistic issues and opening borders. Record prices for wild capture and aquaculture exports will be partially nullified by the rise in operating costs, which pressure businesses. Open ocean salmon farming is expected to determine future growth momentum for the industry.
Exhibit 3: Trend in Seafood Export Value 2019–26Forecast (F) (Year to 30 June, NZ$ million)
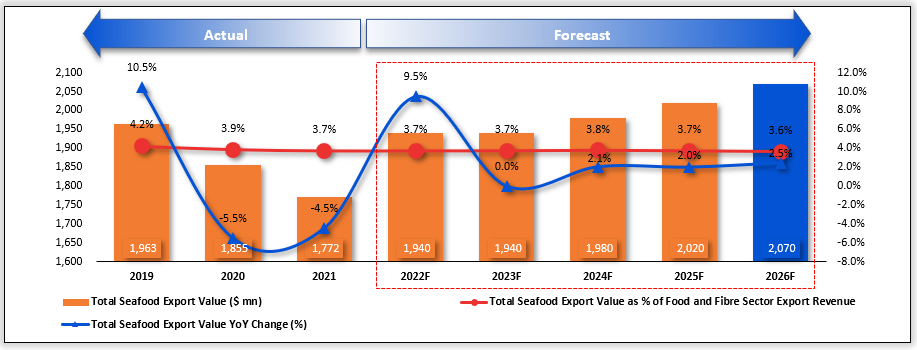
Data Source: This work is based on/includes the Ministry for Primary Industries data which are licensed under Crown for reuse under the Creative Commons Attribution 4.0 International Licence; Chart Created by Kalkine Group
Index Performance:
The S&P/NZX All Consumer Staples Index generated a 6-month return of ~14.03% versus ~0.42% by the S&P/NZX All Index. Therefore, S&P/NZX All Consumer Staples Index overperformed S&P/NZX All Index by ~13.61% in 6-month.
Exhibit 4: S&P/NZX All Consumer Staples Index vs S&P/NZX All Index
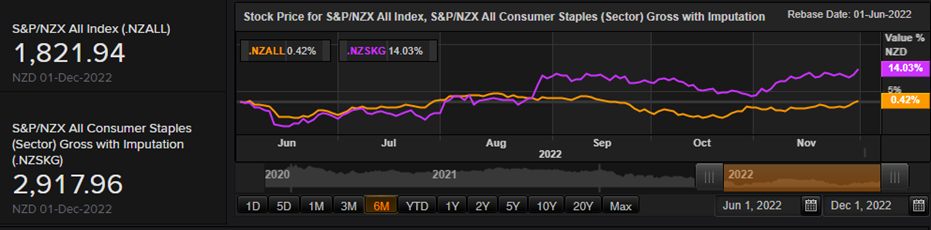
Source: REFINITIV
Key Risks and Challenges:
Farmers, growers, and fishers have been challenged by rapid changes in climate in the past years, disrupting the operations and the quality of output. Further, frequent changes in regulatory rules to preserve the environment and reduce carbon are challenging the businesses, warehousing and logistics, thereby impacting product margins without adding any value. Due to technological innovation, interdependency is increasing, resulting in the requirement for capital and technical know-how. For wine products, the land bank expansion is restricted due to the unavailability of fertile fields suitable for good harvesting.
Exhibit 5. Key Risks in Consumer Staples Sector:
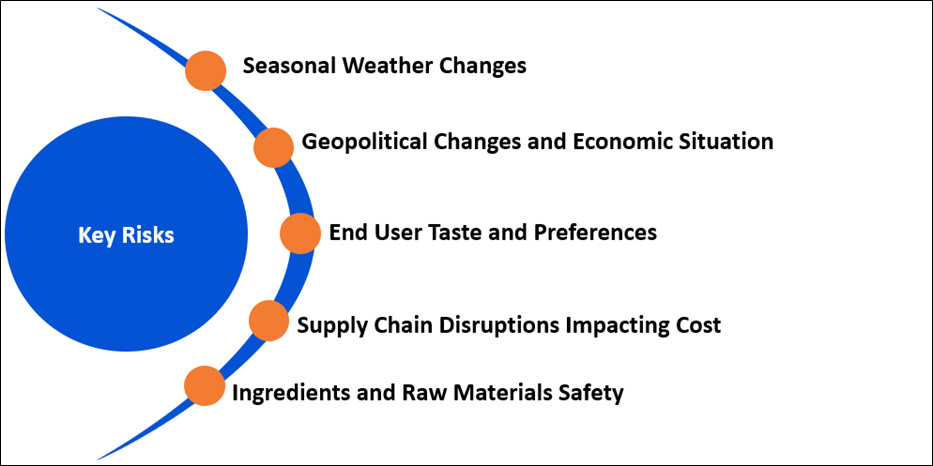
Source: Analysis by Kalkine Group
Outlook:
The Reserve Bank of New Zealand increased the OCR by 75 basis points (bps), indicating a higher-than-expected OCR peak in 2023, leading to a contraction. Despite decreasing house prices and low business confidence, high retail sales and inflation pressures communicate the underlying strength of demand in the economy. The global economy is facing similar challenges, indicating a gloomy outlook. The retail trade survey shows a rise in sales volumes by 0.4% in the September 2022 quarter, while sales values increased by 2.5%. Consumer spending is projected to cool down by the end of 2022 as headwinds gather and tightening of monetary policy.
From the food and fibre space, the dairy product categories, except infant formula, are projected to outperform their 5-year average in export earnings. Similarly, the wine industry is expected to rise, driven by improved export demand. The strategy is focused on enhancing value-added goods and capturing new export destinations.
Apart from the sector-specific factors, an analysis on two NZX-listed companies is provided. This report covers their insights, outlook, performance and potential as expected to be delivered in the near to medium term.
1) PGG Wrightson Limited (Recommendation: Buy, Potential Upside: Low Double-Digit) (M-Cap: NZD316.28 million, Annual Dividend Yield (TTM)1: 10.04%)
Business Description:
PGG Wrightson Limited (NZX: PGW) has a rich heritage of over 170 years working alongside New Zealand farmers to service their on-farm needs. The Group operates through two primary operating segments, Agency, and Retail & Water.
Outlook:
The company anticipates a positive run for most NZ agri-sectors for the remainder of 2022 and 2023. However, inflationary pressures on input costs will disrupt on-farm profits, and the exporters must mitigate elevated shipping costs and challenging logistics. Trading for 1Q’FY23 has been in line with the company’s plan, including a subdued real estate market. PGW anticipates Operating EBITDA (Earnings before net interest and finance costs, income tax, depreciation, amortisation) for FY2023 to be ~NZD62 million.
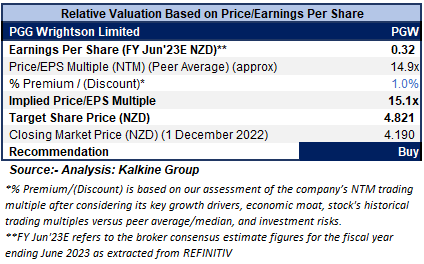
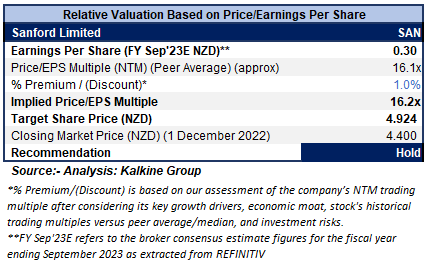
Valuation Methodology: Price/Earnings Per Share Based Relative Valuation (Illustrative)
Technical Overview:
Daily Price Chart
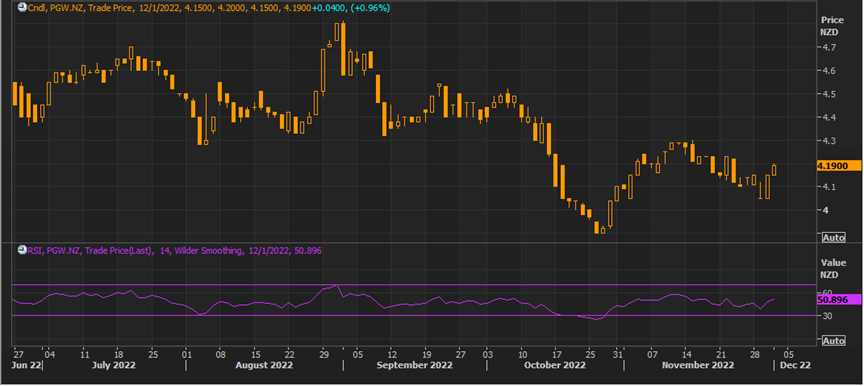
Source: REFINITIV, Note: Purple color line reflects Relative Strength Index (14-Period)
Stock Recommendation
The stock has been valued using P/E multiple-based illustrative relative valuation and the target price so arrived reflects a rise of low double-digit (in % terms). A slight premium has been applied to P/E Multiple (NTM) (Peer Average), considering positive tone set by the company in 1Q’FY23 and EBITDA guidance for FY2023.
Considering the facts above, a ‘Buy’ recommendation on the stock has been provided at the closing market price of NZD4.19 per share, up 0.96% as of 1 December 2022.
2) Sanford Limited (Recommendation: Hold, Potential Upside: Low Double-Digit) (M-Cap: NZD411.43 million, Annual Dividend Yield (TTM)1: 3.16%)
Business Description:
Sanford Limited (NZX: SAN) is New Zealand's largest and oldest seafood company and the only fully integrated seafood business.
Outlook:
The company is advancing with its Strategic Refresh initiative, with a plan for future growth and return to pre-Covid profitability and beyond. The company’s five-year capex range is now estimated to be NZD280-NZD340 million over FY23 to FY27. For FY23, the company expects higher export prices and demand to sustain and its Bioactives plant to deliver increased revenue and profits. Besides, the company continues to adopt a prudent approach to capital expenditure and is currently contracting a new vessel for its scampi fleet.
Valuation Methodology: Price/Earnings Per Share Based Relative Valuation (Illustrative)
Technical Overview:
Daily Price Chart
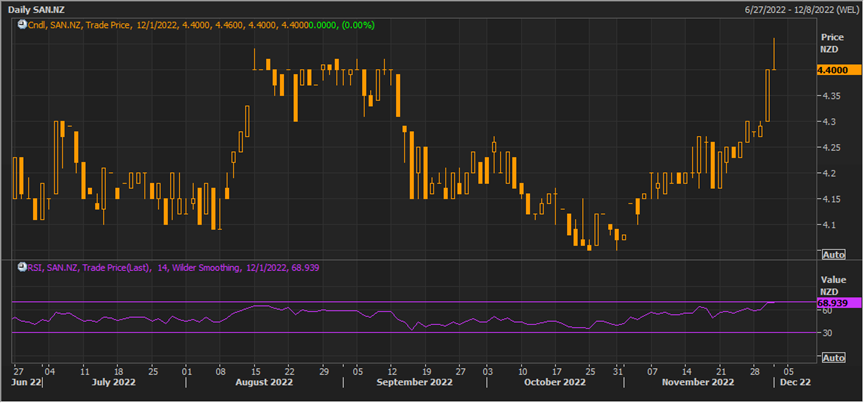
Source: REFINITIV, Note: Purple color line reflects Relative Strength Index (14-Period)
Stock Recommendation
The stock has been valued using P/E multiple-based illustrative relative valuation, and the target price reflects a rise of low double-digit (in % terms). A slight premium has been applied to P/E Multiple (NTM) (Peer Average), considering the improvement in profitability in FY22, resumption of shareholder dividends and momentum in demand.
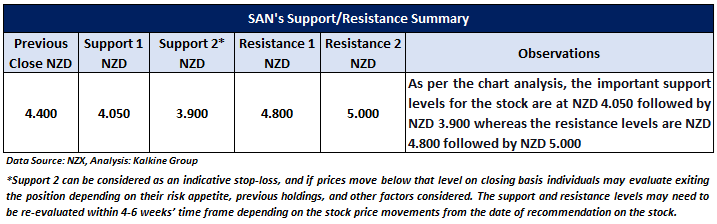
Considering the facts above, a ‘Hold’ recommendation on the stock has been provided at the closing market price of NZD4.40 per share, up 2.33% as of 1 December 2022.
Markets are trading in a highly volatile zone currently due to certain macro-economic issues and geopolitical tensions prevailing. Therefore, it is prudent to follow a cautious approach while investing.
Note 1: Past performance is not a reliable indicator of future performance.
Note 2: The reference date for all price data, currency, technical indicators, support, and resistance levels is December 1, 2022. The reference data in this report has been partly sourced from REFINITIV.
Note 3: Investment decisions should be made depending on an individual's appetite for upside potential, risks, holding duration, and any previous holdings. An 'Exit' from the stock can be considered if the Target Price mentioned as per the Valuation and or the technical levels provided has been achieved and is subject to the factors discussed above.
Note 4: Annual Dividend Yield is on a Trailing Twelve Month (TTM1) basis and are subject to change based on factors such as company performance, stock price changes, etc.
Technical Indicators Defined: -
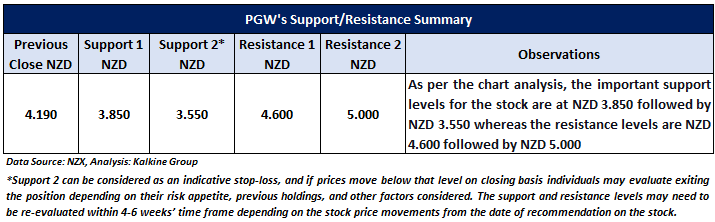
Support: A level at which the stock prices tend to find support if they are falling, and a downtrend may take a pause backed by demand or buying interest. Support 1 refers to the nearby support level for the stock and if the price breaches the level, then Support 2 may act as the crucial support level for the stock.
Resistance: A level at which the stock prices tend to find resistance when they are rising, and an uptrend may take a pause due to profit booking or selling interest. Resistance 1 refers to the nearby resistance level for the stock and if the price surpasses the level, then Resistance 2 may act as the crucial resistance level for the stock.
Stop-loss: It is a level to protect further losses in case of unfavourable movement in the stock prices.
Disclaimer
Kalkine New Zealand Limited is a Financial Advice Provider (“FAP”) and is authorised by a Transitional FAP license issued by Financial Markets Authority (“FMA”) to provide financial advice. Kalkine provides only general financial advice through its research reports following a person becoming a member. The reports contain buy/sell/hold and other recommendations in relation to equity financial products. The recommendations and opinions [on this website] / [in this report] do not take into account any of your investment objectives, financial situation or needs. Before you make a decision about whether to acquire a financial product, you should obtain the Product Disclosure Statement from the product issuer. You should consider the appropriateness of advice taking into account your own objectives, financial situation and needs and seek independent financial advice before making any financial decisions. If you act on the advice in the research reports, you may have to pay fees, expenses or other amounts (but not to Kalkine). Further information about the complaints and dispute resolution process, as well as information about Kalkine’s duties are available on Kalkine’s website. Please read our Financial Advice Provider (FAP) disclosure statement and Complaints Handling Guide, which are available on the website.
Past performance is not a reliable indicator of future performance.
 Please wait processing your request...