
Company Overview: Barramundi Limited (NZX: BRM) is a listed investment company that invests in growing Australian companies. Westpac Banking Corporation (NZX: WBC) is an Australian multinational banking and financial services company. Kalkine’s Sector Report covers the Key Financial Metrics, Risks, Outlook, Technical Analysis along with the Valuation, Target Price, and Recommendation on the stock.
1. Sector Landscape and Outlook
Financial institutions have remained resilient in the past few months. Bank profitability continued to recover as well as capital levels are being increased in preparation for upcoming regulatory requirements. On 18th May, the Government unveiled Budget 2023, which focused towards easing cost of living pressures as well as making deployments towards infrastructure. The Treasury’s Economic and Fiscal Update (Budget Update) presented to parliament forecasted the moderate economic slowdown this year. The labour market is yet to show convincing signs of easing with the unemployment rate holding steady, together with wage as well as employment growth, mainly because of robust net migration. Globally, central banks are tightening policy as activity and labour markets show resilience and core inflation persists at elevated levels. Financial markets are focusing towards the implications of banking sector stress, tighter credit conditions and the US debt ceiling, while weaker data in China is raising questions about the sustainability of the post-pandemic recovery.
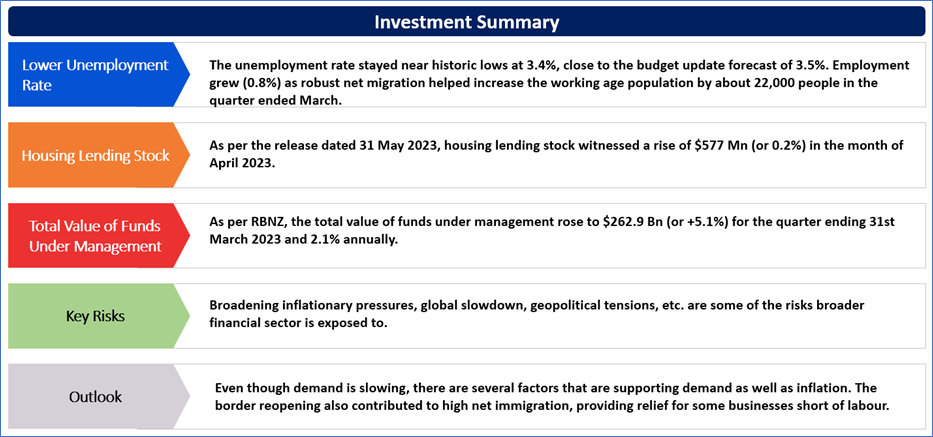
The unemployment rate stayed near historic lows at 3.4%, close to the budget update forecast of 3.5%. Employment grew (0.8%) as robust net migration helped increase the working age population by about 22,000 people in the quarter ended March.
Sector lending summary – Banks & NBLIs
As per the release dated 31 May 2023, housing lending stock witnessed a rise of $577 Mn (or 0.2%) in the month of April 2023. Annual growth fell from 3.5% to 3.2%. Personal consumer lending stock rose $52 Mn (or 0.4%) in April 2023. The annual growth rate fell from 4.1% to 3.8%. Business lending stock rose by $627 Mn (or 0.5%) in April 2023. The annual growth rate decreased further from 4.9% to 4.4%. Agriculture lending stock fell $145 Mn (or -0.2%). The annual growth rate declined from 1.3% to 1.2%, which was the first drop since October 2022.
Exhibit 1:–Annual Growth Rate- Summary
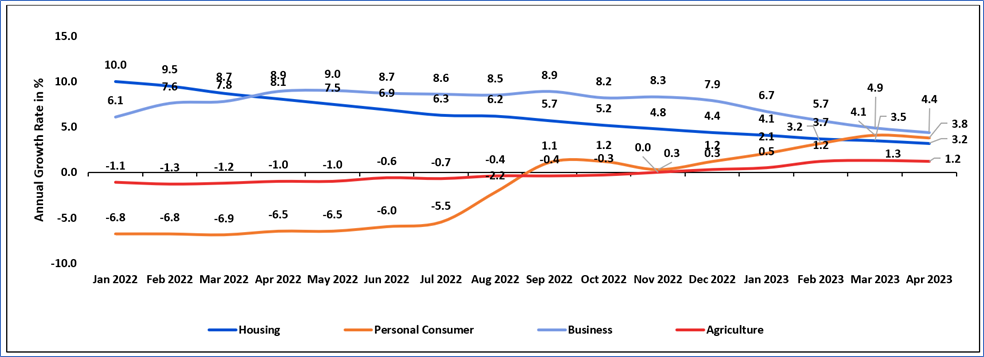
Data Source: This work is based on/includes rbnz data which are licensed by rbnz.govt.nz for reuse under the Creative Commons Attribution 4.0 International Licence; Chart Created by Kalkine Group
Rise in Official Cash Rate
On 24th May 2023, the Monetary Policy Committee increased the OCR from 5.25% to 5.5%. Notably, economic activity in NZ fell at the end of 2022. High interest rates, lower house prices as well as higher cost of living are slowing demand. Increased interest rates have made mortgages more expensive for households, reducing the amount they have available to spend on other things. House prices witnessed a decline, reducing spending by homeowners. Higher interest rates encourage people to save more, reducing spending today.
RBNZ stated that, although the demand is slowing, there are numerous factors that continue to support demand as well as inflation. The rapid recovery in overseas visitor numbers since the border reopened has boosted demand. However, due to capacity constraints, businesses struggled to meet the robust demand over summer, leading to inflationary pressure.
Managed Funds Survey – Q1 2023
As per RBNZ, the total value of funds under management rose to $262.9 Bn (or +5.1%) for the quarter ending 31st March 2023 and 2.1% annually. Kiwisaver recorded quarterly as well as annual growth, going up 5.9% and 5.2% respectively. Other Superannuation schemes fell 4.9% q/q and 13.4% annually. The fund holdings by asset class recorded the quarterly increase of 16.2% in long-term debt securities. Short term debt securities were down 16.5% q/q. Notably, funds held by wholesale clients witnessed the large increase from last quarter, rising by 13.3% from $22.3 Bn to $25.2 Bn.
Cash management trusts rose by 2.1% this quarter, from $19.5 Bn to $19.9 Bn. The value of funds in retail unit trusts rose q/q by 3.9% to $56.1 Bn. Private wealth funds rose 3.0% for the quarter, from $38.5 Bn to $39.7 Bn.
Settlement of Climate Claims
NZ’s major financial market infrastructures are exhibiting high availability as well as resilience, with no significant incidents recorded in recent months. The insurance sector is profitable and its solvency ratios are stable. However, some insurers were adversely affected by severe weather events and investment losses.
As per Insurance Council of New Zealand and in the release dated 4th April 2023, combined claims for the Auckland Anniversary Weekend flooding and Cyclone Gabrielle stood at 96,586 claims worth $2.47 Bn. Insurers have so far paid out over 14,124, 15%, of claims. On 1st April, insurers had put $395 Mn back into communities. For Cyclone Gabrielle, 6,819 claims out of 44,650 (or 15.3%) have been settled with pay-outs totalling just over $147 Mn out of an estimated $1.155 billion (or 12.7%).
Exhibit 2: Trend in Insurance Companies in NZ ($million)
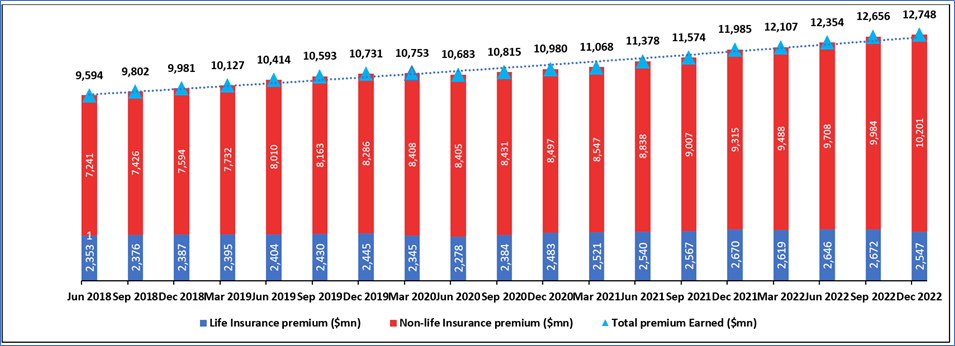
Data Source: This work is based on/includes rbnz data which are licensed by rbnz.govt.nz for reuse under the Creative Commons Attribution 4.0 International Licence; Chart Analysis by Kalkine Group
Index Performance:
The S&P/NZX All Financials Index generated a YTD return of ~2.35% versus ~0.96% by the S&P/NZX All Index. Therefore, S&P/NZX All Financials Index overperformed S&P/NZX All Index by ~1.39% on the YTD basis.
Exhibit 3: S&P/NZX All Financials Index vs S&P/NZX All Index
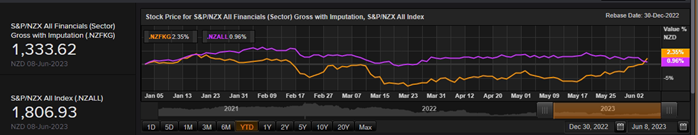
Source: REFINITIV
Key Risks and Challenges:
The factors impacting the financial market are primarily driven by elevated inflation, higher interest-rate policy, a strong dollar and the disruptions caused by the geopolitical tensions. Meanwhile, the Monetary Policy Committee of NZ increased the Official Cash Rate (OCR) to fight against elevated inflation. RBNZ stated that high interest rates are still required to meet the inflation as well as employment objectives
Exhibit 4. Key Risks in Financial Sector:
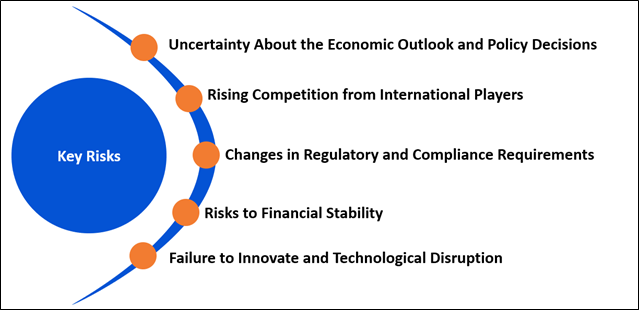
Source: Analysis by Kalkine Group
Outlook:
New Zealand’s banking system is well placed to handle domestic as well as international pressures. New Zealand banks’ profitability was robust in recent quarters, with the pick-up in net interest margins (NIMs) supporting the return of most profitability metrics to around pre-pandemic levels.
Overall, NZ’s banking system is resilient to the wide range of downturn scenarios, as demonstrated in the regular stress tests of their solvency as well as liquidity positions. NZ banks have well-developed approaches to managing and mitigating interest rate risk. Therefore, they are not generally exposed to the problems that have emerged in some overseas banking systems in recent months. Also, the financial system is well positioned to support the economy as debt servicing strains increase.
Even though demand is slowing, there are several factors that are supporting demand as well as inflation. The border reopening also contributed to high net immigration, providing relief for some businesses short of labour. Notably, bottlenecks in global supply chains continued to ease, mainly because of the reopening of China. Shipping costs for imports into NZ declined sharply over recent months. Global commodity prices – in particularly prices – remained below their early-2022 peaks. The disruptions to trade because of Russia invading Ukraine have largely unwound. Several commodity prices are close to their levels prior to the war in Ukraine.
Additional labour supply is coming from higher labour force participation and higher net immigration since the border fully reopened in H2 of last year.
The combination of weaker demand as well as improved supply reduced inflation in NZ. Annual consumers price inflation declined from 7.2% in the December 2022 quarter to 6.7% in the March 2023 quarter. Also, prices for some goods and services that change a lot — like petrol prices and airfares — have declined.
Inflationary pressure is supported by the tight labour market, with employment above its maximum sustainable level. The unemployment rate remained very low at 3.4% in the quarter ended March 2023. Although most indicators reflect that labour market pressures have eased since last year, they are strong.
Apart from the sector-specific factors, an analysis on two NZX-listed companies is provided. This report covers their insights, outlook, performance and potential as expected to be delivered in the near to medium term.
1 ) Barramundi Limited (Recommendation: Buy, Potential Upside: Low Double-Digit) (M-Cap: NZD 189.07 Mn, Annual Dividend Yield (TTM)1: 8.03 %)
Company Overview: Barramundi Limited (NZX: BRM) is a listed investment company that invests in growing Australian companies.
Outlook
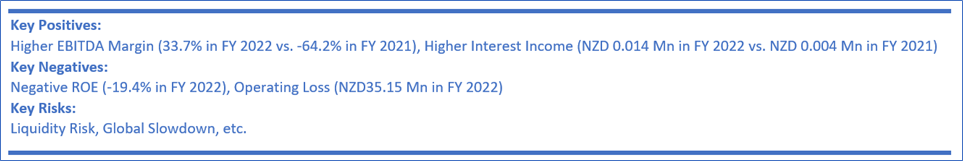
BRM’s portfolio companies have adapted well to the challenging post-pandemic economic environment. In particular, BRM witnessed that number of them are offsetting inflationary pressures by increasing prices of goods or services. They have also found solutions to pandemic-related supply chain bottlenecks.
Technical Overview
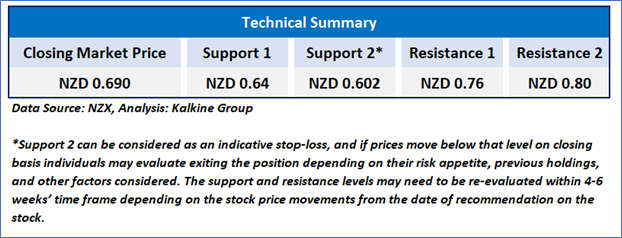
On the daily chart, BRM prices are trading near the falling trendline support zone. Moreover, the momentum oscillator RSI (14-period) is showing a reading of ~44.432 level. However, the prices are trading below the trend-following indicators 21-period SMA, which may act as a resistance zone. An important support level for the stock is placed at NZD 0.64 while the key resistance level is placed at NZD 0.76.
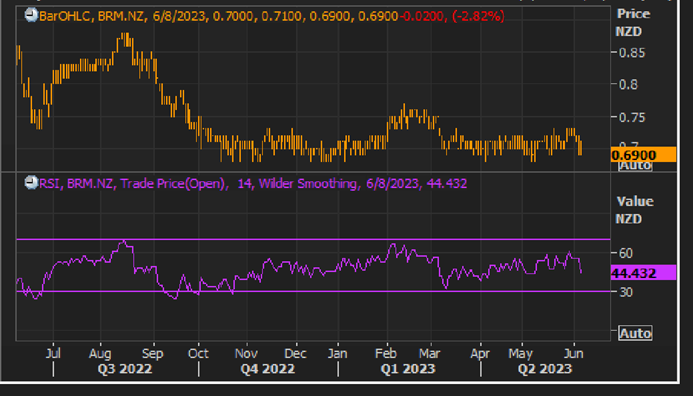
BRM Daily Technical Chart, Data Source: REFINITIV
Stock Recommendation
Considering the facts above, a ‘Buy’ recommendation on the stock has been provided at the closing market price of NZD 0.690 per share, down by 2.82% as on 8 June 2023.
2 ) Westpac Banking Corporation (Recommendation: Buy, Potential Upside: Low Double-Digit) (M-Cap: NZD 77.7 Bn, Annual Dividend Yield (TTM)1: 7.19%)
Company Overview: Westpac Banking Corporation (NZX: WBC) is an Australian multinational banking and financial services company.
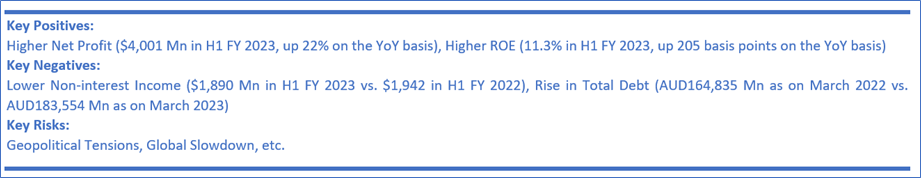
Outlook:
WBC is in the robust financial position which provides flexibility. It is focusing towards disciplined growth as well as cost reset. At the time of H1 FY 2023 result, it was mentioned that, at the macro level, WBC’s loan portfolios remain healthy. Most mortgage customers are ahead on the repayments. Offset balances were little changed as well as mortgage delinquency levels are low. Its balance sheet is set for the tougher outlook. It has the flexibility to support growth and handle the more challenging conditions.
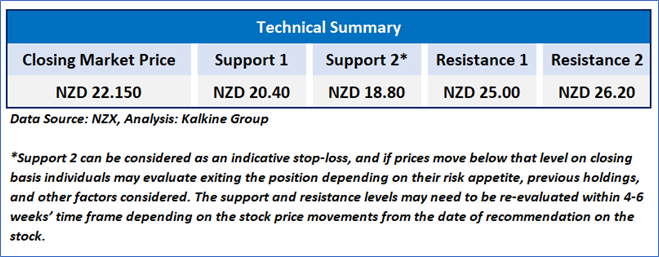
Technical Overview:
On the daily chart, WBC prices are hovering above the horizontal trendline support zone. Moreover, the momentum oscillator RSI (14-period) is showing a reading of ~39.606 level. However, the prices are trading below the trend-following indicators 21-period SMA, which may act as a resistance zone. An important support level for the stock is placed at NZD20.4 while the key resistance level is placed at NZD25.00
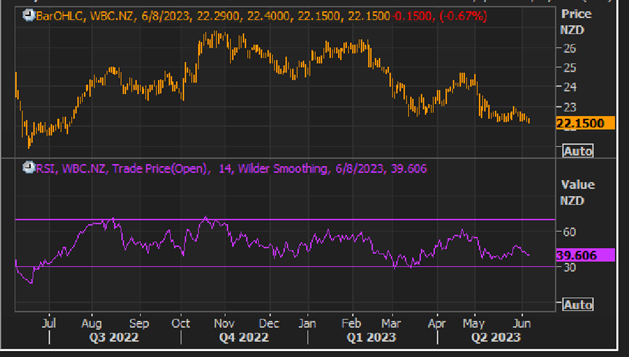
WBC Daily Technical Chart, Data Source: REFINITIV
Fundamental Valuation:
Price/BVPS Based Relative Valuation
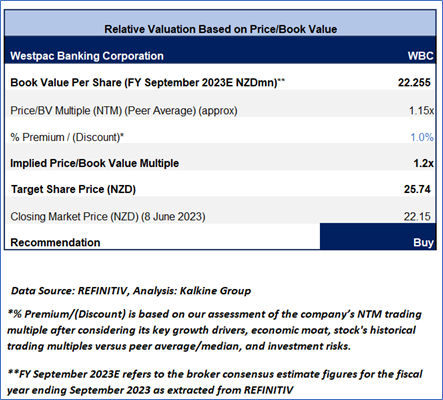
Stock Recommendation
Considering the facts above as well as expected upside, a ‘Buy’ recommendation on the stock has been provided at the closing market price of NZD 22.15 per share, down by 0.67% as on 8 June 2023.
Markets are trading in a highly volatile zone currently due to certain macro-economic issues and geopolitical tensions prevailing. Therefore, it is prudent to follow a cautious approach while investing.
Note 1: Past performance is neither an indicator nor a guarantee of future performance.
Note 2: The reference data in this report has been partly sourced from REFINITIV.
Note 3: Investment decisions should be made depending on an individual's appetite for upside potential, risks, holding duration, and any previous holdings. An 'Exit' from the stock can be considered if the Target Price mentioned as per the Valuation and or the technical levels provided has been achieved and is subject to the factors discussed above.
Note 4: Annual Dividend Yield is on a Trailing Twelve Month (TTM1) basis and are subject to change based on factors such as company performance, stock price changes, etc.
Technical Indicators Defined: -
Support: A level at which the stock prices tend to find support if they are falling, and a downtrend may take a pause backed by demand or buying interest. Support 1 refers to the nearby support level for the stock and if the price breaches the level, then Support 2 may act as the crucial support level for the stock.
Resistance: A level at which the stock prices tend to find resistance when they are rising, and an uptrend may take a pause due to profit booking or selling interest. Resistance 1 refers to the nearby resistance level for the stock and if the price surpasses the level, then Resistance 2 may act as the crucial resistance level for the stock.
Stop-loss: It is a level to protect further losses in case of unfavourable movement in the stock prices.
Disclaimer
Kalkine New Zealand Limited is a Financial Advice Provider (“FAP”) and is authorised by a Class 1 Financial Advice Provider Licence issued by Financial Markets Authority (“FMA”) to provide financial advice. Kalkine provides only general financial advice through its research reports following a person becoming a member. The reports contain buy/sell/hold and other recommendations in relation to equity financial products. The recommendations and opinions [on this website] / [in this report] do not take into account any of your investment objectives, financial situation or needs. Before you make a decision about whether to acquire a financial product, you should obtain the Product Disclosure Statement from the product issuer. You should consider the appropriateness of advice taking into account your own objectives, financial situation and needs and seek independent financial advice before making any financial decisions. If you act on the advice in the research reports, you may have to pay fees, expenses or other amounts (but not to Kalkine). Further information about the complaints and dispute resolution process, as well as information about Kalkine’s duties are available on Kalkine’s website. Please read our Financial Advice Provider (FAP) disclosure statement and Complaints Handling Guide, which are available on the website.
Past performance is not a reliable indicator of future performance.
 Please wait processing your request...