
I. Sector Landscape and Outlook
As per the Ministry of Primary Industries, the food and fibre sector reported strong performance in FY21 despite the impact of COVID-19. The ministry anticipates that the export revenue for the year ending June 2021 to decrease 1.1% to $47.5 billion. However, for FY22, export revenue is expected to rebound and reach $49.1 billion, driven by strong demand for main export market products from destination markets.
Exhibit 1: Trend in Food and Fibre Sector Export Revenue 2017-25 – (As a Percentage of Total Export Revenue)
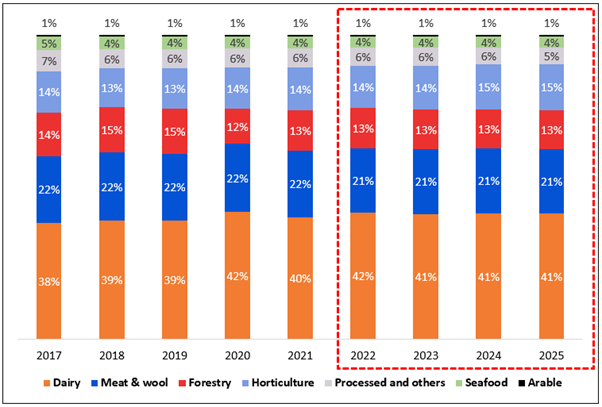
Data Source: mbie.govt.nz, Chart Created by Kalkine Group
The Food Price Index Grew Marginally in May 2021
Food prices grew 0.4% in May 2021, whereby meat, poultry, and fish prices increased 0.5%, followed by grocery food prices that increased 0.1% (up 0.4% post seasonal adjustment). Further, non-alcoholic beverage prices grew 1.3% and restaurant meals and ready-to-eat food prices increased 0.4%. However, fruit and vegetable prices decreased 0.1% (down 0.3% post seasonal adjustment).
Meanwhile, the food prices grew 1.8% in the year ended May 2021, where fruit and vegetable prices grew 4.1%, followed by meat, poultry, and fish prices that grew 0.2%. In addition, non-alcoholic beverage prices increased 0.3%, followed by restaurant meals and ready-to-eat food prices that grew 4.4%. However, grocery food prices fell 0.1%.
Exhibit 2: Monthly Index Points Contribution to Food Price Index
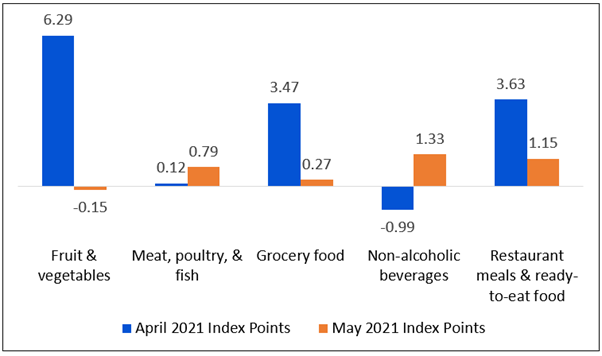
Data Source: stats.govt.nz, Chart Created by Kalkine Group
Dairy Export Continuers to Contribute the Most to Food and Fibre Sector Export Revenue
As per the Ministry of Primary Industry, the milk production in FY21 season is expected to grow 1.9% to 1,933 million kilograms of milk-solids, primarily led by favourable weather conditions and a strong farmgate milk price. However, the dairy export revenues are expected to decrease by 5.4% to ~$19 billion in FY21, mainly led by the COVID-19 related disruptions, a stronger NZD, and lower global prices during H1FY21 of the season. Despite global supply chain and market turbulence and fluctuation in prices of key commodities, global dairy prices surged significantly in H2FY21 of the season, compensating for some of the early lower seasons. Importantly, the all-company average farmgate pay-out projection surged to $7.63 for FY21, as commodity prices improved in the H2FY21 of the season, bettering on-farm profitability.
Exhibit 3: Stable Trend in Dairy Export Revenue as a Percentage of Food and Fibre Sector Export Revenue
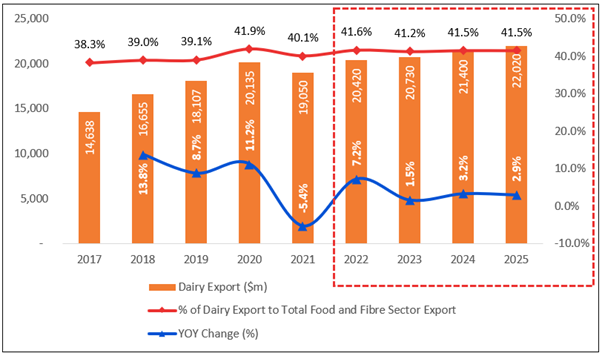
Data Source: mpi.govt.nz, Chart Created by Kalkine Group
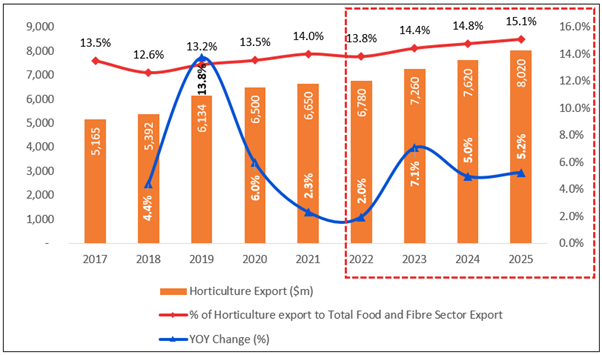
Horticulture Export Revenue is Expected to Increase 2.3% to $6.7 billion in FY21
As per the Ministry of Primary Industry, horticulture export revenue for FY21 is expected to grow 2.3% to $6.6 billion, primarily led by larger crops of kiwifruit and avocados. However, these estimates have been revised down for FY21 and FY22 due to adverse climatic conditions between September and December 2020 impacting yields of fruit and wine grape crops in the South Island in 2021. A stronger NZD volatility affecting export prices, and the forecast of seasonal labour supply disruption due to the COVID-19 pandemic and logistics disruption will extend into 2022.
Exhibit 4: Upward Trend in Horticulture Export Revenue as a Percentage of Food and Fibre Sector Export Revenue
Data Source: mpi.govt.nz, Chart Created by Kalkine Group
Global Retail Market for Honey is Forecast to Reach USD 11 billion in 2025
New Zealand honey is primarily exported in retail-ready jars and bulk drums and monofloral mānuka honey contributes a larger proportion to the global honey market. Meanwhile, the United States continues to be the largest importer of New Zealand monofloral mānuka by value, followed by China being the largest importer of multifloral manuka and non-mānuka honey. Importantly, honey export volume grew by 40% (3.6 tonnes) in FY21 over the last year, where the average export unit price for the year to March 2021 was $40.01/kg, (monofloral manuka: $53.13, multifloral manuka: $31.33, and non-mānuka: $19.23).
Moreover, the global retail market for honey is expected to grow by USD 2.1 billion to reach USD 11 billion by 2025. Currently, the New Zealand retail market for honey is ~NZD 60.3 million. However, forecasted future growth in this market is anticipated to be limited, with an increase of only NZD 1 million by 2025.
Exhibit 5: New Zealand’s Top Export Destinations by Export Volume (tonnes) 2021
.png)
Data Source: mpi.govt.nz, Chart Created by Kalkine Group
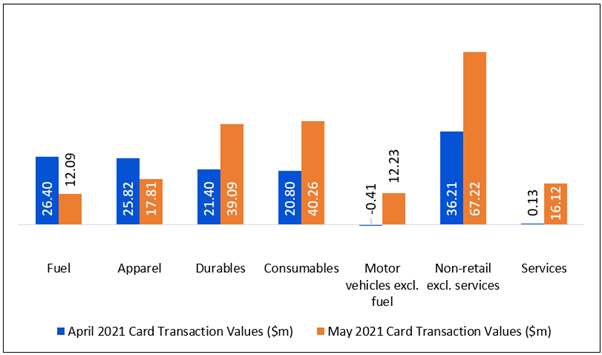
A rise in Consumer Spending, Indicated by Rising Card Transactions
As per stats.govt.nz, for the month ended May 2021, spending in the retail industries increased 1.7% MOM, and spending in the core retail industries increased 1.8% MOM. In the consumables sphere, spending on specialized food increased by the double-digit that is 26% (up $46 million), followed by a 1.5% rise in liquor (up $2.5 million), while spending in supermarket and grocery stores fell by 4.4% (down $86 million).
Exhibit 6: Trend in Seasonally Adjusted Card Transaction Value by Industry ($m)
Data Source: stats.govt.nz, Chart Created by Kalkine Group
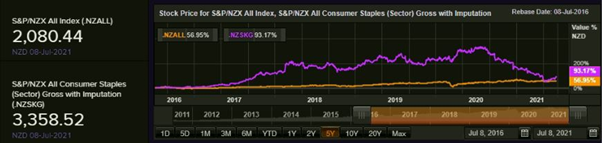
Index Performance:
The S&P/NZX All Consumer Staples Index generated a 5-years return of ~93.17% versus ~56.95% by the S&P/NZX All Index. Therefore, S&P/NZX All Consumer Staples Index overperformed S&P/NZX All Index by a whooping ~36.22% in the past 5-year.
Exhibit 7: S&P/NZX All Consumer Staples Index vs S&P/NZX All Index
Source: REFINITIV
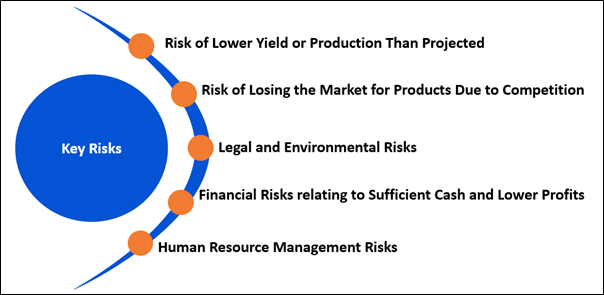
Key Risks and Challenges:
New Zealand’s strong economic performance in recent months has led to appreciation in its currency NZ$ which has affected its export competitiveness. Besides, fluctuations in dairy products price and their productions too could lead to reduced exports of primary products. Dairy production is impacted by natural disasters, poor transport, and infrastructure, among other factors. Further, tax management is critical for dairy farmers. The blend of fluctuating revenue and the risk associated with falling debt in a good season and on the other side with a tax bill in the low period when revenues are lower means that careful planning is important. Meanwhile, operating costs are at an elevated level when increased farm-scale has not led to a rise in operating efficiency.
As per the Ministry of Health, research has shown that New Zealand has drinking habits that accept intoxication as a norm. As per the surveys of drinking patterns, it has been identified that young people drink in much the same way as adults do. Further, the Ministry of Economic Development presented the challenges faced by the wine industry which include rising excise duties, increased competition, oversupply, rising indebtedness, and low crop yields. These elements are causing the sector to become unprofitable, and in some cases, unviable.
As per the survey completed by New Zealand's beekeepers, it was sported that the overall loss rate for winter 2020 is forecasted to be 11.3%. These loss rates imply that New Zealand lost ~99,150 colonies over winter 2020. Further, it was highlighted that smaller operator posted higher losses (as a share) than commercial beekeepers. The causes to which beekeepers assign losses are in line with last year, although losses due to suspected varroa are up 3% over winter 2019. However, Queen problems accounted for the most losses.
Exhibit 8. Key Risks in Consumer Staples Sector:
Sources: Analysis by Kalkine Group
Outlook:
As per the Ministry, the Indo-Pacific region will be the focused region globally to New Zealand’s prosperity in coming years. Exports to AANZFTA nations are ~$5 billion annually that contributes almost 10% of total goods exports.
The government is planning to provide additional support to spur export that includes:
As per the Ministry of Primary Industries, for the year ending June 2022, export revenue is expected to rebound and attain ~$49.1 billion driven by strong demand for export products by global markets. In addition, the labour supply situation is anticipated to better as more skilled and seasonal food and fibre sector workers enter New Zealand, or recruited from within New Zealand in the future, and the expectation that COVID-19 supply chain disruptions are eventually resolved.
Apart from the sector-specific factors, we have also analysed four NZX-listed companies operating in the same sector. This report covers their insights, outlook, performance and potential as expected to be delivered in the near to medium term.
1) Fonterra Co-operative Group Limited (Recommendation: Buy, Potential Upside: Low Double-Digit) (M-Cap: NZ$5.89 billion, Gross Dividend Yield: 2.747%)
Business Description:
Fonterra Co-operative Group Limited (NZX: FCG) is a New Zealand-based, farmer-owned dairy co-operative company. The dairy ingredients are sold under NZMP brand. The company also manufactures, markets, and distributes consumer products.
Outlook:
For the H2FY21, the company expects Farmgate Milk Price in the ambit of $7.30-$7.90 per kgMS and normalized earnings in the range of 25-35 cents per share (cps). A mid-point price of $7.60 per kgMS, would contribute over $11.5 billion to the New Zealand economy. The product of the company is stapled in people’s diets around the world and demand is strong. However, the rising raw milk prices in H1FY21, which is continuing in H2FY21, is putting a lot of pressure on sales margins and this will be seen through the second half of the year.
Technical Overview:
Weekly Chart –
Source: REFINITIV
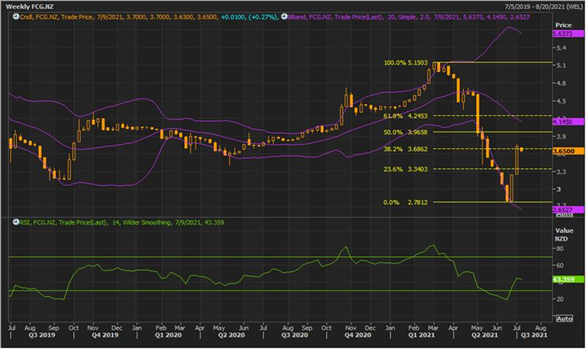
Note: Purple colour lines are Bollinger Bands® with the upper band suggesting overbought status while the lower band oversold status, and yellow lines are Fibonacci retracement lines which measure price rebound and backtrack. https://www.bollingerbands.com/
After two consecutive weeks of a rebound in prices, the stock has given a softer close for the ongoing week while experiencing low volatility. The close is not even 25% of the bull candle of the previous week which means bullish sentiment on the stock is still intact. The technical indicator RSI with a reading around 43 suggests neutral momentum for the stock.
Going forward, the stock may have resistance around 20 periods SMA of $4.15 whereas support could be around the 23.6% retracement level of $3.34.
Stock Recommendation
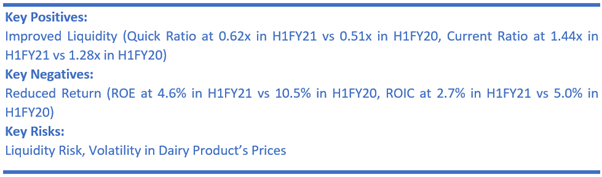
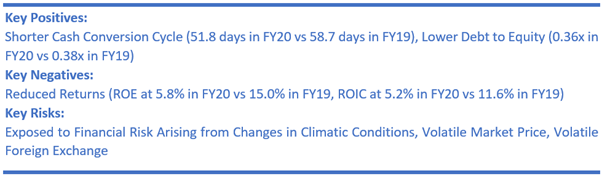
The company’s Asset Turnover for H1FY21 reported at 0.51x, over and above the industry median of 0.48x, implying that the company is more efficient in generating revenue from its assets over its peers in the industry. Looking at the past performance, FCG’s top-line over FY17-20 increased with a compounded annual growth rate (CAGR) of ~1.79%.
Considering the aforesaid facts, we give a “Buy” recommendation on the stock at the current market price of $3.65 per share, up 0.27% on 8th July 2021.
2) Marlborough Wine Estates Group Limited (Recommendation: Speculative Buy, Potential Upside: Low Double-Digit) (M-Cap: NZ$86.12 million)
Business Description:
Marlborough Wine Estates Group Limited (NZX: MWE) is one of the producers of New Zealand’s finest Awatere Valley (Marlborough) Sauvignon Blancs. It targets the premium end of the white wine market.
Outlook
The company has successfully completed the 2021 harvest, which is unexpectedly lower than expected, primarily due to the unseasonal cool weather period in Marlborough during flowering in late November and early December 2020. The 2021 harvest is lower ~26% on the 2020 vintage's record harvest and ~20% on average expected tonnes. This decline will impact the volume of grapes and bulk wine available for customers, accordingly, impacting profitability in this financial year. However, there is upward pressure on grape pricing this year, and MWE anticipates achieving a higher price per tonne based on an increase in average pricing, which may partially offset some expected revenue loss.
Technical Overview:
Weekly Chart –
Source: REFINITIV
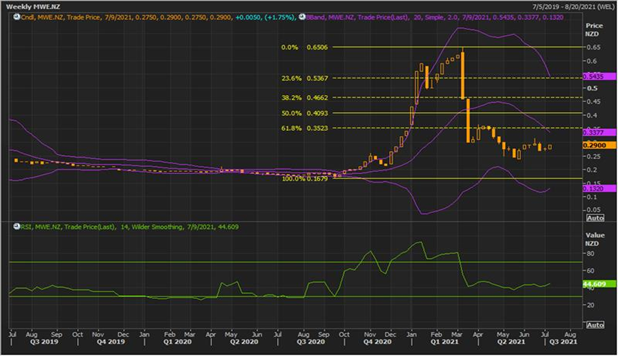
Note: Purple colour lines are Bollinger Bands® with the upper band suggesting overbought status while the lower band oversold status, and yellow lines are Fibonacci retracement lines which measure price rebound and backtrack. https://www.bollingerbands.com/
The stock in the previous week formed a ‘Bullish Harami Cross’ which was towards confirmation of bullish trend reversal from the existing downtrend. In line with the chart pattern, the stock gave a higher close for the ongoing week at its peak price of $0.29. The technical indicator RSI with a reading around 45 and a curve at the end pointing up, suggests gaining of bullish momentum for the stock.
Going forward, the stock may have resistance around the 61.8% retracement level of $0.35 whereas support could be around $0.25.
Stock Recommendation
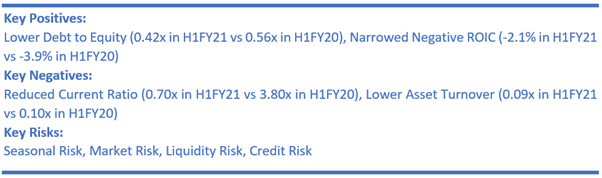
Considering the aforesaid facts, we give a “Speculative Buy” recommendation on the stock at the current market price of $0.29, up 1.75% per share on 8th July 2021.
3) Scales Corporation Limited (Recommendation: Hold, Potential Upside: Low Double-Digit) (M-Cap: NZ$676.38 million, Gross Dividend Yield: 5.486%)
Business Description:
Scales Corporation Limited (NZX: SCL) has been providing strong support to the New Zealand primary sector for over 100 years. It is a diversified agribusiness, comprising three operating segments: Logistics, Horticulture, and Food Ingredients.
Outlook
Despite the business challenges caused by the COVID-19 pandemic, the company continued to advance with its strategic plan and invest in growth opportunities. Importantly, the company has been looking at opportunities in the wine industry and this continues to be a sector of focus. The company’s board has amended underlying profit guidance to be in the range of $27.5-$33.5 million and underlying EBITDA range of $46.5-$53.5 million for FY21.
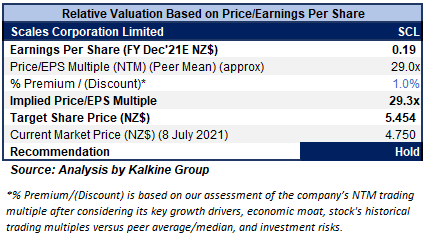
Valuation Methodology: Price/Earnings Per Share Based Relative Valuation (Illustrative)
Stock Recommendation
Considering the aforesaid facts, we have valued the stock using a P/E multiple-based illustrative relative valuation and have arrived at a target price that reflects a rise of low double-digit (in % terms). We believe the company can trade at a slight premium to its peer P/E (NTM Trading multiple) considering a decent outlook as well as a better liquidity position.
For relative valuation, we have taken peers like Sanford Ltd. (SAN.NZ), Delegat Group Ltd. (DGL.NZ), and Synlait Milk Ltd. (SML.NZ).
Considering the aforesaid facts, we give a “Hold” recommendation on the stock at the current market price of $4.75 per share, down 1.25% on 8th July 2021.
4) Comvita Limited (Recommendation: Hold, Potential Upside: Low Double-Digit) (M-Cap: NZ$243.94 million)
Business Description:
Comvita Limited (NZX: CVT) is currently one of the leading players globally in producing Manuka honey. The company has a wide geographical presence across Australia, New Zealand, China, North America, among others.
Outlook
As per the full-year guidance released on 13 April 2021, the company expects operating EBITDA in the ambit of $22.5-$25.5 million in FY21 (earlier guided range of $20-$23 million). The upgrade in earnings is mainly driven by continuing strong growth in its focused growth markets of China and North America that offsets the challenges in ANZ and Hong Kong. Further, the benefits of strong performance in the digital channel, which currently contributes over 30% of CVT sales along with sustained efficiencies in production and better cost management are the reasons for the upgrade.
Moreover, as per the release dated 25 June 2021, the company’s total sales through the shopping festival in China increased +31.0% YOY indicating strong growth in consumer awareness and demand for CVT brand in the market.
Valuation Methodology: Price/Earnings Per Share Based Relative Valuation (Illustrative)

Stock Recommendation
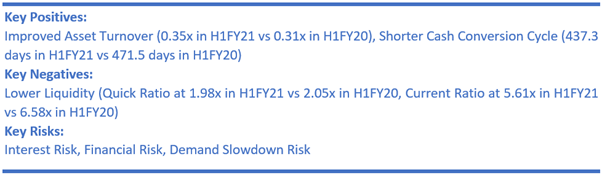
We have valued the stock using P/E multiple-based illustrative relative valuation and have arrived at a target price that reflects a rise of low double-digit (in % terms). We have assigned a slight discount to P/E Multiple (NTM) (Peer Average) considering the challenges in ANZ and Hong Kong market and lower liquidity.
For the purposes of relative valuation, we have taken peers like Sanford Ltd. (SAN.NZ), A2 Milk Company Ltd. (ATM.NZ), and Scales Corporation Ltd. (SCL.NZ).
Considering the aforesaid facts, we give a “Hold” recommendation on the stock at the current market price of $3.47 per share, down 0.86% on 8th July 2021.
Comparative Price Chart
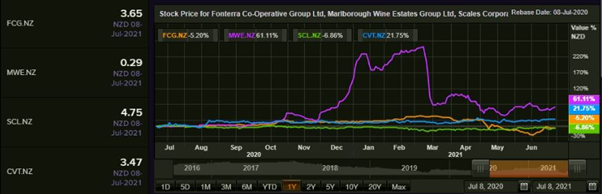
Source: REFINITIV
Note 1: The reference data in this report has been partly sourced from REFINITIV.
Note 2: Investment decisions should be made depending on the investors’ appetite on upside potential, risks, holding duration, and any previous holdings. Investors can consider exiting from the stock if the Target Price mentioned as per the analysis has been achieved and subject to the factors discussed above alongside support levels provided.
Technical Indicators Defined: -
Support: A level where-in the stock prices tend to find support if they are falling, and downtrend may take a pause backed by demand or buying interest.
Resistance: A level where-in the stock prices tend to find resistance when they are rising, and uptrend may take a pause due to profit booking or selling interest.
Disclaimer
Kalkine New Zealand Limited is authorised to provide class advice only. The information on this site does not take into account any of your investment objectives, financial situation or needs. Before you make a decision about whether to acquire a financial product, you should obtain the Product Disclosure Statement from the product issuer. You should consider the appropriateness of advice taking into account your own objectives, financial situation and needs and seek independent financial advice before making any financial decisions.
Past performance is not a reliable indicator of future performance.
 Please wait processing your request...