
1. Sector Landscape and Outlook
According to the Reserve Bank of New Zealand, the elevated inflationary pressure is pushing central banks to formulate tighter monetary policy more aggressively. Further, the financial markets have been highly volatile due to a need for clarity on the quantum of economic growth due to tighter monetary policy. As a result of this, financial stability risks have increased. However, NZ financial system is well-placed to support the rising demand for credit. Banks’ capital and liquidity positions are solid, and profitability and asset quality are comfortable.
Annual Growth Rate Turned Positive in Personal Consumer Lending in September 2022
RBNZ's total personal consumer lending stock grew by $88 million (1.3% break adjusted) in September 2022, reflecting an annual growth rate movement from -2.2% to 1.1%, the very first positive rate performance since December 2019. Further, the total housing lending stock grew by $950 million (0.3%) in September 2022, while the annual growth decreased to 5.7%, sliding further from 6.2% in August 2022, the 14th month of sluggish yearly growth. Meanwhile, the total business lending stock grew by $1.6 billion (1.2% break adjusted) in September 2022, which increased by $776 million (0.6%) last month. Annual growth grew from 8.5% to 8.9%, near the peak realized in May 2022 (9%).
Exhibit 1: Lending Pattern Since March 2020 – Banks and NBLIs
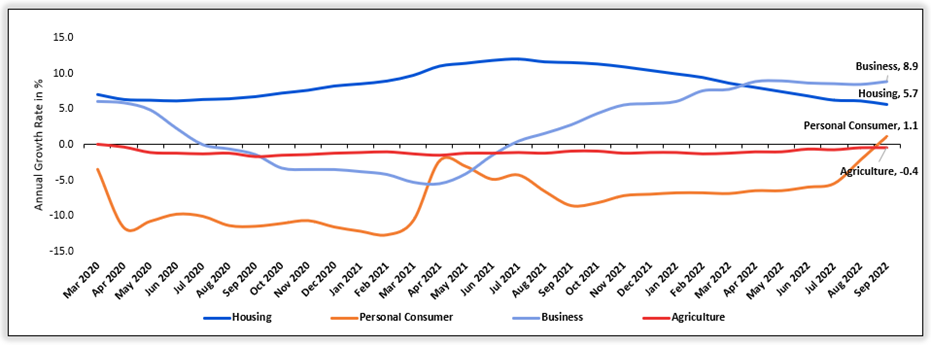
Data Source: This work is based on/includes rbnz data which are licensed by rbnz.govt.nz for reuse under the Creative Commons Attribution 4.0 International Licence; Chart Created by Kalkine Group
Stress Testing Indicates Solid Position of Banks
As per RBNZ, the aggregate capital ratios decreased materially but were well above regulatory minimum levels, despite considering the scheduled rise in the minimum requirements. The stress test results also indicated sufficient capital to facilitate economic lending before mitigating actions are formulated, like raising additional capital or slashing customers’ credit limits. Overall, the banking system’s funding status remained resilient, with the average core funding ratio hovering at ~90%, much above the minimum 75% requirement.
Decent Bank Profitability Supporting Credit Market
As per RBNZ, the banks’ earnings have regained strength during the past year, following the sluggish performance in the pandemic period. Currently, the NIMs of Banks are hovering around historical averages, with a marginal uptrend in the past year. Accordingly, the deposit rates have grown in the past year by less than wholesale interest rates, driven by the elevated proportion of deposits in low-zero interest rate on-call accounts versus term accounts. This partly indicates that margins on mortgage lending compared with wholesale rates have been reduced in the past year versus historical levels.
General Insurer Continue to Contribute Most to Insurance Sector
As per RBNZ, the general insurers are the most significant contributor to NZ’s insurance sector, with ~61% of total gross premium revenues, while life insurers contribute ~25% and health insurers ~14%. The solvency capital ratio of the general insurance sector continues to fall from its peak in March 2021. However, it remained above the level seen before the COVID-19 pandemic. For general insurers, the solvency ratio was reported at 209% for the year to March 2021, while it was reported at 174% for the year to March 2021 because, in 2021, the general insurers ceased paying dividends and retained capital. In line with this, profit margin stood at 14.9% for year to March 2021, while at 12.5% for year to March 2022, primarily due to competitive pricing pressures and the frequency of natural disasters in 2022.
Exhibit 2: Trend in Insurer Revenue in NZ ($million)
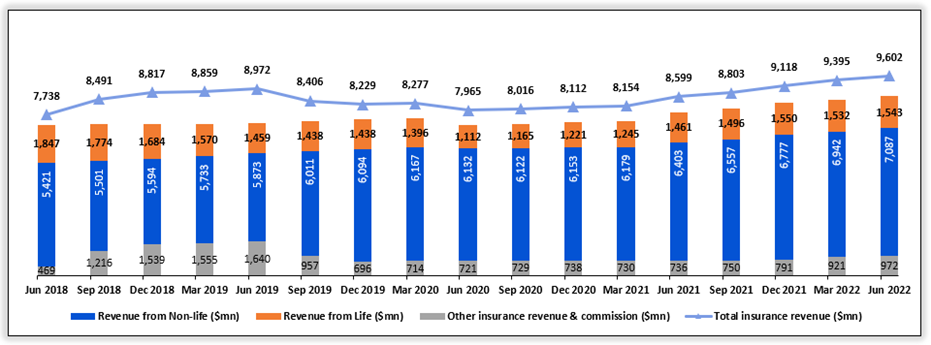
Data Source: This work is based on/includes rbnz data which are licensed by rbnz.govt.nz for reuse under the Creative Commons Attribution 4.0 International Licence; Chart Analysis by Kalkine Group
Index Performance:
The S&P/NZX All Financials Index generated a 2-year return of ~12.22% versus ~-12.06% by the S&P/NZX 50 Index. Therefore, S&P/NZX All Financials Index overperformed S&P/NZX 50 Index by ~24.28% in 2-year.
Exhibit 3: S&P/NZX All Financials Index vs S&P/NZX 50 Index
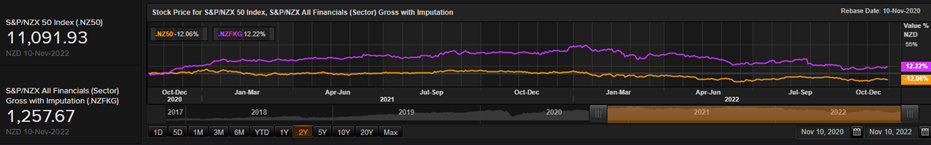
Source: REFINITIV
Key Risks and Challenges:
Elevated inflation, higher interest-rate, a strong dollar and supply chain disruptions due to the Ukraine-Russia war, among other factors, are impacting the normal financial condition of the economy. Further, house prices in NZ continue to fall as mortgage rates increase. In NZ, house prices are down ~11% from their November 2021 peak, with a more significant decline in Wellington and Auckland. Cyber-attacks have increased internationally, so the importance of digital technologies for protecting banking operations is increasing.
Exhibit 4. Key Risks in Financial Sector:
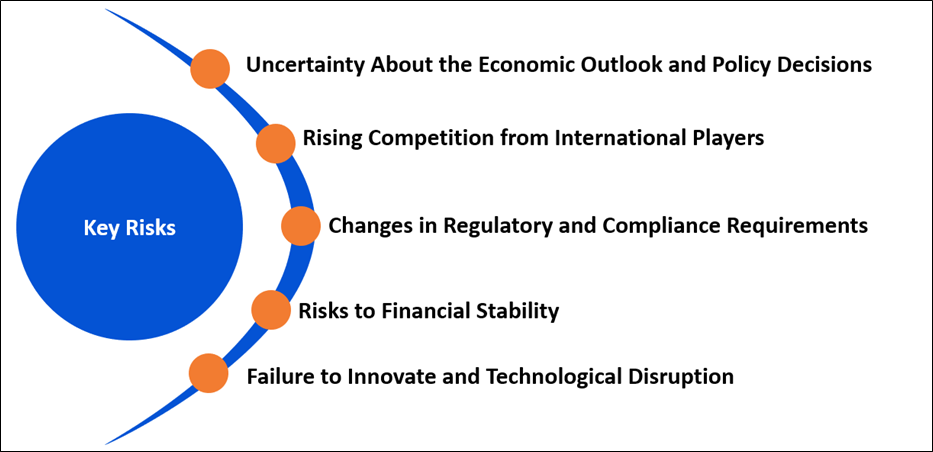
Source: Analysis by Kalkine Group
Outlook:
China’s development story is expected to drive NZ growth momentum as China is NZ’s second-largest trading partner. Any significant spillovers from economic growth lines and financial risks in China could impact the trade balance of NZ. On the positive front, the lending provided by nonbank institutions that are not permitted to take deposits has grown much more swiftly than lending by registered banks and NBDTs. The non-deposit-taking sector is highly diverse, with various modern operating structures and business strategies. The strong lending growth indicates several factors: more flexible access to funding versus deposit-funded entities, robust monetary conditions, and minimum regulatory compliance. Non-deposit takers also have more flexible lending policies over banks, making them better placed to offer new terms to typical borrowers.
Apart from the sector-specific factors, an analysis on three NZX-listed companies is provided. This report covers their insights, outlook, performance and potential as expected to be delivered in the near to medium term.
1) NZX Limited (Recommendation: Buy, Potential Upside: Low Double-Digit) (M-Cap: NZD371.36 million, Annual Dividend Yield (TTM)1: 7.24%)
Business Description:
NZX Limited (NZX: NZX) operates NZ's equity, debt, funds, derivatives, and energy markets.
Outlook
NZX is firmly committed to balancing costs with initiatives which are expected to deliver long-term sustainable growth, including those which could encourage capital flows as well as market liquidity. Its guidance for FY 2022 operating earnings is between $33.5 Mn to $38.0 Mn.
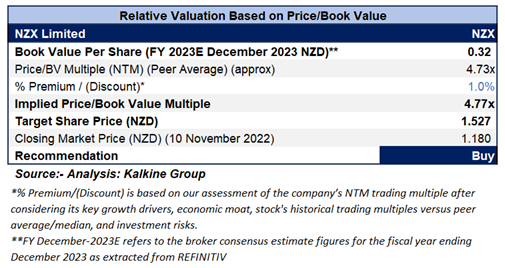
Valuation Methodology: Price/BVPS Multiple Based Relative Valuation (Illustrative)
Technical Overview:
Daily Price Chart
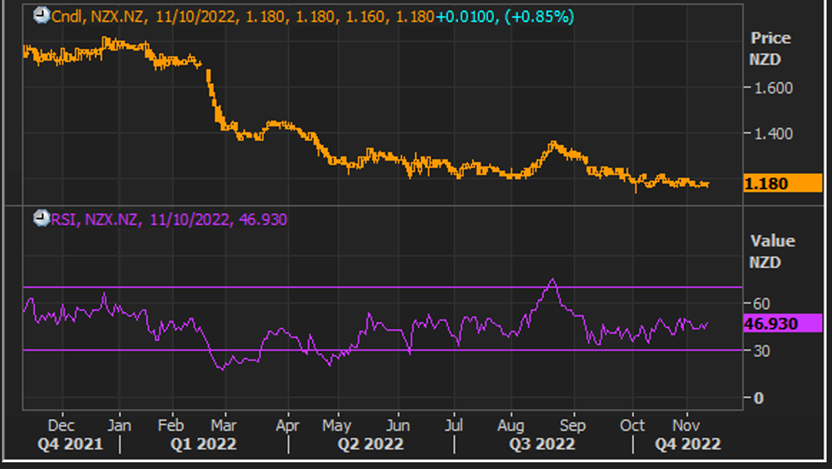
Source: REFINITIV, Note: Purple color line reflects Relative Strength Index (14-Period)
Stock Recommendation
The stock has been valued using Price/BVPS multiple-based illustrative relative valuation, and the target price so arrived reflects a rise of low-double-digit (in % terms). A slight premium has been applied to Price/BVPS Multiple (NTM) (Peer Average), considering the decent results for H1 FY 2022 as well as outlook of the company.
Considering the aforementioned factors, a ‘Buy’ recommendation has been assigned on the stock at the closing market price of NZD1.18 per share, up by 0.85% as on 10th November 2022.
2) Heartland Group Holdings Limited (Recommendation: Hold, Potential Upside: Low Double-Digit) (M-Cap: NZD1.23 billion, Annual Dividend Yield (TTM)1: 8.73%)
Business Description:
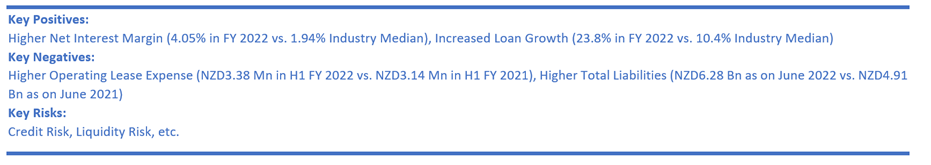
Heartland Group Holdings Limited (NZX: HGH) is a financial services group with operations in New Zealand and Australia.
Outlook
HGH has affirmed the expectation for statutory reported NPAT for FY 2023 to be within the range of NZD109 Mn - NZD114 Mn. Notably, this excludes any impacts of fair value changes on equity investments held as well as the impact of the de-designation of derivatives.
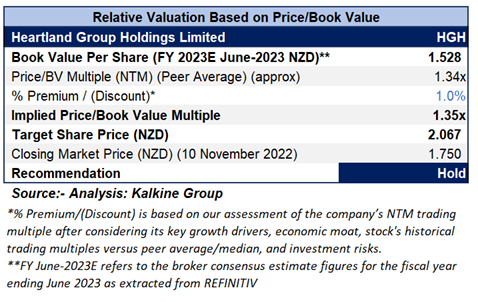
Valuation Methodology: Price/Book Value Per Share Multiple Based Relative Valuation (Illustrative)
Technical Overview:
Daily Price Chart
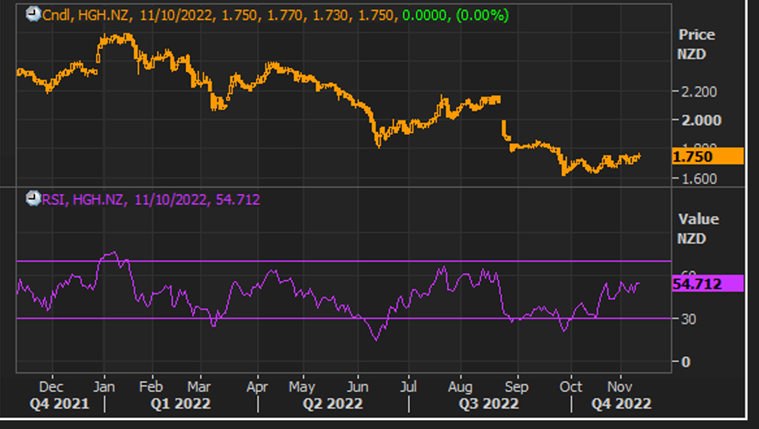
Source: REFINITIV, Note: Purple color line reflects Relative Strength Index (14-Period)
Stock Recommendation:
The stock has been valued using Price/BVPS multiple-based illustrative relative valuation, and the target price so arrived reflects a rise of low-double-digit (in % terms). A slight premium has been applied to Price/BVPS Multiple (NTM) (Peer Average) considering the decent outlook of the company. Also, over FY 2022, HGH has been undertaking a substantial piece of work in order to upgrade the core banking system, requiring substantial deployment towards technology as well as resource to implement.
Considering the aforementioned factors, a ‘Hold’ recommendation has been assigned on the stock at the closing market price of NZD1.750 per share as on 10th November 2022.
3) Tower Limited (Recommendation: Hold, Potential Upside: Low Double-Digit) (M-Cap: NZD252.36 million, Annual Dividend Yield (TTM)1: 7.70%)
Business Description:
Tower Limited (NZX: TWR) is primarily engaged in general insurance. The company operates in New Zealand, with some operations based in the Pacific Islands region.
Outlook
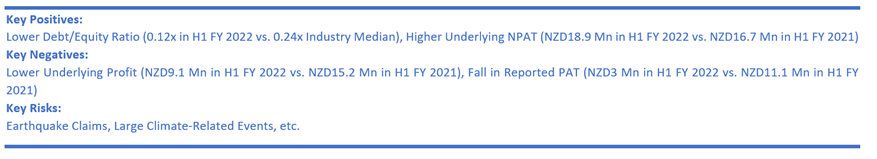
On 23rd November 2022, TWR would be releasing its results for FY 2022. Considering the preliminary as well as unaudited results, TWR is anticipating that underlying net profit after tax (NPAT), including large events, would be ~$26 Mn, up from a range of $21 Mn-$25 Mn. Notably, underlying NPAT excluding large events ($14 Mn after tax) has been anticipated to be ~$40 Mn, above the previously advised range of $35.4 Mn to $39.4 Mn.
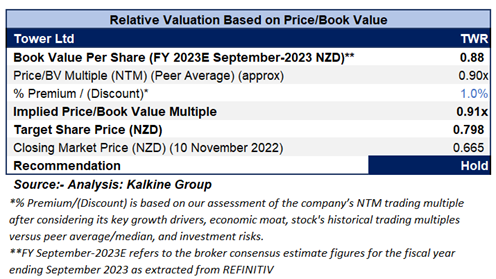
Valuation Methodology: Price/Book Value Per Share Multiple Based Relative Valuation (Illustrative)
Technical Overview:
Daily Price Chart
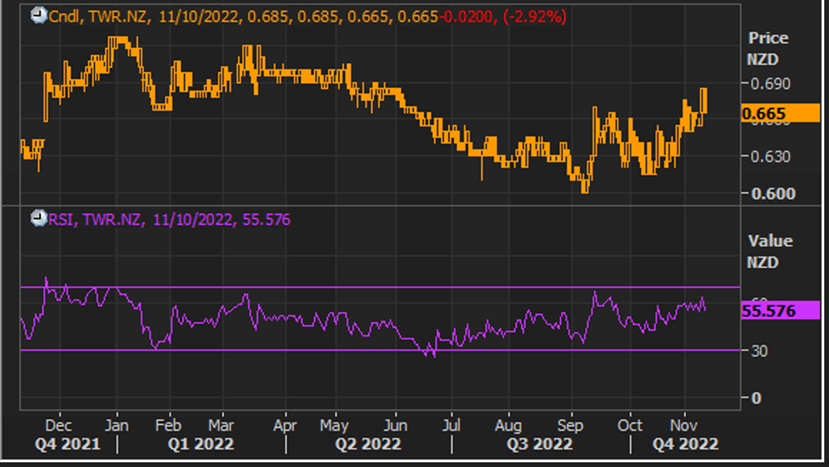
Source: REFINITIV, Note: Purple color line reflects Relative Strength Index (14-Period)
Stock Recommendation
The stock has been valued using Price/BVPS multiple-based illustrative relative valuation, and the target price so arrived reflects a rise of low-double-digit (in % terms). A slight premium has been applied to Price/BVPS Multiple (NTM) (Peer Average), considering the decent outlook as well as increase to underlying NPAT.
Considering the aforementioned factors, a ‘Hold’ recommendation has been assigned on the stock at the closing market price of NZD0.665 per share, down by 2.92% as on 10th November 2022.
Markets are trading in a highly volatile zone currently due to certain macro-economic issues and geopolitical tensions prevailing. Therefore, it is prudent to follow a cautious approach while investing.
Note 1: Past performance is not a reliable indicator of future performance.
Note 2: The reference date for all price data, currency, technical indicators, support, and resistance levels is November 10, 2022. The reference data in this report has been partly sourced from REFINITIV.
Note 3: Investment decisions should be made depending on an individual's appetite for upside potential, risks, holding duration, and any previous holdings. An 'Exit' from the stock can be considered if the Target Price mentioned as per the Valuation and or the technical levels provided has been achieved and is subject to the factors discussed above.
Note 4: Annual Dividend Yield is on a Trailing Twelve Month (TTM1) basis and are subject to change based on factors such as company performance, stock price changes, etc.
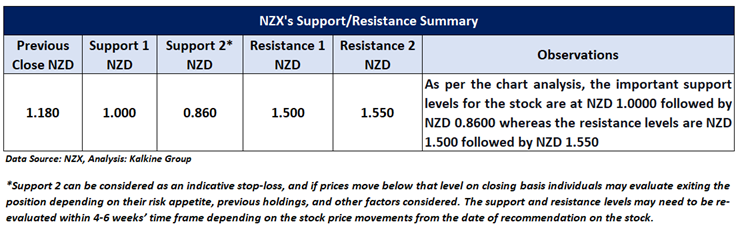
Technical Indicators Defined: -
Support: A level at which the stock prices tend to find support if they are falling, and a downtrend may take a pause backed by demand or buying interest. Support 1 refers to the nearby support level for the stock and if the price breaches the level, then Support 2 may act as the crucial support level for the stock.
Resistance: A level at which the stock prices tend to find resistance when they are rising, and an uptrend may take a pause due to profit booking or selling interest. Resistance 1 refers to the nearby resistance level for the stock and if the price surpasses the level, then Resistance 2 may act as the crucial resistance level for the stock.
Stop-loss: It is a level to protect further losses in case of unfavourable movement in the stock prices.
Disclaimer
Kalkine New Zealand Limited is a Financial Advice Provider (“FAP”) and is authorised by a Transitional FAP license issued by Financial Markets Authority (“FMA”) to provide financial advice. Kalkine provides only general financial advice through its research reports following a person becoming a member. The reports contain buy/sell/hold and other recommendations in relation to equity financial products. The recommendations and opinions [on this website] / [in this report] do not take into account any of your investment objectives, financial situation or needs. Before you make a decision about whether to acquire a financial product, you should obtain the Product Disclosure Statement from the product issuer. You should consider the appropriateness of advice taking into account your own objectives, financial situation and needs and seek independent financial advice before making any financial decisions. If you act on the advice in the research reports, you may have to pay fees, expenses or other amounts (but not to Kalkine). Further information about the complaints and dispute resolution process, as well as information about Kalkine’s duties are available on Kalkine’s website. Please read our Financial Advice Provider (FAP) disclosure statement and Complaints Handling Guide, which are available on the website.
Past performance is not a reliable indicator of future performance.
 Please wait processing your request...