
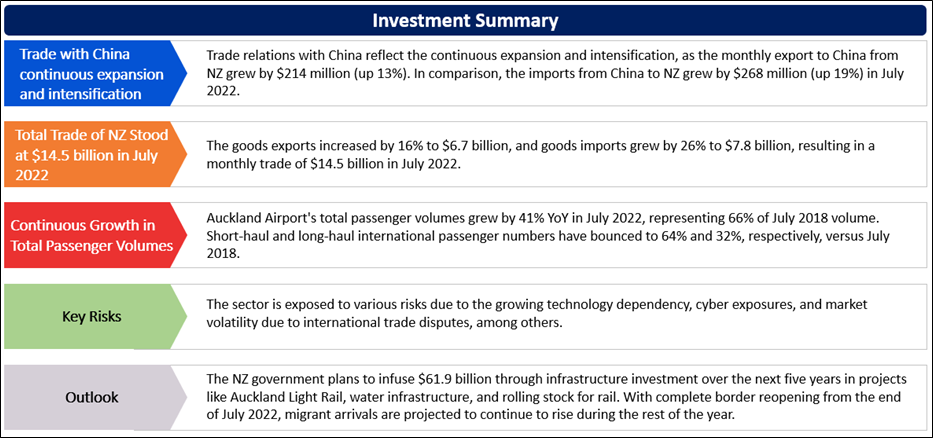
As per the ‘Fortnightly Economic Update’ released by The Treasury, the NZ economy bounced from the weak March quarter to an increase of 1.7% in the June 2022 quarter, while the annual average growth slowed to 1.0%. Real GDP is now at 4.8% above the pre-COVID level. Meanwhile, as all the major balances widened, the annual current account deficit broadened to 7.7% of GDP in the June 2022 quarter. The annual goods deficit broadened to 2.5% of GDP regardless of partial recovery seen in the volume of goods exported and higher NZ commodity prices. Milk powder, butter, and cheese was the most significant contributor to the rise in export in July 2022 month, up $562 million (up 39%) to $2.0 billion, primarily driven by the recovery in the quantity that grew 54%, and the unit value increased 28%. Therefore, some revival is seen in the industrial sector, boosted by the strength in demand for NZ commodities. Also, the rise in air traffic indicates that the business is rebounding from lower level and nearing pre-covid levels.
China Leads the Rise in Monthly Export and Import
As per Stats.NZ, the monthly export to China from NZ grew by $214 million (up 13%) to $1.8 billion in July 2022, mainly driven by an increase in beef, up $100 million (up 66%), and milk powder, butter, and cheese, up $99 million (up 2%). Meanwhile, imports from China to NZ grew by $268 million (up 19%) to $1.7 billion in July 2022, primarily driven by rises in vehicles, parts, and accessories, which grew by $103 million (up 113%).
Exhibit 1: Top Export and Import Partners in July 2022 over July 2021
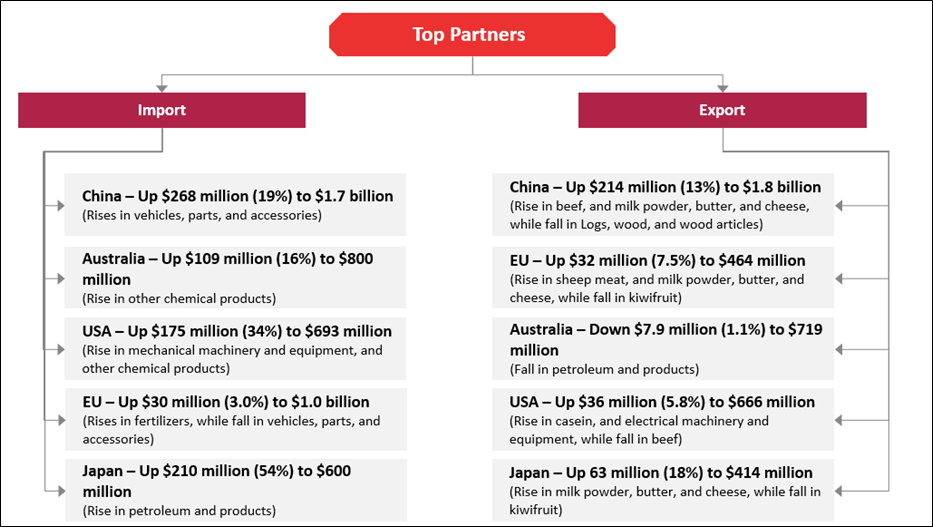
Data Source: This work is based on/includes Stats NZ’s data which are licensed by Stats NZ for reuse under the Creative Commons Attribution 4.0 International Licence; Chart Created by Kalkine Group
Trade Momentum Continues in July 2022
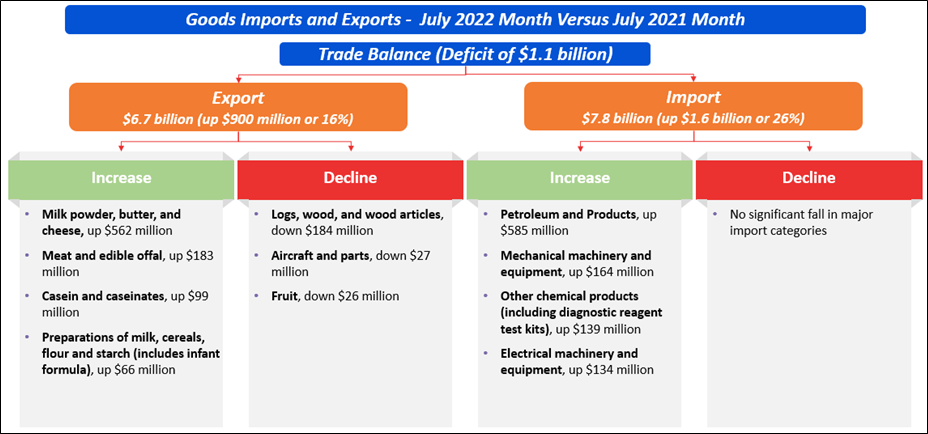
As per Stats.NZ, goods exports increased by 16% to $6.7 billion, and goods imports grew by 26% to $7.8 billion, resulting in a monthly trade deficit of $1.1 billion in July 2022 versus July 2021. Meanwhile, the annual trade deficit was $11.6 billion in July 2022 as annual goods exports stood at $68.3 billion, up $7.1 billion from the previous year, and yearly goods imports stood at $79.9 billion, up $17.7 billion from the prior year.
Exhibit 2: Trend in Goods Export and Import in July 2022
Data Source: This work is based on/includes Stats NZ’s data which are licensed by Stats NZ for reuse under the Creative Commons Attribution 4.0 International Licence; Chart Created by Kalkine Group
Rise in Monthly Air Passenger Traffic
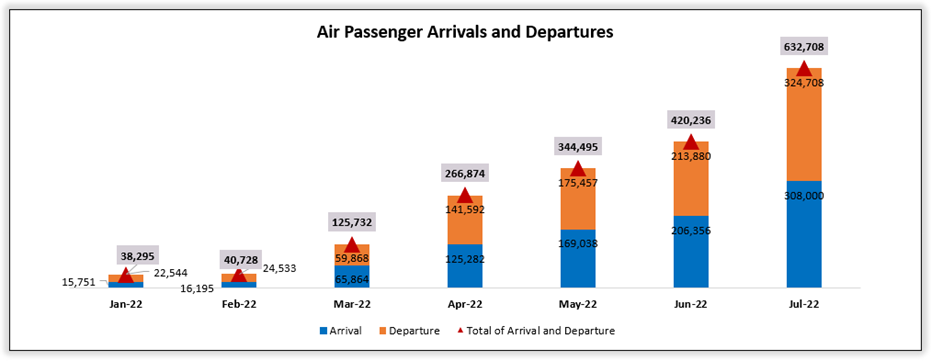
As per the July 2022 monthly traffic update by 'Auckland International Airport Limited', Auckland Airport's total passenger volumes grew by 41% YoY in July 2022, representing 66% of July 2018. The international passengers (excl. transits) increased 284% YoY in July 2022, transit passengers grew 5,249% YoY, while domestic passengers fell 4% YoY. Short-haul and long-haul international passenger numbers have bounced to 64% and 32%, respectively, versus July 2018, with long-haul passengers rising by 52% versus June 2022 and short-haul international passengers rising by 38% on June 2022. Meanwhile, Queenstown airport reported a promising passenger number for July 2022 at 101% of July 2018. International passengers reported at 87% and domestic passengers at 110% versus July 2018, primarily led by the timing of school holidays in the month.
Exhibit 3: Trend in Goods Export and Import in July 2022
Data Source: This work is based on/includes Customs NZ data which are licensed by Customs NZ for reuse under the Creative Commons Attribution 4.0 International Licence; Chart Created by Kalkine Group
Index Performance:
The S&P/NZX All Industrials (Sector) Index generated a 2-year return of ~17.62% versus ~-0.78% by the S&P/NZX 50 Index. Therefore, NZX All Industrials Index overperformed NZX50 Index by ~18.40% in 2-year.
Exhibit 4: S&P/NZX All Industrials (Sector) vs S&P/NZX50 Index
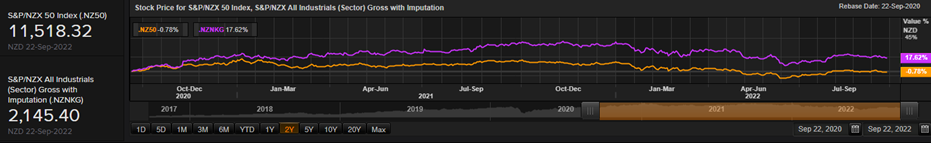
Source: REFINITIV
Key Risks and Challenges:
Financial market conditions tightened further to control rising inflation due to higher energy prices and other factors. Further, persistent nervousness among businesses driven by lacklustre demand for products and services is keeping expansion plans away from the company's regular growth strategies. The central banks of developed economies continue to raise critical rates despite the deteriorating growth outlook, impacting multiple industries. Further, the net migration outflows in NZ contribute to tightening the labour market.
Exhibit 5. Key Risks in Industrials Sector:
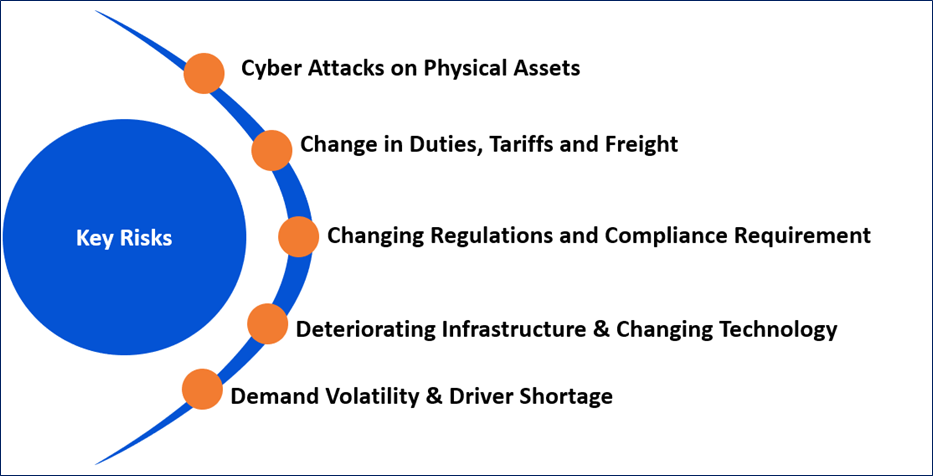
Source: Analysis by Kalkine Group
Outlook:
The NZ government plans to infuse $61.9 billion through infrastructure investment over the next five years, to strengthen the foundations and minimize NZ's infrastructure deficit by investing in projects like Auckland Light Rail, water infrastructure, and rolling stock for rail. Further, the accelerating pace of Free Trade Agreement (FTA) is projected to unlock access to the UK market and boost New Zealand’s COVID-19 recovery. With complete border reopening from the end of July 2022, migrant arrivals are projected to continue to rise during the rest of the year. However, it is uncertain when they will exceed departures. The rising trend in air passengers will boost the hard-hit airline sector and contribute to economic recovery.
Apart from the sector-specific factors, an analysis on three NZX-listed companies is provided. This report covers their insights, outlook, performance and potential as expected to be delivered in the near to medium term.
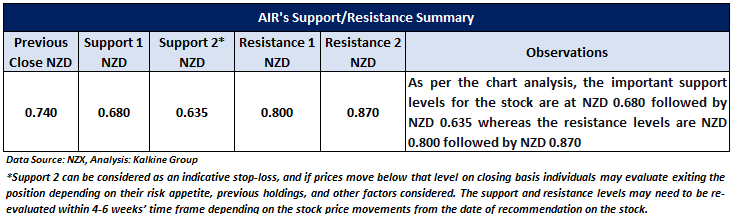
1) Air New Zealand Limited (Recommendation: Buy, Potential Upside: Low Double-Digit) (M-Cap: NZD2.49 billion)
Business Description:
Air New Zealand Limited (NZX: AIR) operates a global network that provides air passenger and cargo transport services to, from, and within New Zealand.
Outlook
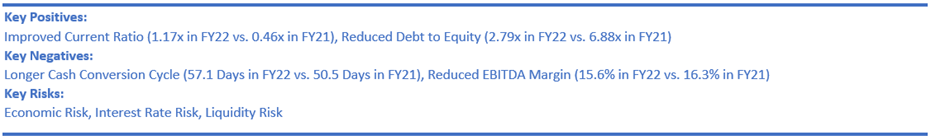
The company expects a rebound in sales for the initial three months of FY23 and anticipates that the operation will be ~70% of FY19 capacity. Amid similar capacity and an average jet fuel price of ~USD130/bbl, the company expects earnings before taxation and other significant items for 1H'FY to be in the ambit of $200-$275 million. Primarily, the volatility in fuel prices will determine the company's earnings. The loss before other significant items and taxation stood at $725 million for FY22, while the statutory loss before taxation stood at $810 million.
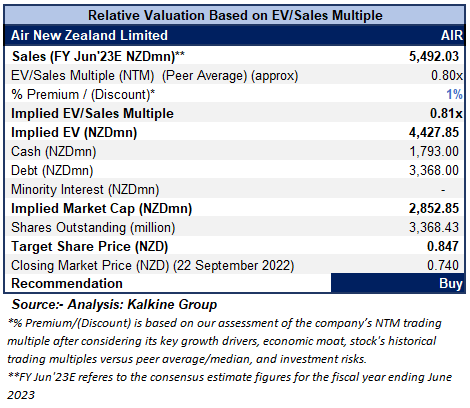
Valuation Methodology: EV/Sales Multiple Based Relative Valuation (Illustrative)
Technical Overview:
Daily Price Chart
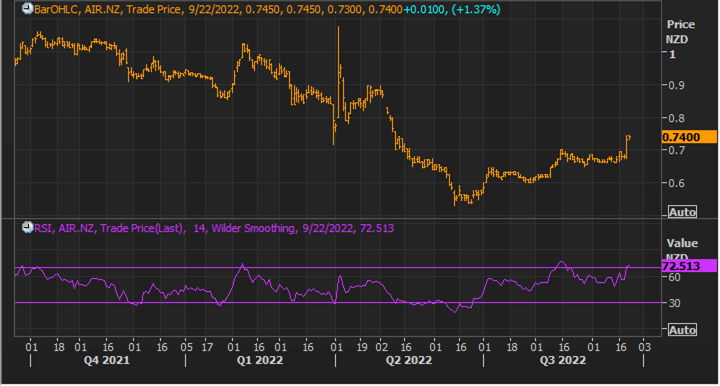
Source: REFINITIV, Note: Purple color line reflects Relative Strength Index (14-Period)
Stock Recommendation
The stock has been valued using an EV/Sales multiple-based illustrative relative valuation, and the target price so arrived reflects a rise of low-double-digit (in % terms). A slight premium has been applied to EV/Sales Multiple (NTM) (Peer Average), considering the decent outlook for FY23 and revival in domestic demand.
Considering the aforementioned factors, a ‘Buy’ recommendation has been assigned on the stock at the closing market price of NZD0.74 per share, up 1.37% as of 22 September 2022.
2) Move Logistics Group Limited (Recommendation: Speculative Buy, Potential Upside: Low Double-Digit) (M-Cap: NZD145.48 million)
Business Description:
Move Logistics Group Limited (NZX: MOV) is among the leading domestic freight and logistics players in New Zealand. It is engaged in providing freight transporting and warehousing services. It also coordinates offshore freight movements through international alliances.
Outlook
The company plans to focus on the Freight reset programme, market growth in targeted customer segments and evolution of MOVE’s multi-modal offer, mainly in coastal and trans-Tasman shipping. Further, the company is well positioned with a focused strategy, practical balance sheet, experienced team and strategically planned growth targets. Moreover, the results are expected better in FY23 as the Freight reset continues, Contract Logistics are in place, and International opportunities are building up.
Technical Overview:
Daily Price Chart
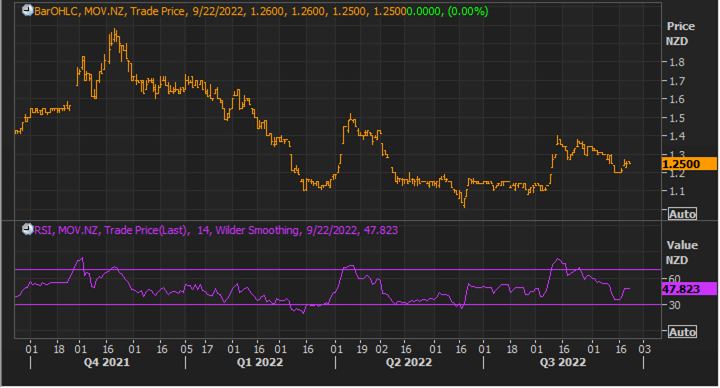
Source: REFINITIV, Note: Purple color line reflects Relative Strength Index (14-Period)
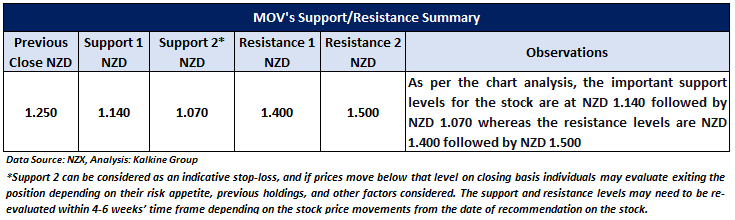
Stock Recommendation:
Considering the aforementioned factors, a ‘Speculative Buy’ recommendation has been assigned on the stock at the closing market price of NZD1.25 per share, as of 22 September 2022.
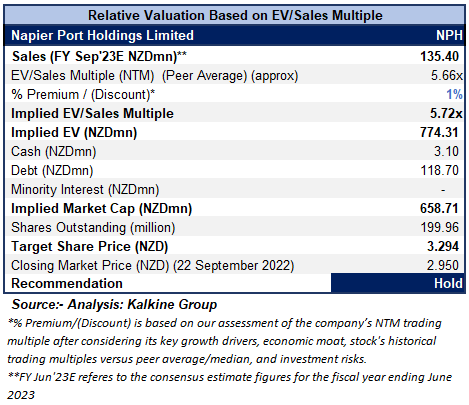
3) Napier Port Holdings Limited (Recommendation: Hold, Potential Upside: Low Double-Digit) (M-Cap: NZD589.88 million, Annual Dividend Yield (TTM)1: 3.53%)
Business Description:
Napier Port Holdings Limited (NZX: NPH) is the shipping gateway and is the fourth-largest port by container volume.
Outlook
The company remains positive on the trade outlook for its region driven by higher primary sector commodity prices, and it expects a better 2H’FY22 for meat, forestry, and horticulture exports. The company reaffirmed its earnings guidance as it expects the underlying result from operating activities for FY22 to remain between NZD38-42 million. The company expects operating cost inflation to remain elevated and continues to focus on mitigating these costs while developing the capability to meet customers’ needs now and in the future.
Valuation Methodology: EV/Sales Multiple Based Relative Valuation (Illustrative)
Technical Overview:
Daily Price Chart
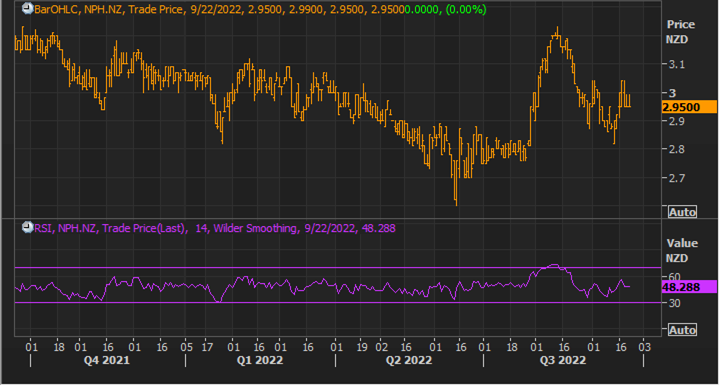
Source: REFINITIV, Note: Purple color line reflects Relative Strength Index (14-Period)
Stock Recommendation
The stock has been valued using an EV/Sales multiple-based illustrative relative valuation, and the target price so arrived reflects a rise of low-double-digit (in % terms). A slight premium has been applied to EV/Sales Multiple (NTM) (Peer Average), considering its reaffirmation of earnings guidance for FY22 and decent outlook.
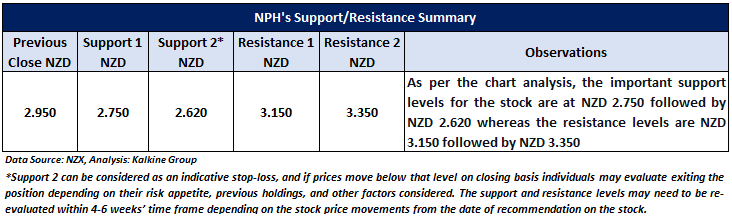
Considering the aforementioned factors, a ‘Hold’ recommendation has been assigned on the stock at the closing market price of NZD2.95 per share, as of 22 September 2022.
Markets are trading in a highly volatile zone currently due to certain macro-economic issues and geopolitical tensions prevailing. Therefore, it is prudent to follow a cautious approach while investing.
Note 1: Past performance is not a reliable indicator of future performance.
Note 2: The reference date for all price data, currency, technical indicators, support, and resistance levels is September 22, 2022. The reference data in this report has been partly sourced from REFINITIV.
Note 3: Investment decisions should be made depending on an individual's appetite for upside potential, risks, holding duration, and any previous holdings. An 'Exit' from the stock can be considered if the Target Price mentioned as per the Valuation and or the technical levels provided has been achieved and is subject to the factors discussed above.
Note 4: Annual Dividend Yield is on a Trailing Twelve Month (TTM1) basis and are subject to change based on factors such as company performance, stock price changes, etc.
Technical Indicators Defined: -
Support: A level at which the stock prices tend to find support if they are falling, and a downtrend may take a pause backed by demand or buying interest. Support 1 refers to the nearby support level for the stock and if the price breaches the level, then Support 2 may act as the crucial support level for the stock.
Resistance: A level at which the stock prices tend to find resistance when they are rising, and an uptrend may take a pause due to profit booking or selling interest. Resistance 1 refers to the nearby resistance level for the stock and if the price surpasses the level, then Resistance 2 may act as the crucial resistance level for the stock.
Stop-loss: It is a level to protect further losses in case of unfavourable movement in the stock prices.
Disclaimer
Kalkine New Zealand Limited is a Financial Advice Provider (“FAP”) and is authorised by a Transitional FAP license issued by Financial Markets Authority (“FMA”) to provide financial advice. Kalkine provides only general financial advice through its research reports following a person becoming a member. The reports contain buy/sell/hold and other recommendations in relation to equity financial products. The recommendations and opinions [on this website] / [in this report] do not take into account any of your investment objectives, financial situation or needs. Before you make a decision about whether to acquire a financial product, you should obtain the Product Disclosure Statement from the product issuer. You should consider the appropriateness of advice taking into account your own objectives, financial situation and needs and seek independent financial advice before making any financial decisions. If you act on the advice in the research reports, you may have to pay fees, expenses or other amounts (but not to Kalkine). Further information about the complaints and dispute resolution process, as well as information about Kalkine’s duties are available on Kalkine’s website. Please read our Financial Advice Provider (FAP) disclosure statement and Complaints Handling Guide, which are available on the website.
Past performance is not a reliable indicator of future performance.
 Please wait processing your request...