
Comvita Limited (NZX: CVT) is the global market leader in Mānuka honey and bee consumer goods. Fonterra Co-operative Group Limited (NZX: FCG) is a dairy co-operative, owned and supplied by nearly 9,000 farming families in Aotearoa, New Zealand.
Kalkine’s Sector Report covers the Investment Highlights, Key Financial Metrics, Risks, Outlook, Technical Analysis along with the Valuation, Target Price, and Recommendation on the stock.
 1. Sector Landscape and Outlook
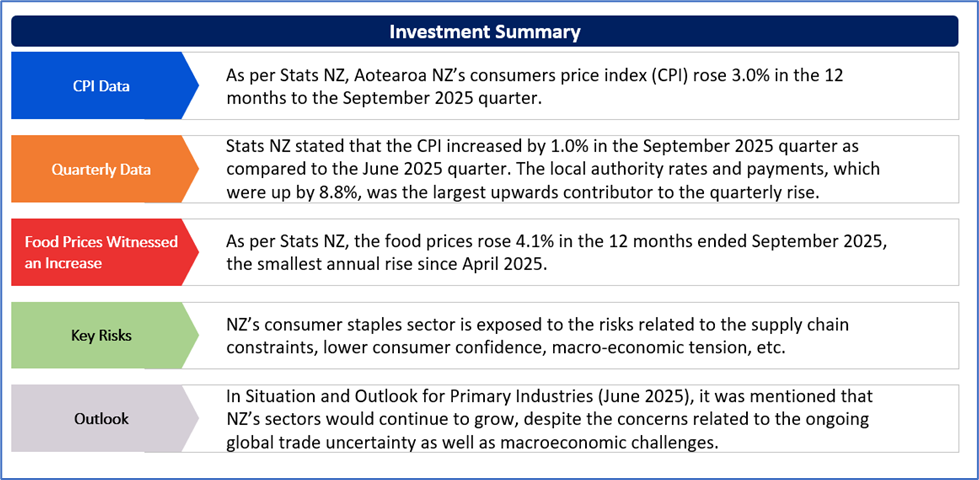
As per Stats NZ, Aotearoa NZ’s consumers price index (CPI) rose 3.0% in the 12 months to the September 2025 quarter. The 3% annual inflation rate in the September 2025 quarter was the highest since the June 2024 quarter when it was 3.3%. The largest contributors to the annual inflation rate belonged to the housing and household utilities group. The main contributors were electricity, which was up 11.3% (10.1% contribution to the 3% annual CPI increase), rent (which was up 2.6%) and local authority rates and payments (which were up 8.8%). The top three contributors made up ~17% of the weight in the CPI basket.
Exhibit 1: Consumers Price Index (Annual % Change), September 2024 – September 2025 Quarters
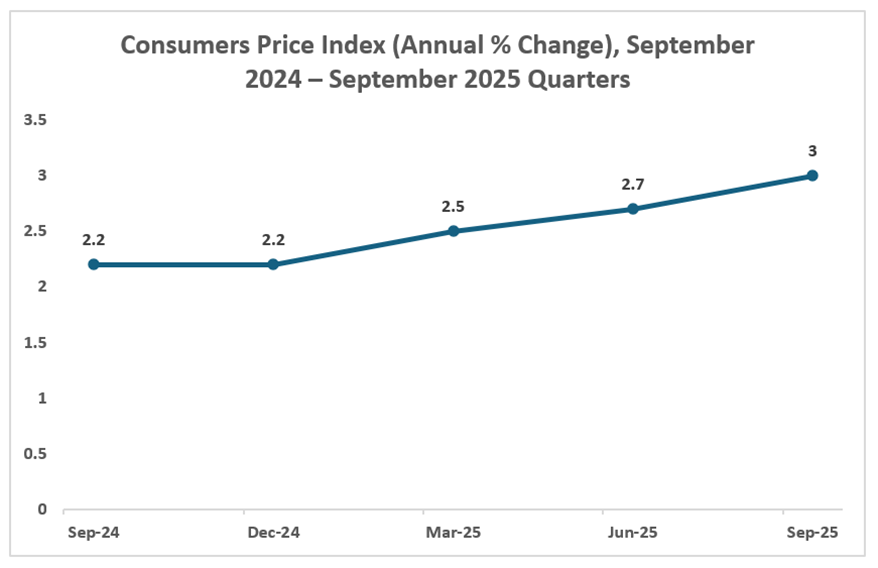
Data Source: This work is based on/includes Stats NZ’s data which are licensed by Stats NZ for reuse under the Creative Commons Attribution 4.0 International Licence; Chart Created by Kalkine Group
Quarterly Inflation Stood at 1.0%
Stats NZ stated that the CPI increased by 1.0% in the September 2025 quarter as compared to the June 2025 quarter. The local authority rates and payments, which were up by 8.8%, was the largest upwards contributor to the quarterly rise. Vegetables, which rose by 12.2%, also contributed and seasonal increases for tomatoes, cabbage, capsicums, lettuce, and broccoli all contributed to the increase in vegetable prices.
Exhibit 2: Consumers Price Index (Quarterly % Change) September 2024–September 2025 Quarters
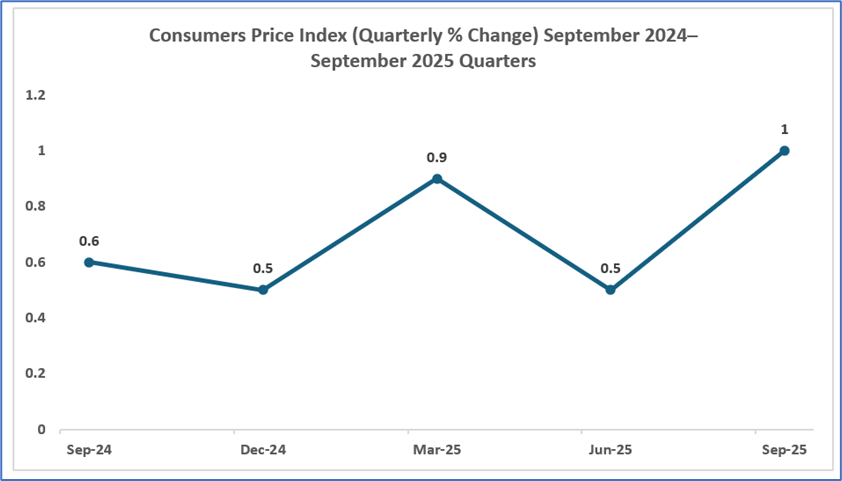
Data Source: This work is based on/includes Stats NZ’s data which are licensed by Stats NZ for reuse under the Creative Commons Attribution 4.0 International Licence; Chart Created by Kalkine Group
Annual Food Prices Rose 4.1%
As per Stats NZ, the food prices rose 4.1% in the 12 months ended September 2025, the smallest annual rise since April 2025. The higher prices for the grocery food group, which rose 3.9%, contributed the most to the annual increase in food prices. This was followed by meat, poultry, and fish, which increased by 6.4% annually, and restaurant meals and ready-to-eat food, which rose 2.5% annually. Notably, the food prices declined in September 2025 by 0.4% as compared to August 2025. The vegetables and chocolate contributed the most to the decline.
Key Risks and Challenges:
RBNZ, in the release dated 8th October 2025, stated that there are upside and downside risks to the inflation outlook in NZ. The cautious behaviour by households as well as businesses might slow the economic recovery, reducing the medium-term inflation pressure. Also, some of the industry-specific factors could have constrained supply. For example, increased milk prices and unfavourable weather conditions likely resulted in the higher livestock retention as well as lower meat production. Overall, NZ’s consumer staples sector is exposed to the risks related to the supply chain constraints, lower consumer confidence, macro-economic tension, etc.
Exhibit 3. Key Risks in Consumer Staples Sector:
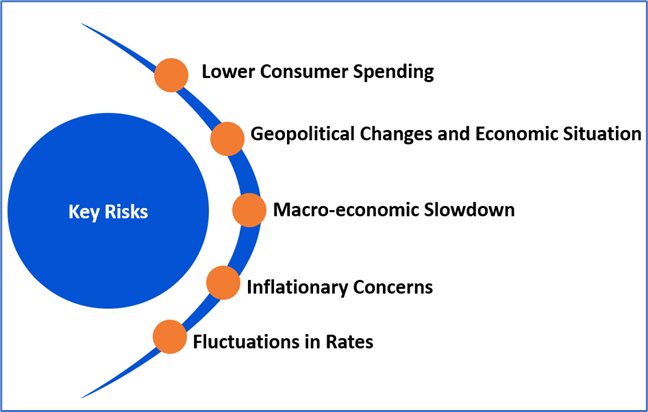
Source: Analysis by Kalkine Group
Outlook:
USDA (United States Department of Agriculture) released Oceania Dairy Market Overview, wherein, it was announced that a large NZ cooperative announced final farmgate milk price of $10.16 per kilogram milk solids (kgMS) for the 2024/2025 season. This led to the $15.3 Bn in payments to dairy farmers, which demonstrates a $3.8 Bn rise in revenue over the prior season.
In Situation and Outlook for Primary Industries (June 2025), it was mentioned that NZ’s sectors would continue to grow, despite the concerns related to the ongoing global trade uncertainty as well as macroeconomic challenges. While the uncertainty can impact the global demand and influence NZ’s export performance, it was mentioned that food and fibre sector remains generally more resilient compared to other sectors. This is because of the sector’s lower sensitivity to the price fluctuations where commodities continue to make up the significant portion of the export revenue.
Apart from the sector-specific factors, an analysis on 2 NZX-listed companies is provided. This report covers their insights, outlook, performance and potential as expected to be delivered in the near to medium term.
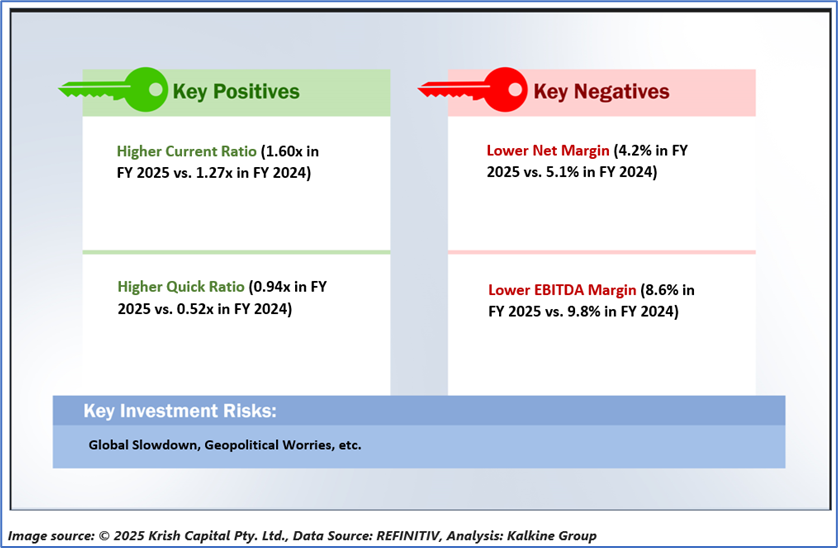
1) Fonterra Co-operative Group Limited (Recommendation: Buy, Potential Upside: Low Double-Digit) (M-Cap: NZD 9.4 Bn, Annual Dividend Yield: 13.49%)
Business Description:
Fonterra Co-operative Group Limited (NZX: FCG) is a New Zealand-based dairy co-operative company.
Outlook:
FCG is witnessing good demand from the global customers for high-quality products made from NZ farmers’ milk. This has been fuelling returns through both the Farmgate Milk Price and dividends. The focus is also towards positioning the Co-op to deliver further value via the Foodservice and Ingredients businesses, which include continuing to deploy towards new manufacturing capability to cater to the increased customer demand for the high-value products.
Technical Overview:
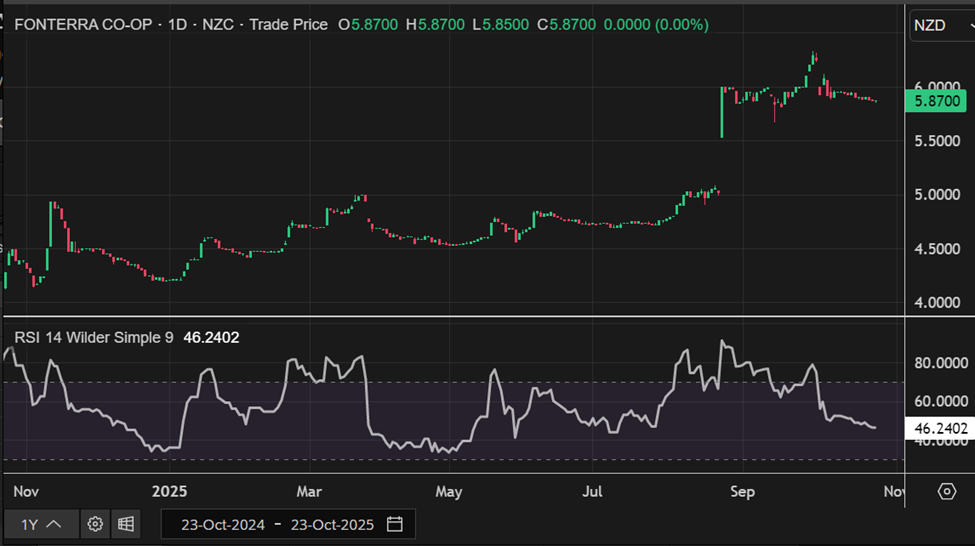
Data Source: REFINITIV, Analysis: Kalkine Group
Technical Commentary
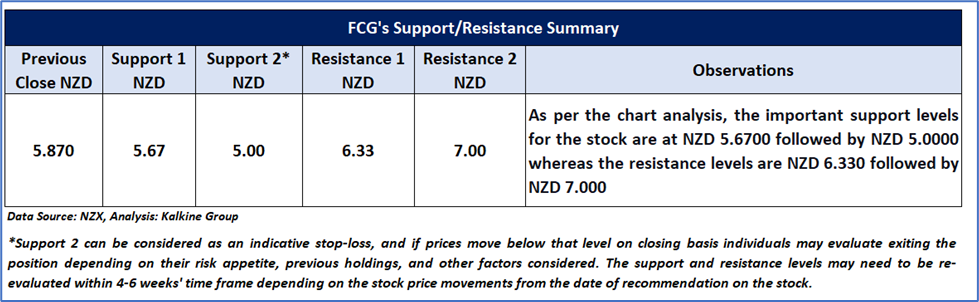
On the daily chart, FCG’s stock price is forming a trading range, suggesting that the current sideways period in the stock might continue to persist in the near future. Additionally, the momentum oscillator RSI (14-period) is trading near its midpoint, providing more support to the mentioned recommendation. Prices are trading between its previous peak and trough, which might function as resistance and support levels for the stock, respectively. A key support level for the stock is placed at NZD 5.670, while crucial resistance level is positioned at NZD 6.330.
Stock Recommendation
Considering the facts above, a ‘Buy’ recommendation on the stock has been provided at the closing market price of NZD 5.87 per share as on 23rd October 2025.
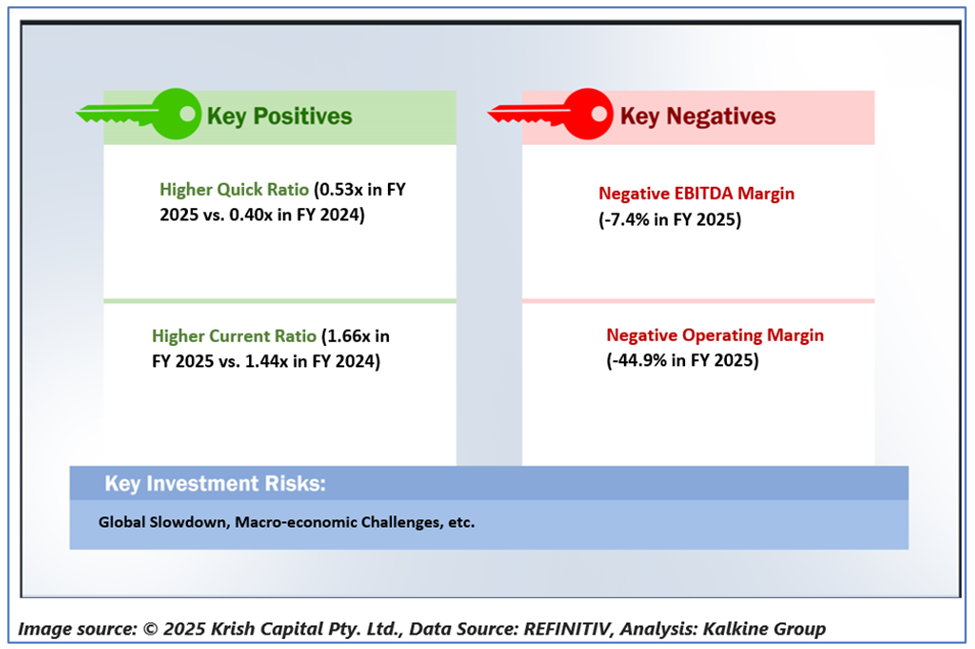
2) Comvita Limited (Recommendation: Speculative Buy, Potential Upside: Low Double-Digit) (M-Cap: NZD 52.5 Mn)
Business Description:
Comvita Limited (NZX: CVT) is the global market leader in Mānuka honey and bee consumer goods.
Outlook:
CVT’s revenue in Q1 FY 2026 amounted to $45.6 Mn, surpassing the budget of $43.8 Mn and prior year of $42.3 Mn. This demonstrates stronger-than-budget performance in China and the Rest of Asia, partially mitigated by the softer results in North America and Australia and New Zealand. The uplift showcases normal quarterly fluctuations instead of significant changes in the trading conditions.
Technical Overview:
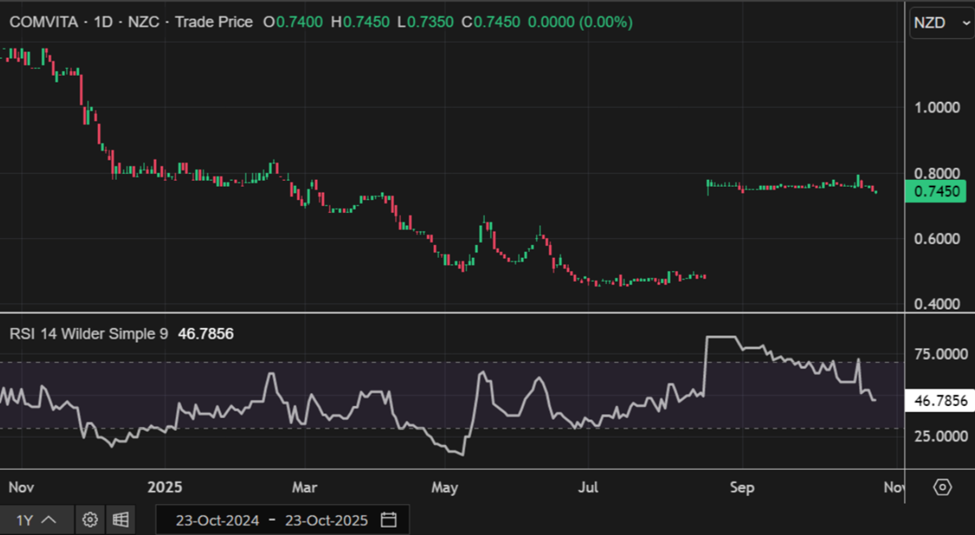
CVT Daily Technical Chart, Data Source: REFINITIV
Technical Commentary:
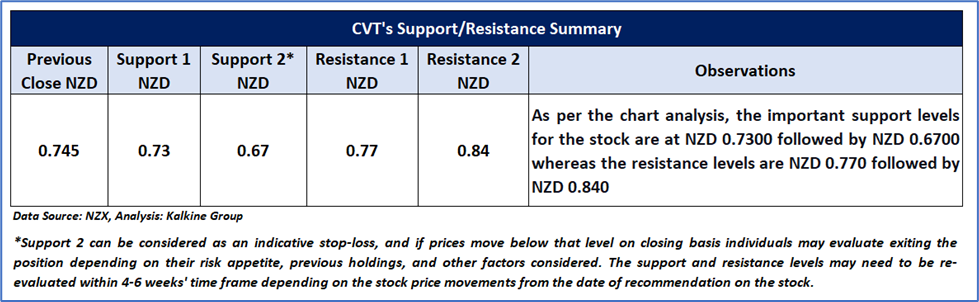
On the weekly chart, CVT’s stock price broke above the upper boundary of a descending wedge pattern with a Break-away gap, indicating a positive trend. Moreover, the momentum oscillator RSI (14-period) is trading above its midpoint, adding further evidence to the previous observation. Prices are trading between its previous peak and trough, which might function as resistance and support levels for the stock, respectively. A significant support level for the stock is placed at NZD 0.730, while critical resistance level is positioned at NZD 0.770.
EV/Sales Based Valuation
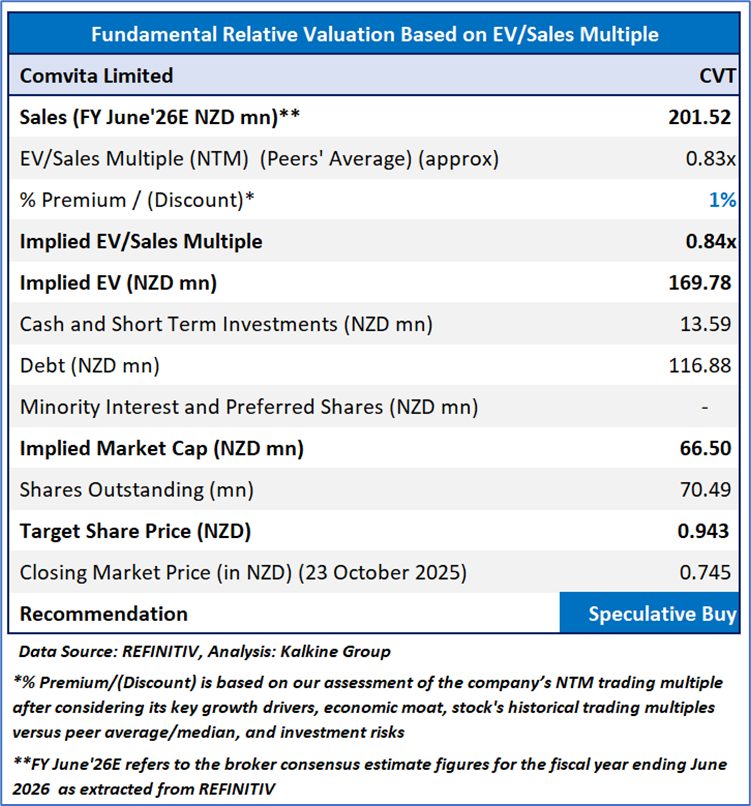
Stock Recommendation
Considering the facts above, a ‘Speculative Buy’ recommendation on the stock has been provided at the closing market price of NZD 0.745 per share as on 23rd October 2025.
Markets are trading in a highly volatile zone currently due to certain macro-economic issues and geopolitical tensions prevailing. Therefore, it is prudent to follow a cautious approach while investing.
Note 1: Past performance is not a reliable indicator of future performance.
Note 2: The reference date for all price data, currency, technical indicators, support, and resistance levels is October 23, 2025. The reference data in this report has been partly sourced from REFINITIV.
Note 3: Investment decisions should be made depending on an individual's appetite for upside potential, risks, holding duration, and any previous holdings. An 'Exit' from the stock can be considered if the Target Price mentioned as per the Valuation and or the technical levels provided has been achieved and is subject to the factors discussed above.
Note 4: Annual Dividend Yield is on a Trailing Twelve Month (TTM1) basis and are subject to change based on factors such as company performance, stock price changes, etc.
Note 5: Kalkine reports are prepared based on the stock prices captured either from REFINITIV or Trading View. Typically, REFINITIV or Trading View may reflect stock prices with a delay which could be a lag of 25-30 minutes. There can be no assurance that future results or events will be consistent with the information provided in the report. The information is subject to change without any prior notice.
Technical Indicators Defined: -
Support: A level at which the stock prices tend to find support if they are falling, and a downtrend may take a pause backed by demand or buying interest. Support 1 refers to the nearby support level for the stock and if the price breaches the level, then Support 2 may act as the crucial support level for the stock.
Resistance: A level at which the stock prices tend to find resistance when they are rising, and an uptrend may take a pause due to profit booking or selling interest. Resistance 1 refers to the nearby resistance level for the stock and if the price surpasses the level, then Resistance 2 may act as the crucial resistance level for the stock.
Stop-loss: It is a level to protect further losses in case of unfavourable movement in the stock prices.
This report (“Report”) has been issued by Kalkine New Zealand Limited (FSP691351) (NZBN:9429047678101) (“Kalkine”). Kalkine is a Financial Advice Provider (“FAP”) and is authorised by a Class 1 Financial Advice Provider Licence issued by Financial Markets Authority (“FMA”) to provide financial advice. Kalkine provides only general financial advice through its research reports following a person becoming a member. The reports contain buy/sell/hold and other recommendations in relation to equity securities, managed funds and other managed investment schemes and other financial advice products. The recommendations and opinions in this Report and on Kalkine website do not take into account any of your investment objectives, financial situation or needs. Before you make a decision about whether to acquire a financial product, you should obtain the Product Disclosure Statement from the product issuer. You should consider the appropriateness of advice taking into account your own objectives, financial situation and needs and seek independent financial advice before making any financial decisions. If you act on the advice in the research reports, you may have to pay fees, expenses or other amounts (but not to Kalkine).
The information in this Report and on the Kalkine website has been prepared from a wide variety of sources, which Kalkine, to the best of its knowledge and belief, considers accurate. Kalkine has made every effort to ensure the reliability of the information contained in its reports (including this Report), newsletters and websites. All information represents our views at the date of publication and may change without notice.
Kalkine does not issue, sell or deal in any financial products. The information in this Report does not constitute an offer to sell securities or other financial products or a solicitation of an offer to buy securities or other financial products. Our reports contain general recommendations to invest in securities and other financial products. Kalkine is not responsible for, and does not guarantee, the performance of, or returns on, any investments mentioned in this Report.
This Report may contain information on past performance of particular investments. Past performance is not a reliable indicator of future performance. Returns stated do not take into account transaction costs and taxes.
Further information about the complaints and dispute resolution process, as well as information about Kalkine’s duties are available on Kalkine’s website. Please read our Financial Advice Provider (FAP) disclosure statement and Complaints Handling Guide, which are available on the website.
Copyright 2025 Krish Capital Pty. Ltd. (ABN 61629651510). All Rights Reserved. No part of this Report, or its content, may be reproduced in any form without our prior consent.
Past performance is not a reliable indicator of future performance.
 Please wait processing your request...