
T&G Global Limited (NZX: TGG) is engaged in distributing, marketing and exporting fresh produce. Fonterra Co-operative Group Limited (NZX: FCG) is a NZ-based dairy co-operative company. It is mainly involved in the collection, manufacture and sale of milk and milk-derived products through its ingredients, consumer and food service channels.
Kalkine’s Sector Report covers the Investment Highlights, Key Financial Metrics, Risks, Outlook, Technical Analysis, Key Support and Resistance Levels, and Recommendation on the stock.
1. Sector Landscape and Outlook
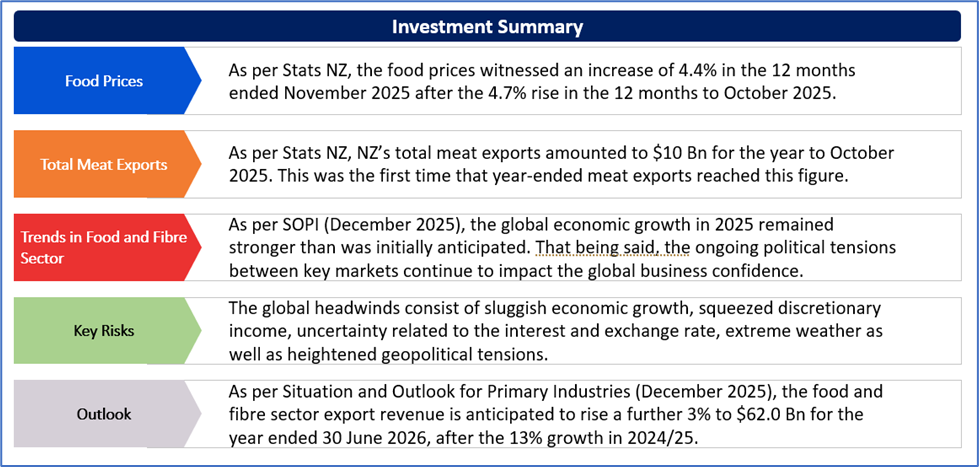
As per Stats NZ, the food prices witnessed an increase of 4.4% in the 12 months ended November 2025 after the 4.7% rise in the 12 months to October 2025. The increased prices for grocery food group, which rose by 4.6%, contributed the most to the annual rise in food prices. This was followed by meat, poultry, and fish, which rose by 7.7% annually.
Notably, food prices witnessed a decline of 0.4% in November 2025 as compared to October 2025. The fruit and vegetables subgroup was the main contributor to overall decline, which fell by 4.5% over the month. The range of seasonal produce, which includes tomatoes, strawberries, cucumbers, and lettuce, resulted to this decline.
Exhibit 1: Food Pices (Annual % Change) (June 2025 – November 2025)
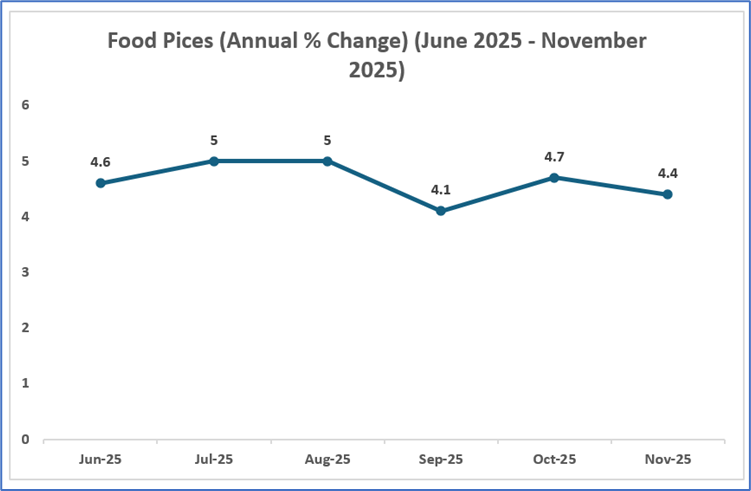
Data Source: This work is based on/includes Stats NZ’s data which are licensed by Stats NZ for reuse under the Creative Commons Attribution 4.0 International Licence; Chart Created by Kalkine Group
Trends in Meat Exports (Year Ended October 2025)
As per Stats NZ, NZ’s total meat exports amounted to $10 Bn for the year to October 2025. This was the first time that year-ended meat exports reached this figure. As compared to the year ended October 2024, NZ’s total meat exports rose $1.6 Bn to $10 Bn in the year to October 2025. For the year to October 2025, the increase in meat exports was led by higher sheep meat exports, which rose $951 Mn, and beef, up by $625 Mn. The increase in exports for sheep meat and beef was because of increased unit prices for the items
Notably, total exports for the year to October 2025 amounted to $79.4 Bn, up by $9.8 Bn as compared to the year ended October 2024.
Exhibit 2: Meat Exports ($ Bn), Year Ended, May 2025 - October 2025
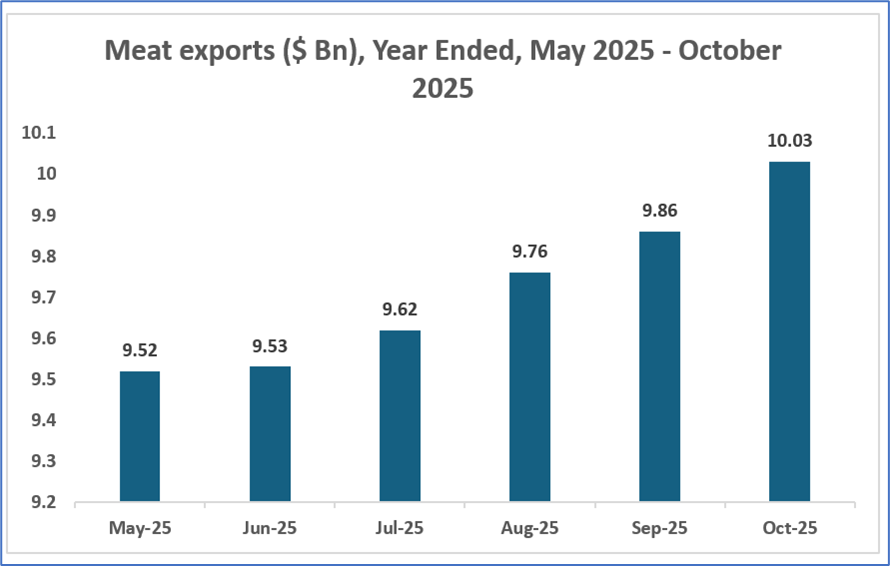
Data Source: This work is based on/includes Stats NZ’s data which are licensed by Stats NZ for reuse under the Creative Commons Attribution 4.0 International Licence; Chart Created by Kalkine Group
Trends in Broader Food and Fibre Sector
As per Situation and Outlook for Primary Industries (December 2025), the global economic growth in 2025 remained stronger than was initially anticipated. That being said, the ongoing political tensions between key markets continue to impact the global business confidence and investment. Notably, kiwi food and fibre businesses are showcasing significant resilience, navigating difficult global conditions due to the trade policies in major economies, complex supply chains, elevated input costs as well as extreme weather. However, the conditions have been improving for the farmers and growers.
Key Risks and Challenges:
Situation and Outlook for Primary Industries (December 2025) highlighted that food and fibre sector has been successfully producing, processing, and exporting quality products in the difficult trade environment. Notably, the global headwinds consist of sluggish economic growth, squeezed discretionary income, uncertainty related to the interest and exchange rate, extreme weather as well as heightened geopolitical tensions. Also, the global volatility and uncertainty are anticipated to remain elevated moving forward.
Exhibit 3. Key Risks in Consumer Staples Sector:
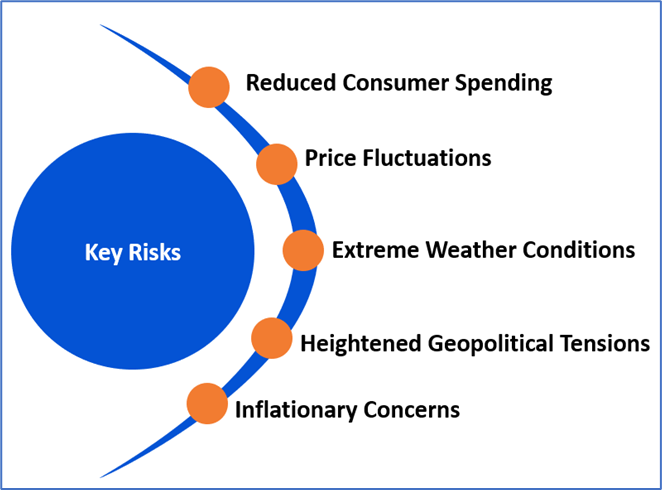
Source: Analysis by Kalkine Group
Outlook:
As per Situation and Outlook for Primary Industries (December 2025), the food and fibre sector export revenue is anticipated to rise a further 3% to $62.0 Bn for the year ended 30 June 2026, after the 13% growth in 2024/25. The rise in 2025/26 is anticipated to be helped by volume lifts for dairy, forestry, and horticulture products as well as increasing prices for meat products.
Furthermore, dairy export revenue is anticipated to rise 1% to $27.4 Bn for the year ended 30 June 2026. The growth in global supply has been surpassing the demand growth, putting downward pressure on prices. However, a weaker NZD is anticipated to help exporters to maintain good returns.
Apart from the sector-specific factors, an analysis on 2 NZX-listed companies is provided. This report covers their insights, outlook, performance and potential as expected to be delivered in the near to medium term.
1) T&G Global Limited (Recommendation: Buy, Potential Upside: Low Double-Digit) (M-Cap: NZD 273.2 Mn)
Business Description:
T&G Global Limited (NZX: TGG) is a grower, distributor, marketer, and exporter of fresh produce, which include apples, berries, citrus (lemons, mandarins, and navel oranges), and tomatoes.
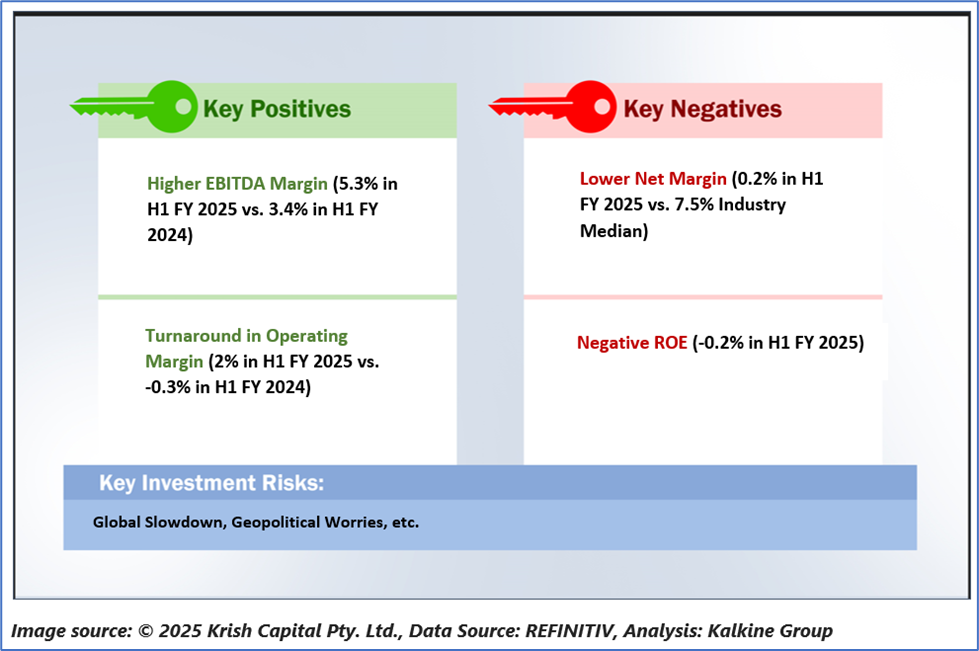
Outlook:
TGG added that the commercialisation of its new premium JOLI™ apple brand has been scaling, ahead of the consumer launch in 2027. The company highlighted that 380,000 trees have been licensed to grow in Aotearoa New Zealand this year, while test blocks were established throughout Europe. The company remains well-placed to capitalise on this momentum. It has a well-structured growth strategy and healthy foundations.
Technical Overview:
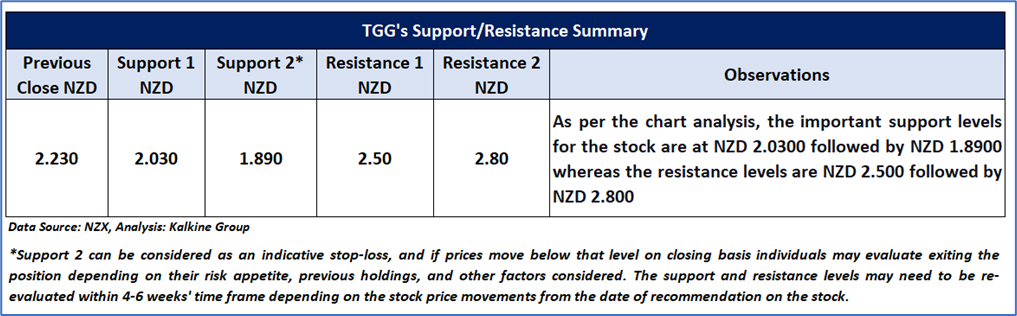
Technical Commentary:
On the daily chart, TGG’s stock price is forming a trading range characterized by lower highs and higher lows, suggesting that the current sideways period in the stock might continue to persist in the near future. Additionally, the momentum oscillator RSI (14-period) is fluctuating around its midpoint, adding more evidence to the mentioned recommendation. Price is trading between its previous peak and trough, which might serve as resistance and support levels for the stock, respectively. A significant support level is located at NZD 2.03, while a key resistance level is positioned at NZD 2.50.
Stock Recommendation
Considering the technical commentary and outlook, a ‘Buy’ recommendation on the stock has been provided at the closing market price of NZD 2.23 per share as on 18th December 2025.
2) Fonterra Co-operative Group Limited (Recommendation: Hold, Potential Upside: Low Double-Digit) (M-Cap: NZD 9.5 Bn, Annual Dividend Yield: 13.33%)
Business Description:
Fonterra Co-operative Group Limited (NZX: FCG) is a New Zealand-based dairy co-operative company.
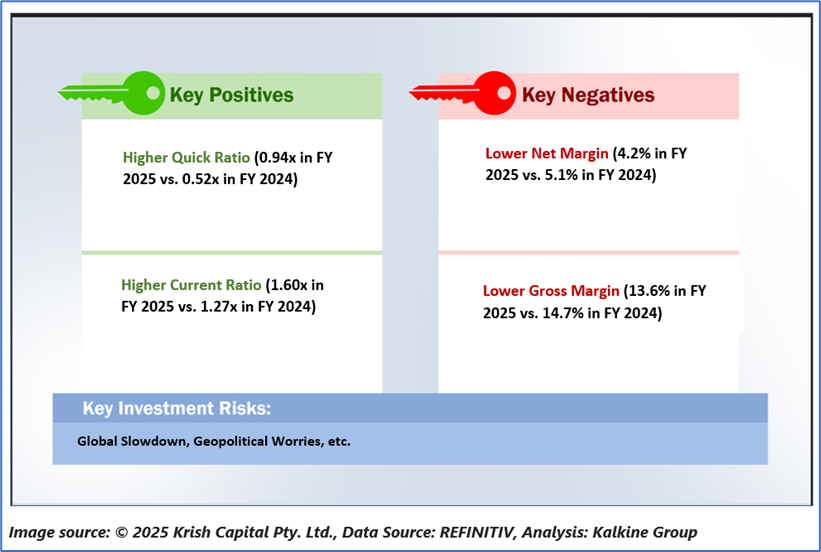
Outlook:
FCG provided an update on the forecast Farmgate Milk Price for the 2025/26 season. The Co-op adjusted its forecast range from $9.00 - $10.00 per kgMS to $8.50 - $9.50 per kgMS. The midpoint changed from $9.50 per kgMS to $9.00 per kgMS. It was further added that, while half of the season is yet to complete, it is witnessing robust milk flows both in NZ and globally.
Technical Overview:
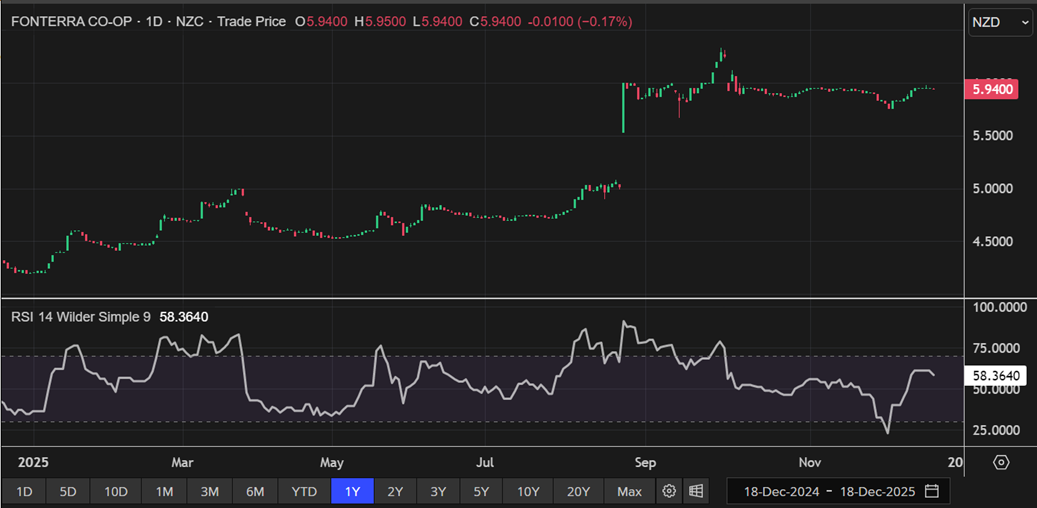
FCG Daily Technical Chart, Data Source: REFINITIV
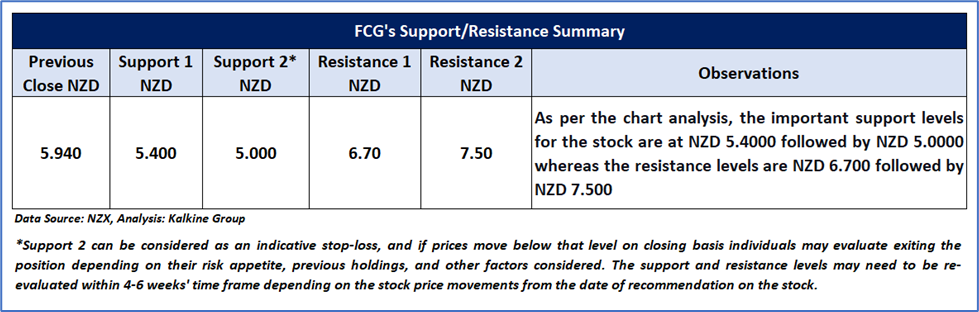
Technical Commentary:
On the daily chart, FCG’s stock price is moving in a trading range characterized by lower highs and higher low, suggesting that the current sideways period in the stock might continue to remain in place in the near term. Moreover, the momentum oscillator RSI (14-period) is trading near its midpoint, providing further support to the previous analysis. Price is trading between its previous peak and trough, which might serve as resistance and support levels for the stock, respectively. A significant support level is located at NZD 5.4, while a key resistance level is positioned at NZD 6.7.
Stock Recommendation
Considering the facts above, a ‘Hold’ recommendation on the stock has been provided at the closing market price of NZD 5.94 per share as on 18th December 2025.
Markets are trading in a highly volatile zone currently due to certain macro-economic issues and geopolitical tensions prevailing. Therefore, it is prudent to follow a cautious approach while investing.
Note 1: Past performance is not a reliable indicator of future performance.
Note 2: The reference date for all price data, currency, technical indicators, support, and resistance levels is December 18, 2025. The reference data in this report has been partly sourced from REFINITIV.
Note 3: Investment decisions should be made depending on an individual's appetite for upside potential, risks, holding duration, and any previous holdings. An 'Exit' from the stock can be considered if the Target Price mentioned as per the Valuation and or the technical levels provided has been achieved and is subject to the factors discussed above.
Note 4: Annual Dividend Yield is on a Trailing Twelve Month (TTM1) basis and are subject to change based on factors such as company performance, stock price changes, etc.
Note 5: Kalkine reports are prepared based on the stock prices captured either from REFINITIV or Trading View. Typically, REFINITIV or Trading View may reflect stock prices with a delay which could be a lag of 25-30 minutes. There can be no assurance that future results or events will be consistent with the information provided in the report. The information is subject to change without any prior notice.
Technical Indicators Defined: -
Support: A level at which the stock prices tend to find support if they are falling, and a downtrend may take a pause backed by demand or buying interest. Support 1 refers to the nearby support level for the stock and if the price breaches the level, then Support 2 may act as the crucial support level for the stock.
Resistance: A level at which the stock prices tend to find resistance when they are rising, and an uptrend may take a pause due to profit booking or selling interest. Resistance 1 refers to the nearby resistance level for the stock and if the price surpasses the level, then Resistance 2 may act as the crucial resistance level for the stock.
Stop-loss: It is a level to protect further losses in case of unfavourable movement in the stock prices.
This report (“Report”) has been issued by Kalkine New Zealand Limited (FSP691351) (NZBN:9429047678101) (“Kalkine”). Kalkine is a Financial Advice Provider (“FAP”) and is authorised by a Class 1 Financial Advice Provider Licence issued by Financial Markets Authority (“FMA”) to provide financial advice. Kalkine provides only general financial advice through its research reports following a person becoming a member. The reports contain buy/sell/hold and other recommendations in relation to equity securities, managed funds and other managed investment schemes and other financial advice products. The recommendations and opinions in this Report and on Kalkine website do not take into account any of your investment objectives, financial situation or needs. Before you make a decision about whether to acquire a financial product, you should obtain the Product Disclosure Statement from the product issuer. You should consider the appropriateness of advice taking into account your own objectives, financial situation and needs and seek independent financial advice before making any financial decisions. If you act on the advice in the research reports, you may have to pay fees, expenses or other amounts (but not to Kalkine).
The information in this Report and on the Kalkine website has been prepared from a wide variety of sources, which Kalkine, to the best of its knowledge and belief, considers accurate. Kalkine has made every effort to ensure the reliability of the information contained in its reports (including this Report), newsletters and websites. All information represents our views at the date of publication and may change without notice.
Kalkine does not issue, sell or deal in any financial products. The information in this Report does not constitute an offer to sell securities or other financial products or a solicitation of an offer to buy securities or other financial products. Our reports contain general recommendations to invest in securities and other financial products. Kalkine is not responsible for, and does not guarantee, the performance of, or returns on, any investments mentioned in this Report.
This Report may contain information on past performance of particular investments. Past performance is not a reliable indicator of future performance. Returns stated do not take into account transaction costs and taxes.
Further information about the complaints and dispute resolution process, as well as information about Kalkine’s duties are available on Kalkine’s website. Please read our Financial Advice Provider (FAP) disclosure statement and Complaints Handling Guide, which are available on the website.
Copyright 2025 Krish Capital Pty. Ltd. (ABN 61629651510). All Rights Reserved. No part of this Report, or its content, may be reproduced in any form without our prior consent.
Past performance is not a reliable indicator of future performance.
 Please wait processing your request...