
This report is an updated version of the report published on 12th June 2025 at 4:48 PM (GMT +12)
Company Overview:
Infratil Limited (NZX: IFT) owns renewable energy, transport, data and connectivity, and social infrastructure businesses in growth sectors. Genesis Energy Limited (NZX: GNE) is a NZ-owned energy company which fosters strong links with its customers and community stakeholders.
Kalkine’s Sector Report covers the Investment Highlights, Key Financial Metrics, Risks, Outlook, Technical Analysis along with the Valuation, Target Price, and Recommendation on the stock.
I. Sector Landscape and Outlook
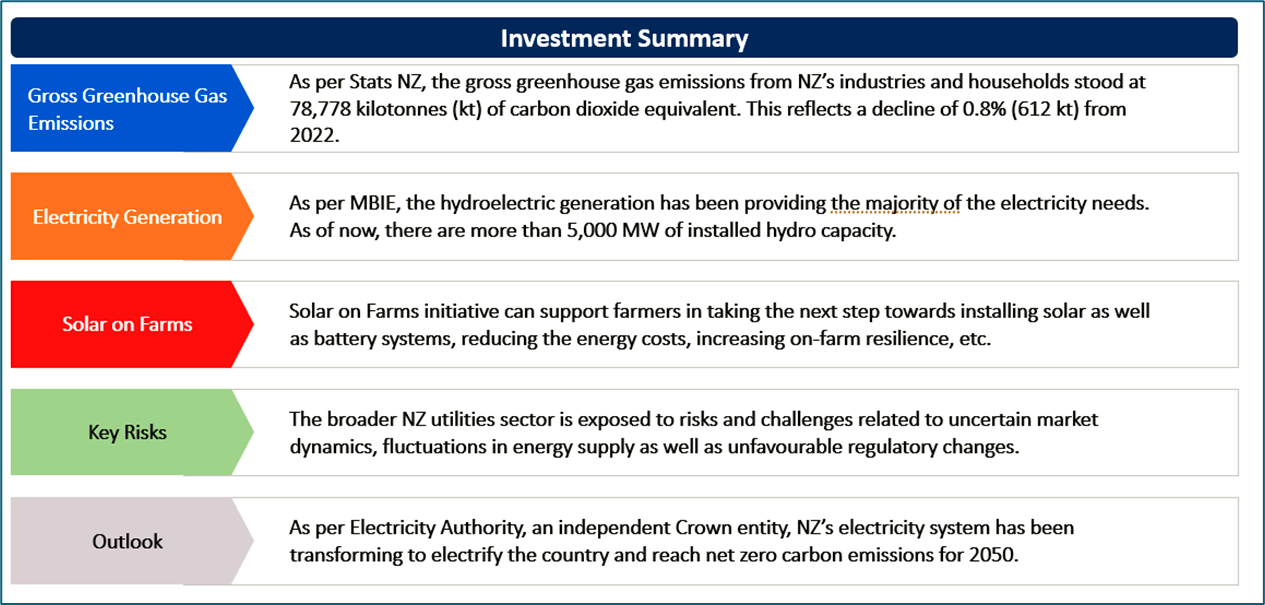
As per Stats NZ, the gross greenhouse gas emissions from NZ’s industries and households stood at 78,778 kilotonnes (kt) of carbon dioxide equivalent. This reflects a decline of 0.8% (612 kt) from 2022. The decline was because of a 1.0% decline (or 720 kt) in industry-related emissions. Notably, household emissions encountered a rise of 1.3% (107 kt) because of an increase in household transport emissions. The largest changes to industry emissions were witnessed in transport, postal and warehousing (up by 25.7% (1,343 kt) because of rail, water, air, and other transport), electricity, gas, water, and waste services (which declined 8.5%) (563 kt) due to water, sewerage, drainage, and waste services manufacturing), among others.
Notably, the emissions from industries stood 89.6% percent of the total, with remaining 10.4% from households. The emissions attributable to tourism in 2023 made up ~5.7% of total emissions. Between 2022 and 2023, the emissions intensity for the total of all industries witnessed a decline of 2.8%.
Exhibit 1: Indexes of Emissions (CO₂-e) By Industry and Households
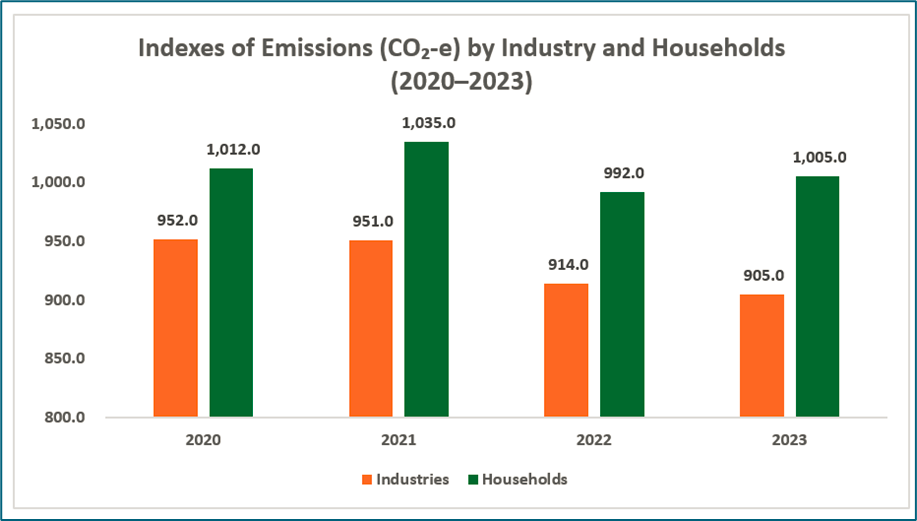
Data Source: This work is based on/includes Stats NZ’s data which are licensed by Stats NZ for reuse under the Creative Commons Attribution 4.0 International Licence; Chart Created by Kalkine Group
Electricity Generation
As per MBIE, the hydroelectric generation has been providing the majority of the electricity needs. As of now, there are more than 5,000 MW of installed hydro capacity. Most of it is found in the South Island. Geothermal generation has been an important part of NZ’s electricity landscape. Most of NZ’s installed capacity is located in the Taupo Volcanic Zone. Geothermal generation is ~15% of NZ’s electricity generation. MBIE also stated that wind generation witnessed a rapid growth as a source of electricity in NZ. While the first wind farm, Hau Nui, was commissioned in 1997, the wind generation now accounts for ~5% of NZ’s electricity generation. Most of NZ’s wind farms are located in the North Island.
Electricity generation from the combustion of coal, oil, and gas offers baseload, backup as well as peaker electricity supply.
Exhibit 2: Net Generation (GWh)
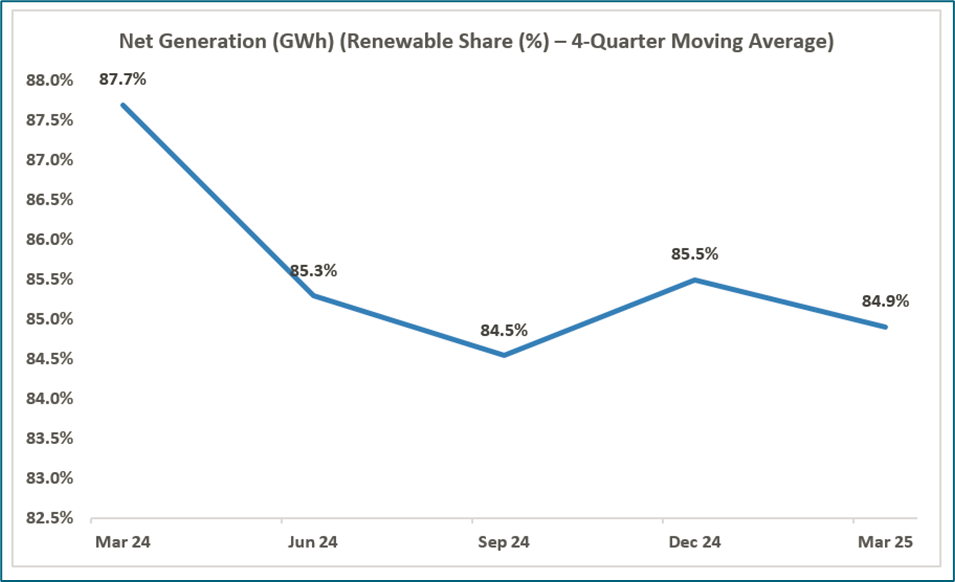
Data Source: This work is owned by the Ministry of Business, Innovation and Employment on behalf of the Crown which are licensed for reuse under the Creative Commons Attribution 4.0 International Licence; Chart Created by Kalkine Group
Farm Cost Savings Due to Solar
Energy Minister Simon Watts made an announcement about government’s new Solar on Farms initiative. This is expected to support farmers in taking the next step towards installing solar as well as battery systems, reducing the energy costs, increasing on-farm resilience as well as enabling farmers to gain enhanced control over the power use, resulting in improved efficiency and productivity. NZ farms, mainly the ones using irrigation and other energy-intensive systems, have been witnessing increased energy costs. On-farm solar and batteries are expected to reduce pressure through improving self-sufficiency and reducing the exposure to increased energy prices, mainly in rural and remote areas.
Key Risks and Challenges:
As per the recent FEU dated 6 June 2025, the global trade developments continue to have mixed impact on domestic economic indicators, with increased trade barriers and elevated uncertainty levels resulting in slowing global growth. Notably, the trade protection has been adding to inflationary pressures and global inflation is expected to slow more gradually as compared to the previous expectations. Overall, the broader NZ utilities sector is exposed to risks and challenges related to uncertain market dynamics, fluctuations in energy supply as well as unfavourable regulatory changes.
Exhibit 3. Key Risks in Utilities Sector:
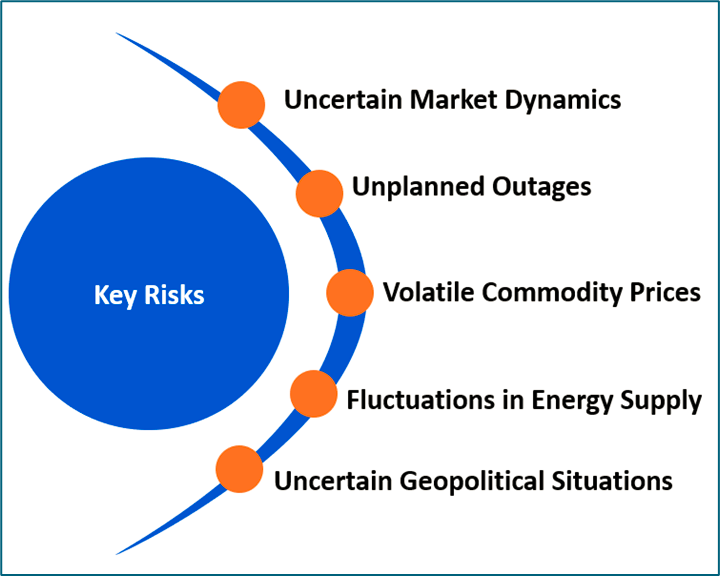
Source: - Analysis: Kalkine Group
Outlook:
As per Electricity Authority, an independent Crown entity, NZ’s electricity system has been transforming to electrify the country and reach net zero carbon emissions for 2050. The electricity market continues to pivot to more renewable intermittent generation (such as wind and solar), with new and many technological advancements, mass participation and 2-way power flows. Notably, the electricity demand can increase by up to 82% by 2050 (baseline 2013). Moving forward, the consumers are expected to have increased control on the electricity use, widespread usage of EVs, and battery storage and smart chargers to help in stabilising the grid.
As NZ’s electricity regulator, the changes that are taking place need proactive and fit-for-purpose regulation. This will help consumers reap the benefits of innovation and competition at least cost, while, at the same time, getting a reliable electricity supply.
from the sector-specific factors, an analysis on 2 NZX-listed companies is provided. This report covers their insights, outlook, performance and potential as expected to be delivered in the near to medium term.
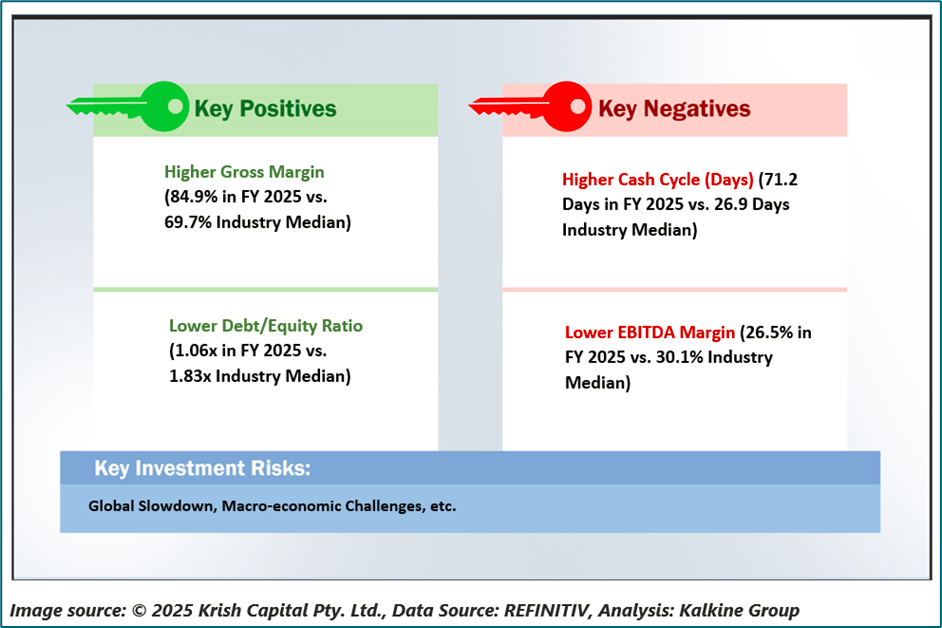
1) Infratil Limited (NZX: IFT) (Recommendation: Buy, Potential Upside: Low Double-Digit) (M-Cap: NZD 9.9 Bn, Annual Dividend Yield: ~2.01%)
Business Description:
Infratil Limited (NZX: IFT) is a NZ-based global infrastructure investment company.
Outlook:
The company is well-placed for robust multi-year growth as data centre demand has been expanding. With the global demand for fit-for-purpose AI infrastructure ramping up, Australia and New Zealand have been emerging as critical destinations. CDC remains favourably placed, benefitting from geopolitical trust, energy stability as well as regulatory certainty. In order to support future growth, CDC started construction at Marsden Park, one of the leading data centre campuses in the Southern Hemisphere, and Laverton, its 2nd campus in Victoria, possessing the potential to add ~1GW of capacity between them.
Technical Overview:
Technical Commentary:
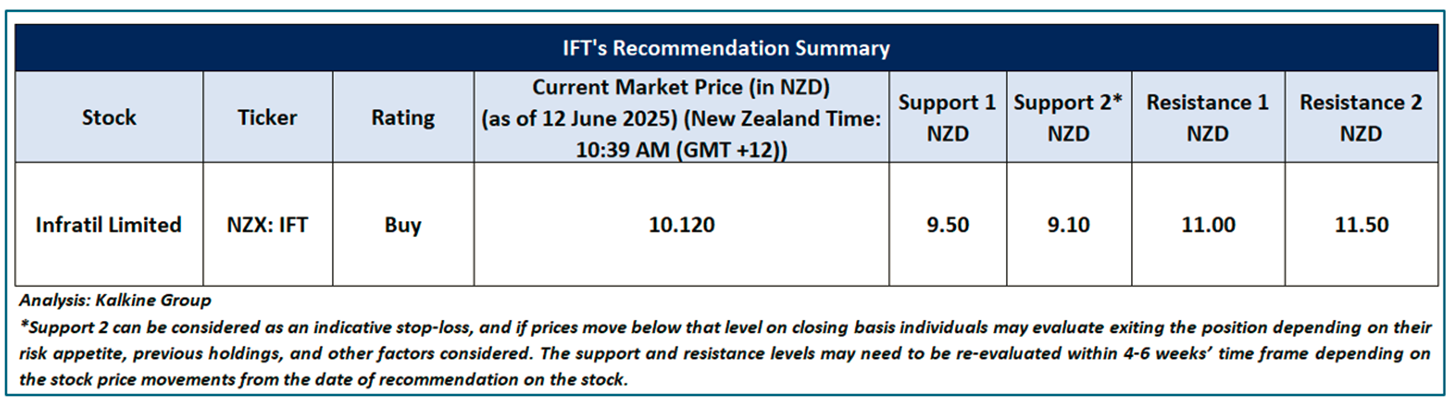
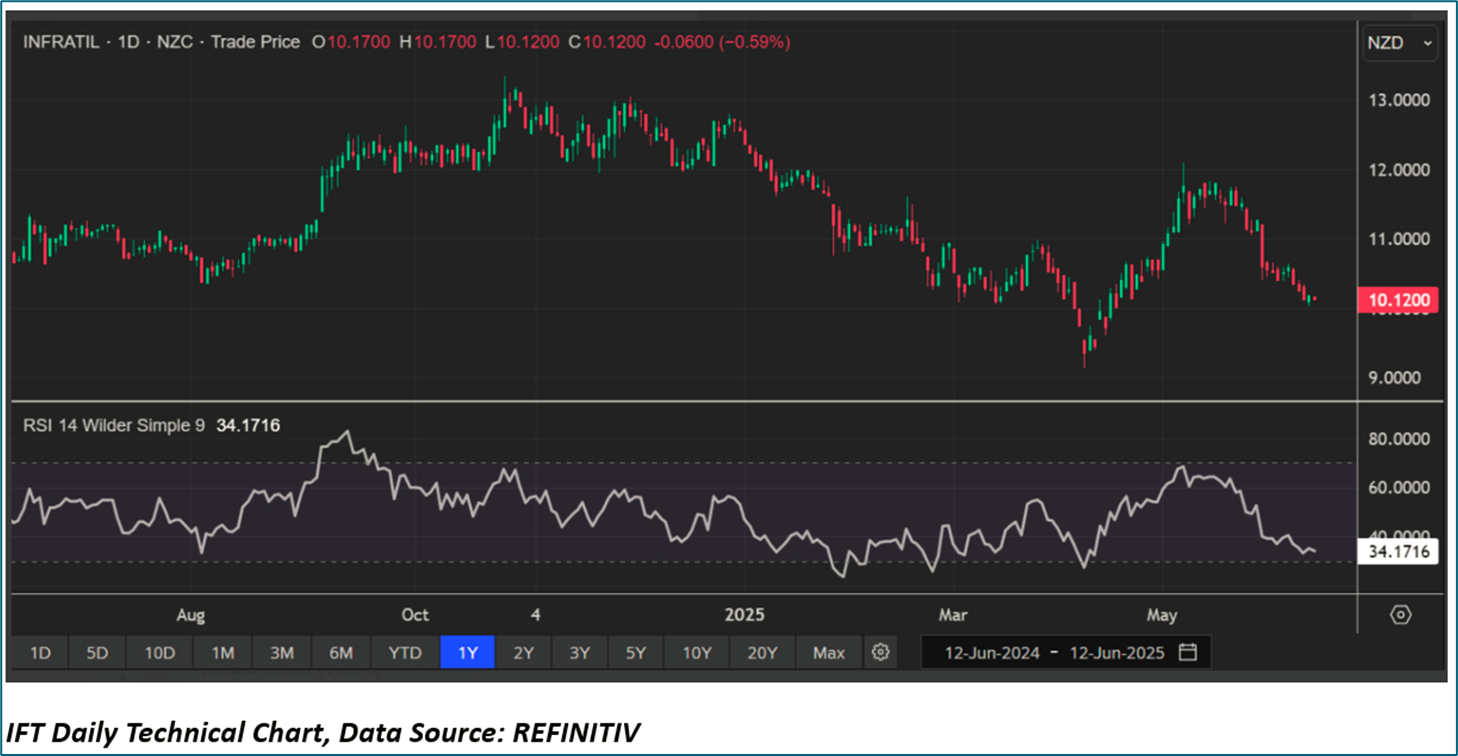
On the daily chart, IFT’s stock prices are forming a trading range characterized by lower highs and higher lows, suggesting that the sideways period in the stock might continue to remain in place in the near term. Moreover, the momentum oscillator RSI (14-period) is fluctuating between the levels of 30 and 70, providing more evidence to the mentioned recommendation. Prices are trading between its previous peak and trough, which might function as resistance and support levels for the stock, respectively. A significant support level for the stock is placed at NZD 9.50, while critical resistance level is positioned at NZD 11.00.
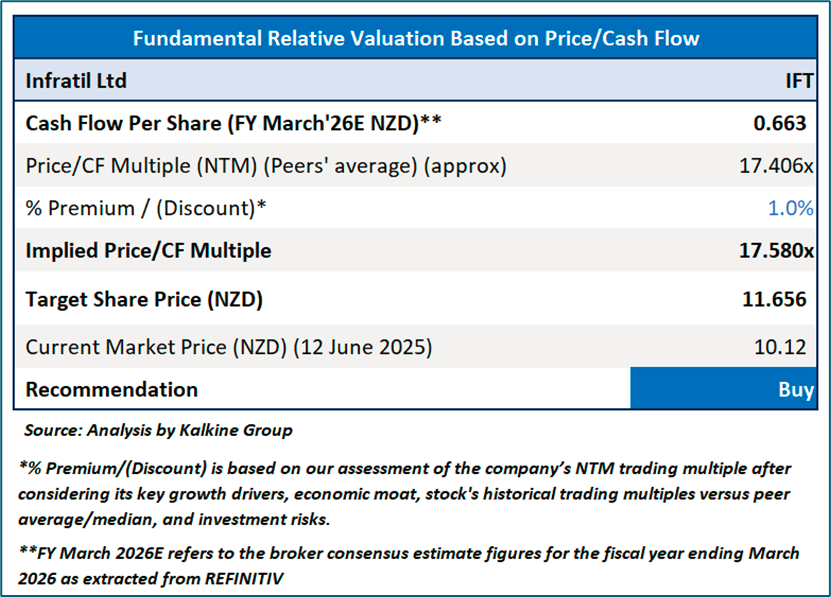
Fundamental Valuation
P/E Based Relative Valuation
Stock Recommendation
Considering the facts above, a ‘Buy’ recommendation on the stock has been provided at the current market price of NZD 10.12 per share (New Zealand Time: 10:39 AM (GMT +12)) as on 12 June 2025.
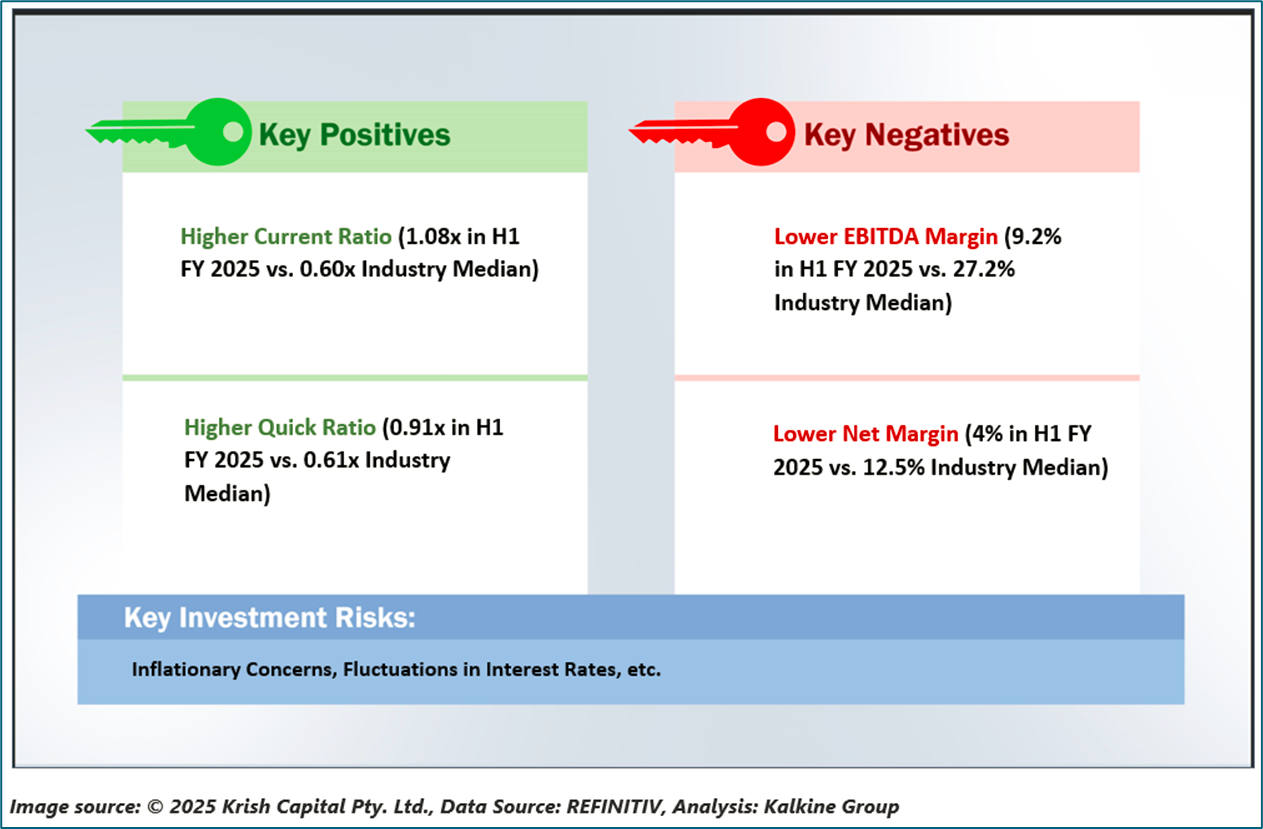
2) Genesis Energy Limited (Recommendation: Hold, Potential Upside: Low Double-Digit) (M-Cap: NZD 2.5 Bn, Annual Dividend Yield: 8.57%)
Business Description:
Genesis Energy Limited (NZX: GNE) is a New Zealand-based diversified energy company.
Outlook:
GNE is consolidating its 3 retail brands, Genesis, Frank, and Ecotricity, in a single, unified Genesis brand. This is expected to simplify the customer experience, improve the operational efficiency as well as accelerate delivery of innovative energy solutions. Furthermore, the company’s Chief Revenue Officer stated that decision reflects GNE’s Gen35 strategy of offering a stronger and simpler retail offer which helps the customer-led transition to more renewable forms of energy. In Q3, retail managed to accelerate the strategy in order to simplify product offerings, improve customer service as well as reduce the operational costs.
Technical Overview:
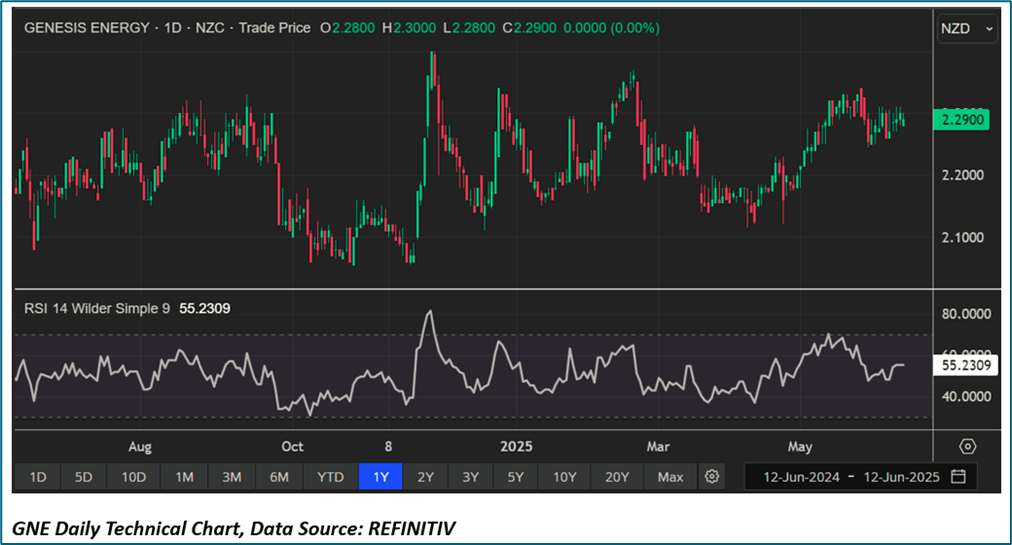
Technical Commentary
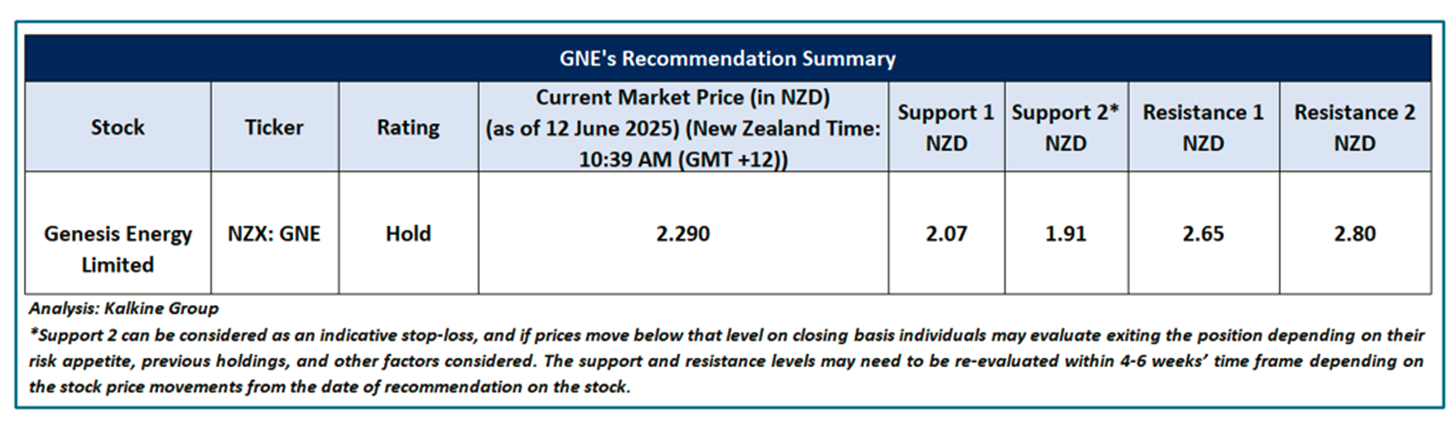
On the daily chart, GNE’s stock prices are forming a trading range characterized by a symmetrical triangle, suggesting that the sideways period in the stock might continue to persist in the near future. Moreover, the momentum oscillator RSI (14-period) is trading near its midpoint, adding further support to the previous observation. Prices are trading between its previous peak and trough, which might function as resistance and support levels for the stock, respectively. A significant support level for the stock is placed at NZD 2.07, while critical resistance level is positioned at NZD 2.65
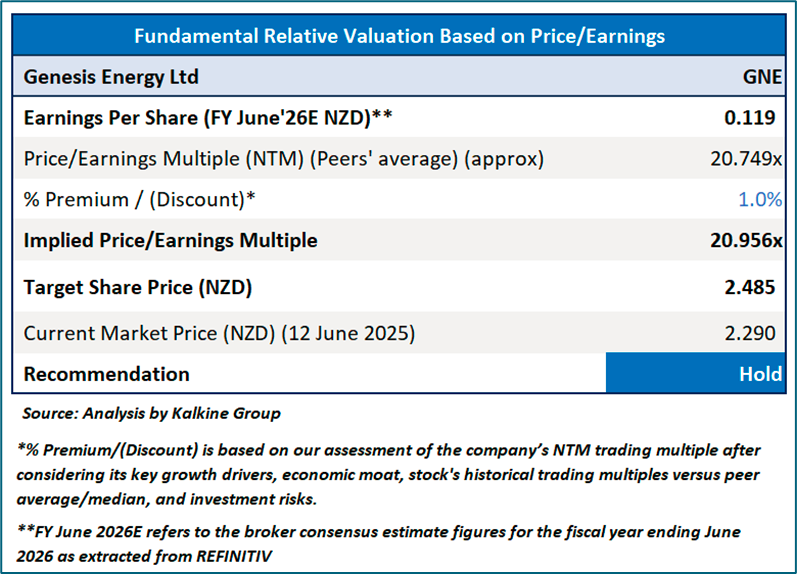
P/E Based Relative Valuation
Stock Recommendation
Considering the aforementioned factors, a “Hold” rating is given on the stock at the current market price of NZD 2.29 per share (New Zealand Time: 10:39 AM (GMT +12)) as on 12 June 2025.
Markets are trading in a highly volatile zone currently due to certain macro-economic issues and geopolitical tensions prevailing. Therefore, it is prudent to follow a cautious approach while investing.
Note 1: Past performance is neither an indicator nor a guarantee of future performance.
Note 2: The reference date for all price data, currency, technical indicators, support, and resistance levels is 12 June 2025. The reference data in this report has been partly sourced from REFINITIV.
Note 3: Investment decisions should be made depending on an individual's appetite for upside potential, risks, holding duration, and any previous holdings. An 'Exit' from the stock can be considered if the Target Price mentioned as per the Valuation and or the technical levels provided has been achieved and is subject to the factors discussed above.
Note 4: Kalkine reports are prepared based on the stock prices captured either from REFINITIV or Trading View. Typically, REFINITIV or Trading View may reflect stock prices with a delay which could be a lag of 25-30 minutes. There can be no assurance that future results or events will be consistent with the information provided in the report. The information is subject to change without any prior notice.
Technical Indicators Defined: -
Support: A level at which the stock prices tend to find support if they are falling, and a downtrend may take a pause backed by demand or buying interest. Support 1 refers to the nearby support level for the stock and if the price breaches the level, then Support 2 may act as the crucial support level for the stock.
Resistance: A level at which the stock prices tend to find resistance when they are rising, and an uptrend may take a pause due to profit booking or selling interest. Resistance 1 refers to the nearby resistance level for the stock and if the price surpasses the level, then Resistance 2 may act as the crucial resistance level for the stock.
Stop-loss: It is a level to protect further losses in case of unfavourable movement in the stock prices.
Disclaimer This report has been issued by Kalkine New Zealand Limited (FSP691351) (NZBN:9429047678101) (“Kalkine”). Kalkine is a Financial Advice Provider (“FAP”) and is authorised by a Class 1 Financial Advice Provider Licence issued by Financial Markets Authority (“FMA”) to provide financial advice. Kalkine provides only general financial advice through its research reports following a person becoming a member. The reports contain buy/sell/hold and other recommendations in relation to equity securities, managed funds and other managed investment schemes and other financial advice products. The recommendations and opinions in this report and on Kalkine website do not take into account any of your investment objectives, financial situation or needs. Before you make a decision about whether to acquire a financial product, you should obtain the Product Disclosure Statement from the product issuer. You should consider the appropriateness of advice taking into account your own objectives, financial situation and needs and seek independent financial advice before making any financial decisions. If you act on the advice in the research reports, you may have to pay fees, expenses or other amounts (but not to Kalkine). Further information about the complaints and dispute resolution process, as well as information about Kalkine’s duties are available on Kalkine’s website. Please read our Financial Advice Provider (FAP) disclosure statement and Complaints Handling Guide, which are available on the website.
Past performance is not a reliable indicator of future performance.
 Please wait processing your request...