
This report is an updated version of the report published on 6 August 2025 at 11:10 AM AEST.
Section 1: Company Overview and Fundamental Insights
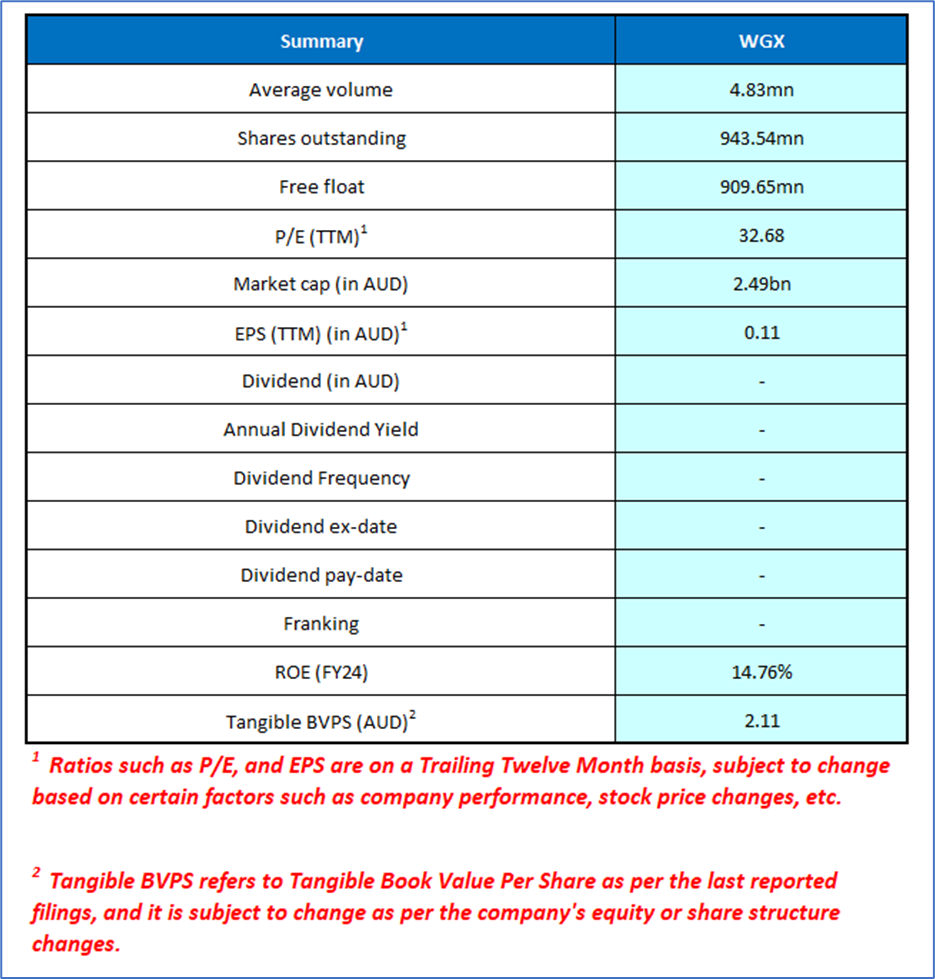
1.1 Company Overview: Westgold Resources Limited (ASX: WGX) operates an integrated portfolio of underground and open pit gold mines, along with processing facilities, primarily located in Western Australia's Murchison and Southern Goldfields. Westgold’s operations include significant assets such as Beta Hunt, Bluebird-South Junction, Big Bell, and Starlight, complemented by infrastructure and ongoing exploration programs. Kalkine’s Resources Report covers the Investment Highlights, Management Insights, Key Financial Metrics, Risks, Technical Analysis along with the Valuation, Target Price, and Recommendation on the stock.
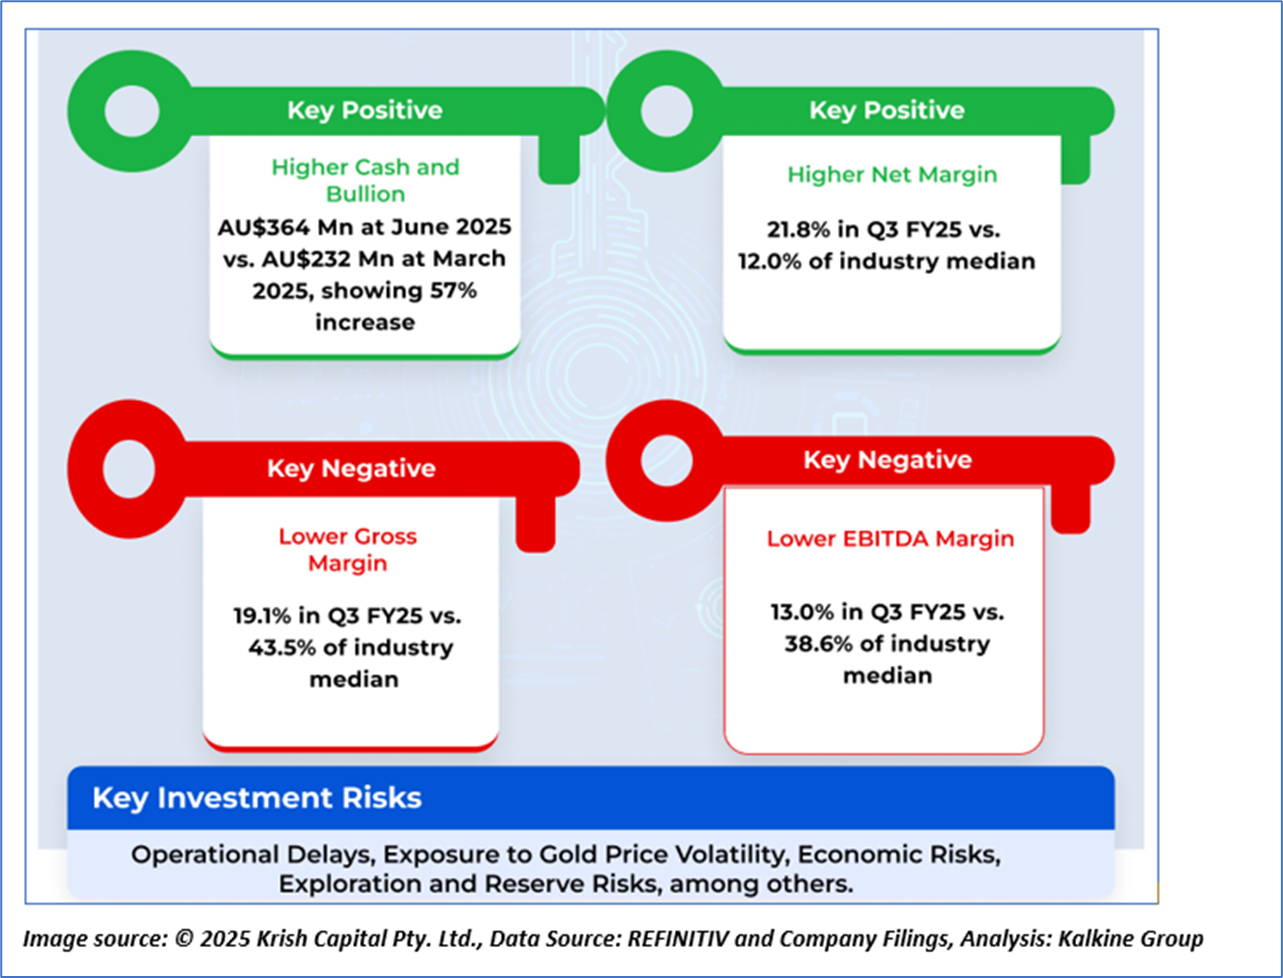
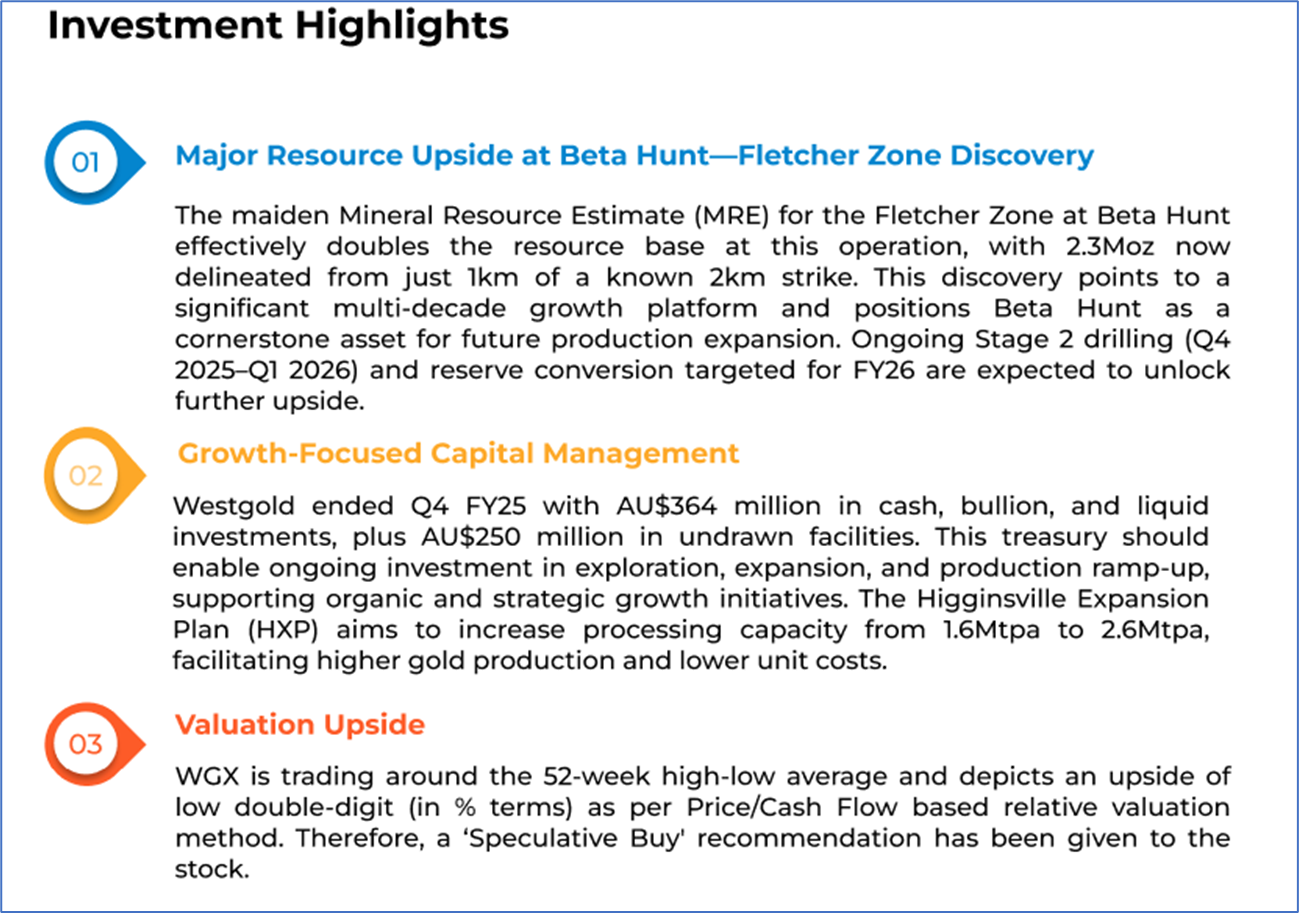
1.2 The Key Positives, Negatives, Investment Highlights, and Management Insights
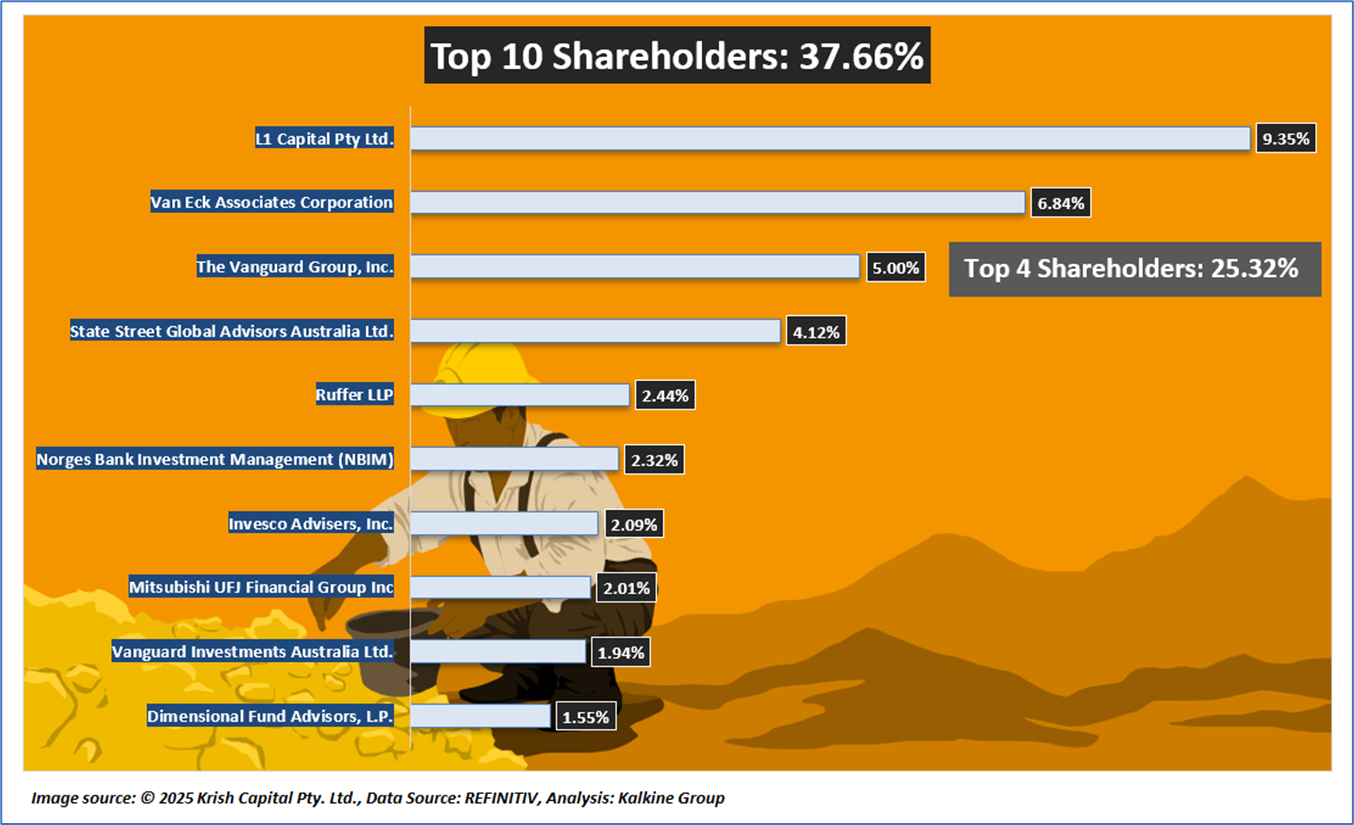
1.3 Top 10 Shareholders:
The top 10 shareholders together form 37.66% of the total shareholding. L1 Capital Pty Ltd. and Van Eck Associates Corporation hold maximum stakes in the company at 9.35% and 6.84%, respectively.
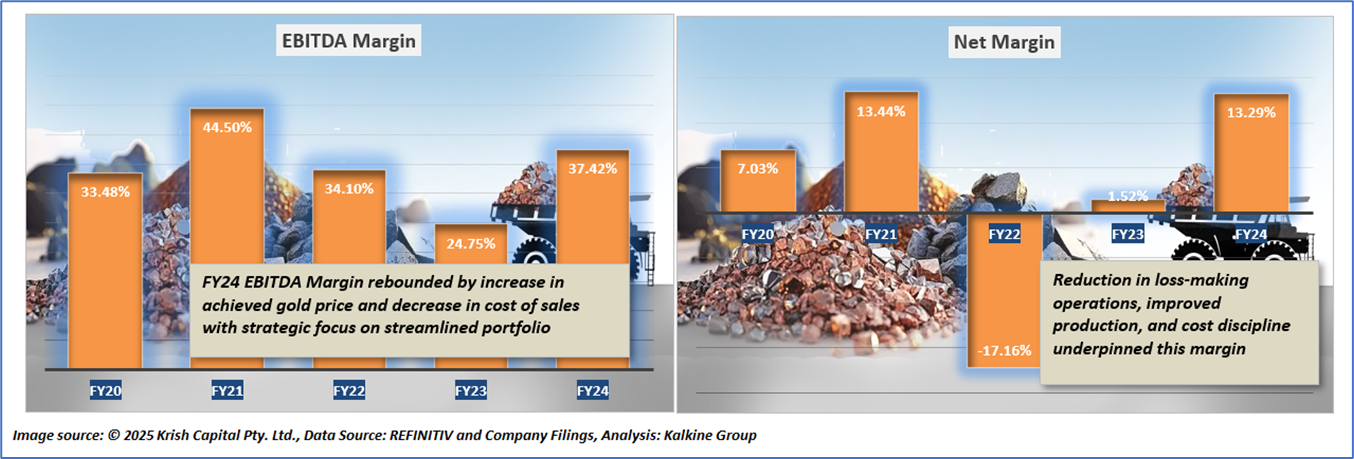
1.4 Key Metrics: The trend in EBITDA margin and net margin for Westgold Resources from FY20 to FY24 reflected both operational improvements and transient headwinds. As strategic initiatives—including mine portfolio changes and the closure of high-cost operations—took effect, EBITDA and net margins strengthened through FY23–FY24, driven by improved productivity and operational cost control, as well as higher realized gold prices. The dip in net margin was observed in H1 FY25 due to substantial one-off acquisition costs related to the Karora merger and higher operating costs, resulting in a net loss after tax for the period. Despite these headwinds, management expects margins to improve in the second half of FY25, citing anticipated production growth, cost optimization measures, and returns on recent capital investments, positioning WGX for stronger profitability moving forward. Below are some key metrics that have been recorded:
Section 2: Business Updates, Financial and Operational Highlights
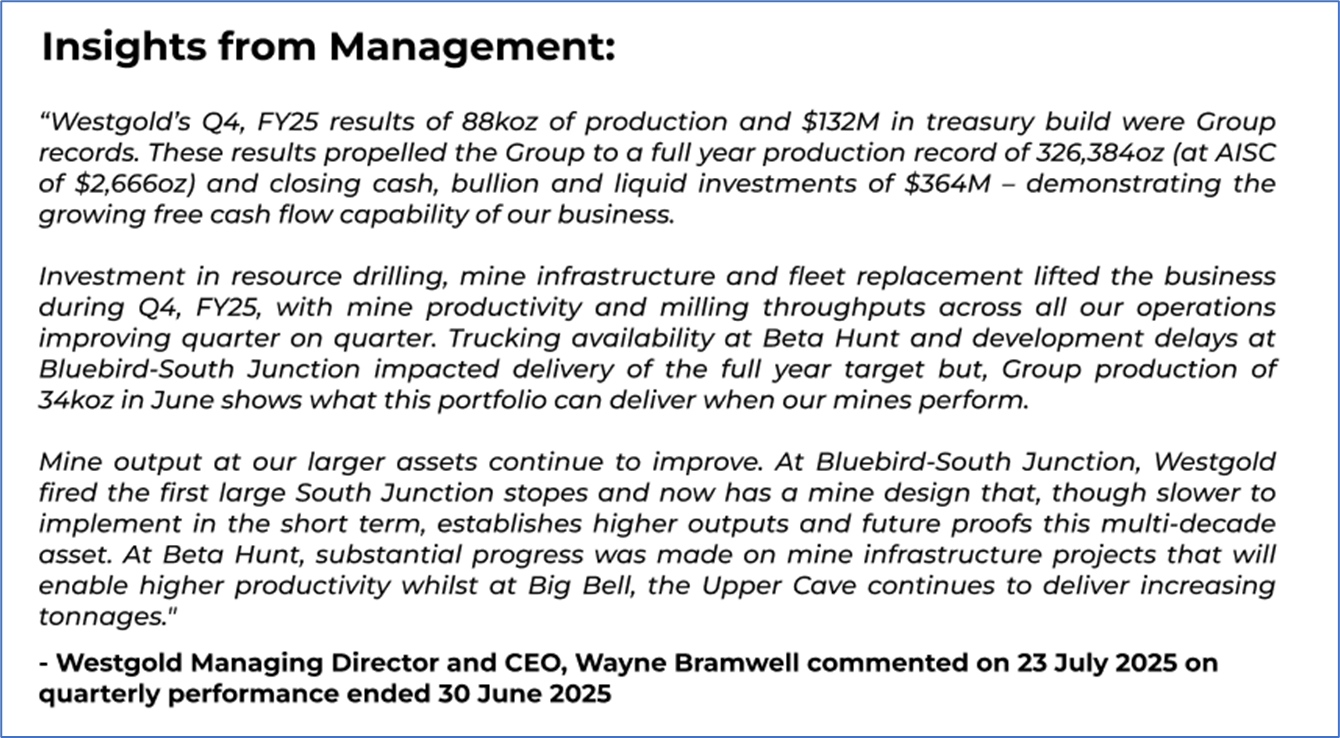
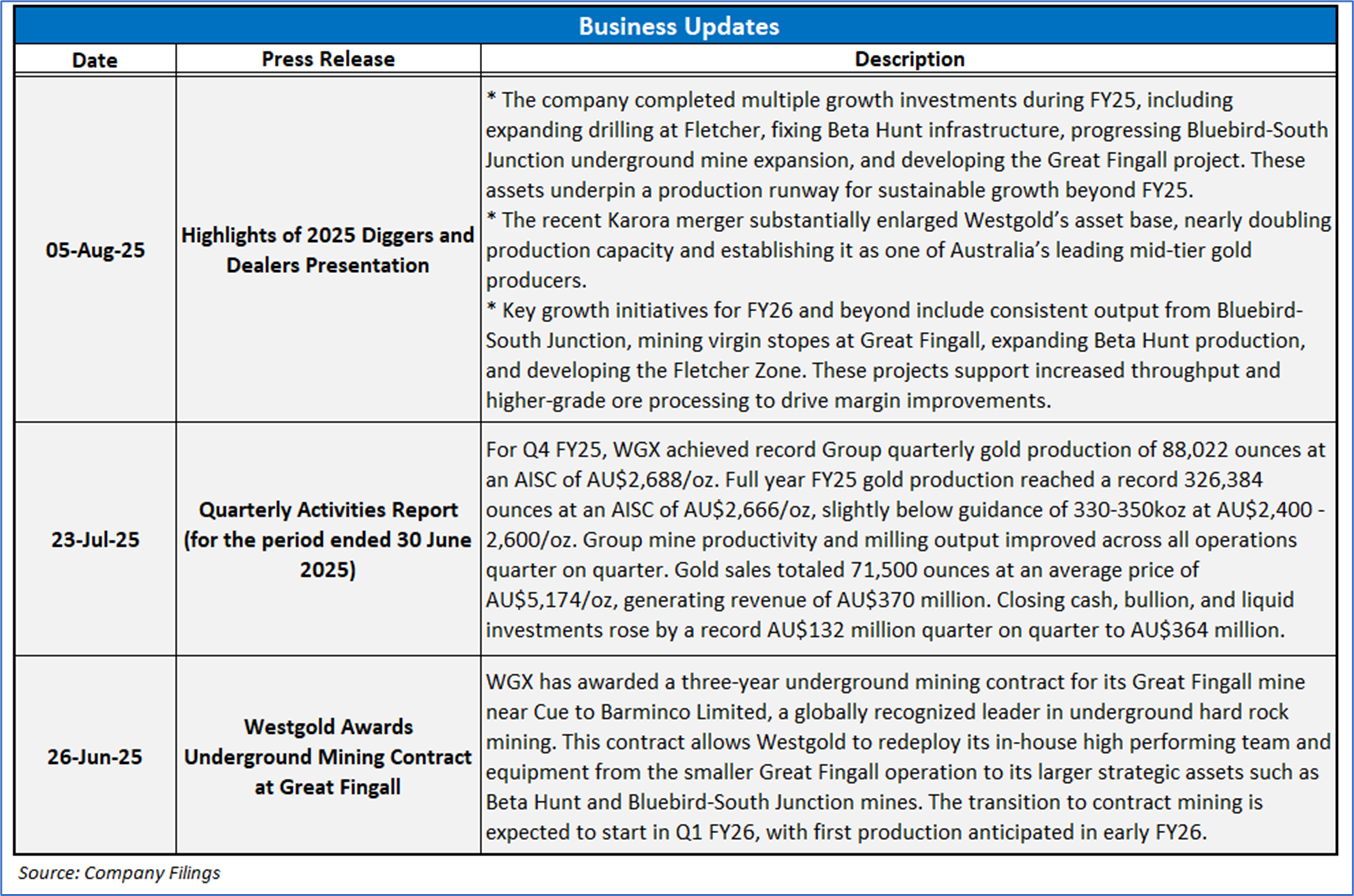
2.1 Recent Business Updates:
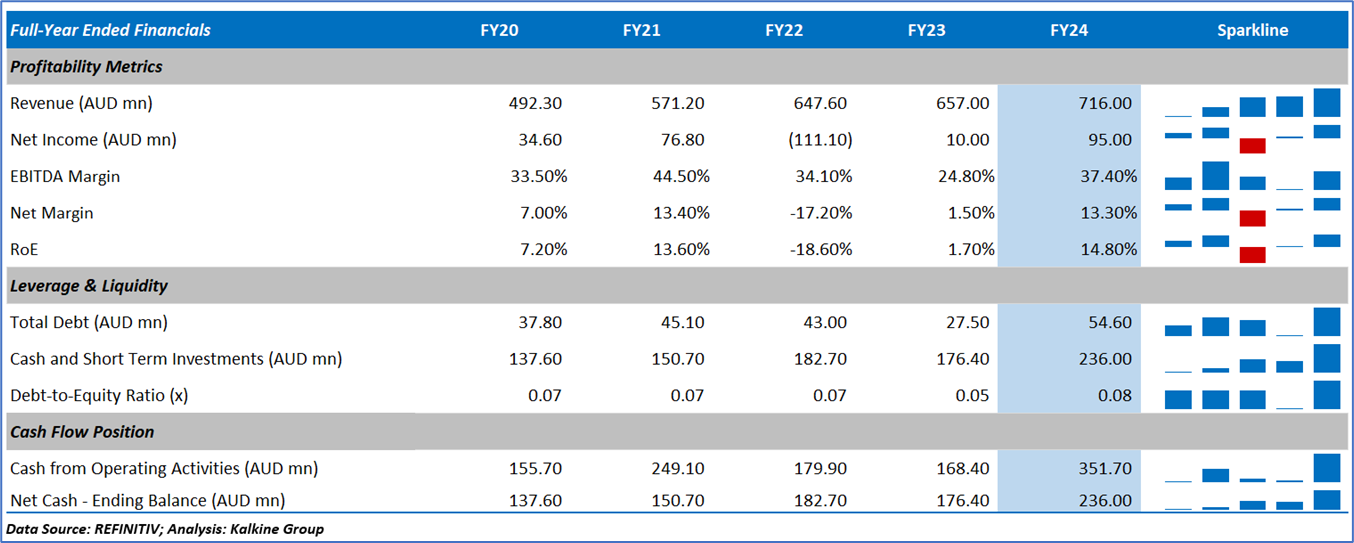
2.2 Financial Highlights: Below mentioned are some key financial highlights:

2.3 Historical Financial Trend
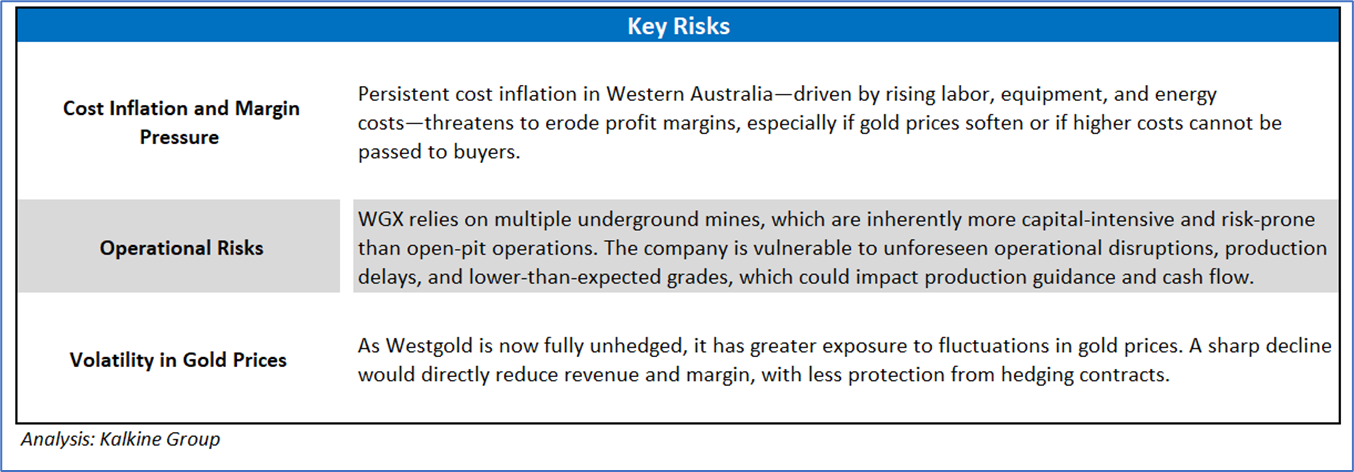
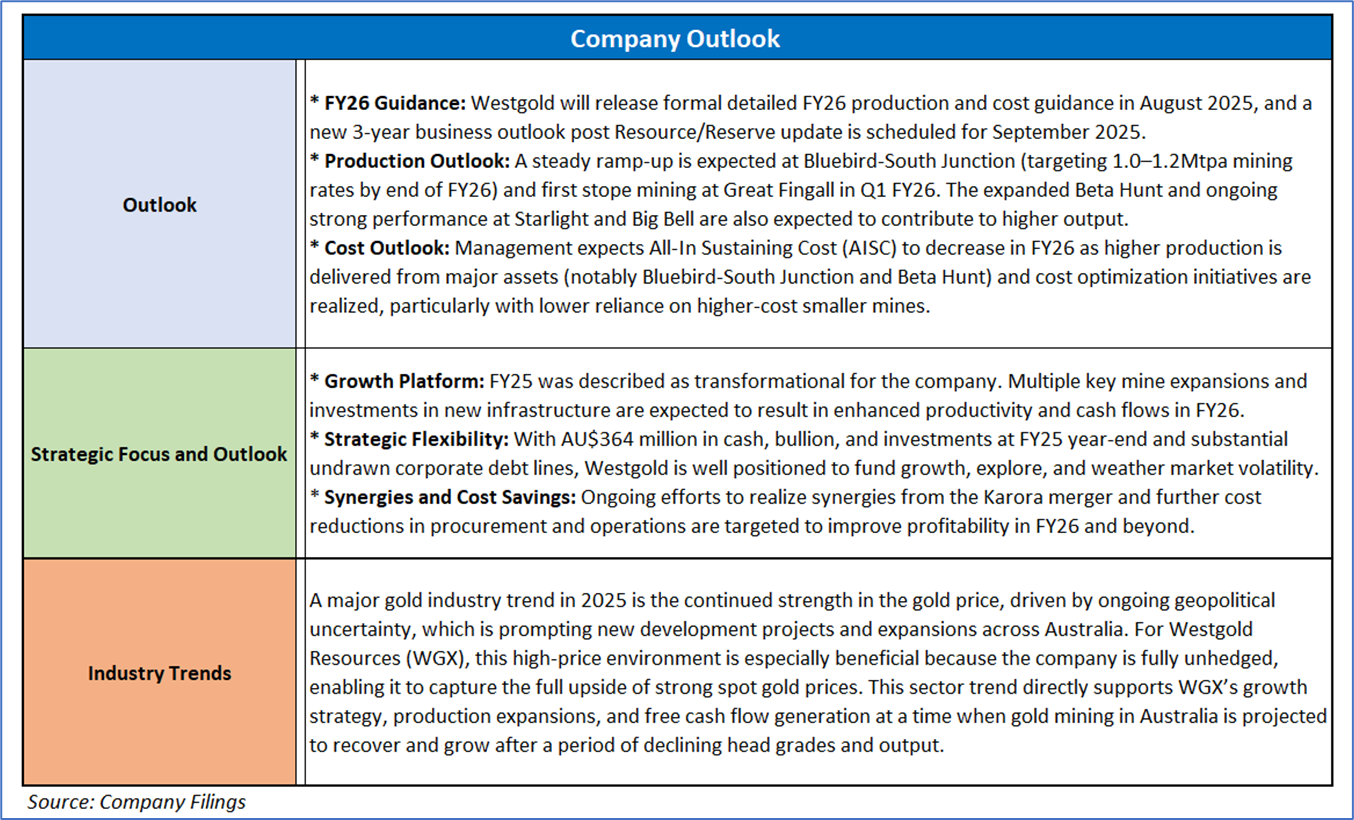
Section 3: Key Risks and Outlook:
Section 4: Stock Recommendation Summary
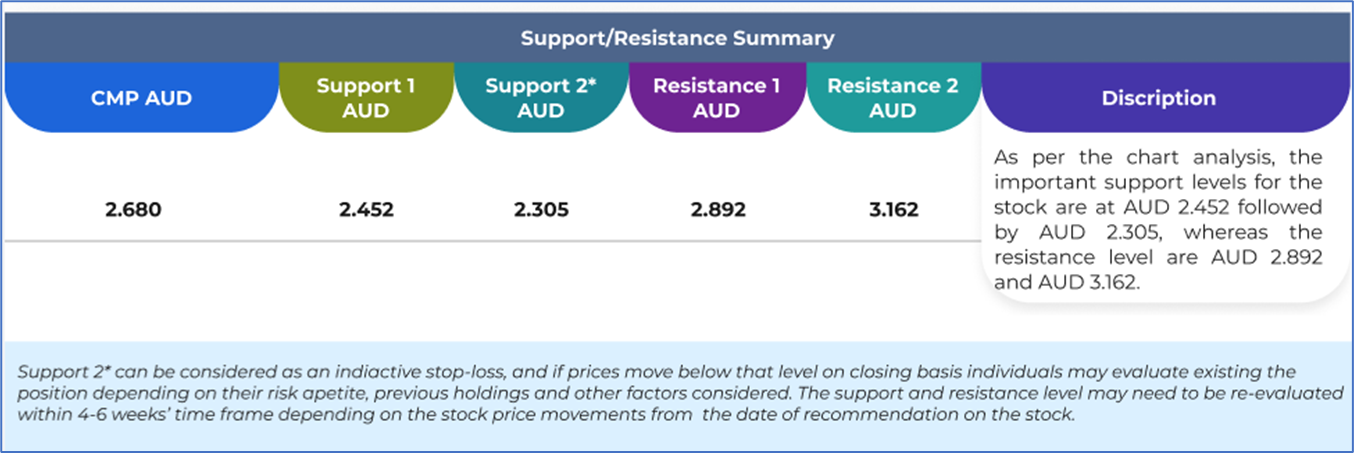
4.1 Price Performance and Technical Summary
The stock price has corrected by approximately 2.19% over the past 1-month and has increased by around 6.77% over the last 6 months. The stock has a 52-week low and 52-week high of AUD 2.210 and AUD 3.380, respectively, and is currently trading around its 52-week high-low average.
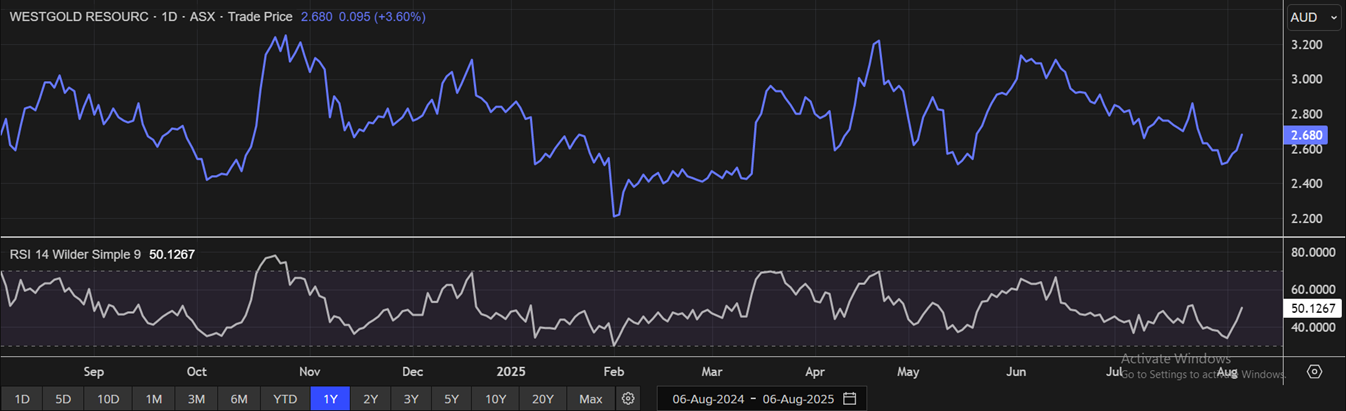
(Source: REFINITIV; Analysis by Kalkine Group)
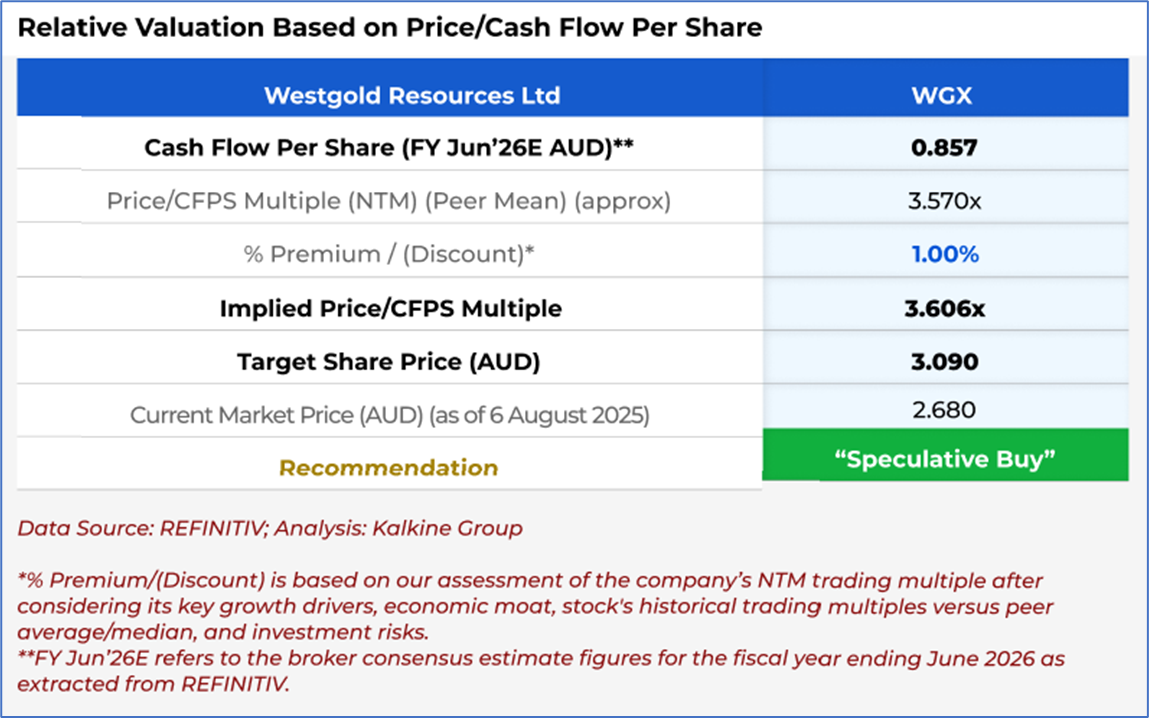
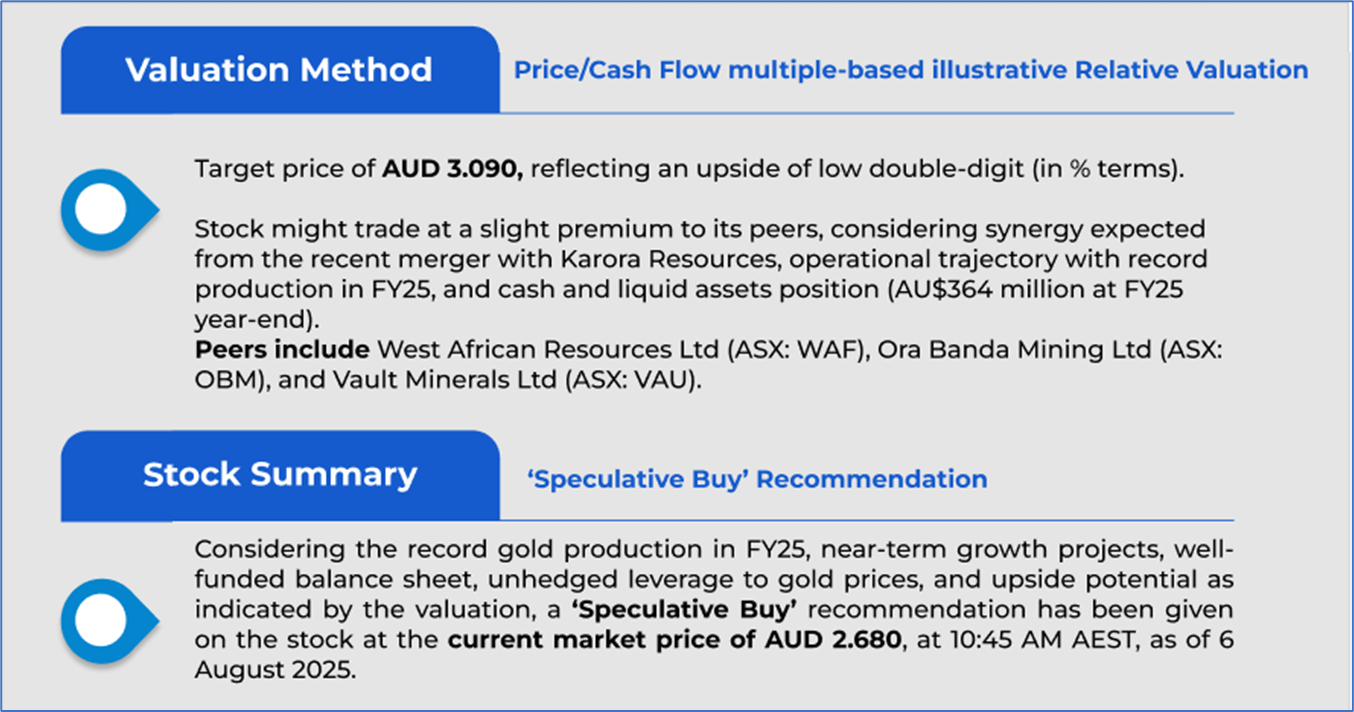
4.2 Fundamental Valuation
Valuation Methodology: Price/Cash Flow Multiple Based Relative Valuation (Illustrative)
Markets are trading in a highly volatile zone currently due to certain macro-economic issues and geopolitical tensions prevailing. Therefore, it is prudent to follow a cautious approach while investing.
Note 1: Past performance is neither an indicator nor a guarantee of future performance.
Note 2: The reference date for all price data, currency, technical indicators, support, and resistance levels is 6 August 2025. The reference data in this report has been partly sourced from REFINITIV.
Note 3: Investment decisions should be made depending on an individual's appetite for upside potential, risks, holding duration, and any previous holdings. An 'Exit' from the stock can be considered if the Target Price mentioned as per the Valuation and or the technical levels provided have been achieved and is subject to the factors discussed above.
Note 4: Kalkine reports are prepared based on the stock prices captured either from REFINITIV or Trading View. Typically, REFINITIV or Trading View may reflect stock prices with a delay which could be a lag of 25-30 minutes. There can be no assurance that future results or events will be consistent with the information provided in the report. The information is subject to change without any prior notice.
Technical Indicators Defined: -
Support: A level at which the stock prices tend to find support if they are falling, and a downtrend may take a pause backed by demand or buying interest. Support 1 refers to the nearby support level for the stock and if the price breaches the level, then Support 2 may act as the crucial support level for the stock.
Resistance: A level at which the stock prices tend to find resistance when they are rising, and an uptrend may take a pause due to profit booking or selling interest. Resistance 1 refers to the nearby resistance level for the stock and if the price surpasses the level, then Resistance 2 may act as the crucial resistance level for the stock.
Stop-loss: It is a level to protect further losses in case of unfavourable movement in the stock prices.
Disclaimer This report has been issued by Kalkine New Zealand Limited (FSP691351) (NZBN:9429047678101) (“Kalkine”). Kalkine is a Financial Advice Provider (“FAP”) and is authorised by a Class 1 Financial Advice Provider Licence issued by Financial Markets Authority (“FMA”) to provide financial advice. Kalkine provides only general financial advice through its research reports following a person becoming a member. The reports contain buy/sell/hold and other recommendations in relation to equity securities, managed funds and other managed investment schemes and other financial advice products. The recommendations and opinions in this report and on Kalkine website do not take into account any of your investment objectives, financial situation or needs. Before you make a decision about whether to acquire a financial product, you should obtain the Product Disclosure Statement from the product issuer. You should consider the appropriateness of advice taking into account your own objectives, financial situation and needs and seek independent financial advice before making any financial decisions. If you act on the advice in the research reports, you may have to pay fees, expenses or other amounts (but not to Kalkine). Further information about the complaints and dispute resolution process, as well as information about Kalkine’s duties are available on Kalkine’s website. Please read our Financial Advice Provider (FAP) disclosure statement and Complaints Handling Guide, which are available on the website.
Past performance is not a reliable indicator of future performance.
 Please wait processing your request...