
Company Overview: A leading Infrastructure Company, Vector Limited (NZX: VCT) owns and manages a portfolio of energy and fibre optic infrastructure networks in New Zealand. It provides electricity and gas distribution and transmission, electricity and gas metering installation and data management services, natural gas & LPG, and fibre optic networks in Auckland and Wellington. The Company's electricity lines and cables deliver power to around 544,510 homes and businesses on behalf of electricity retailers and maintains and operates around 1.5 million electricity and gas meters. The Company's gas brand, OnGas, promotes both piped and bottled gas supply to customers throughout New Zealand.
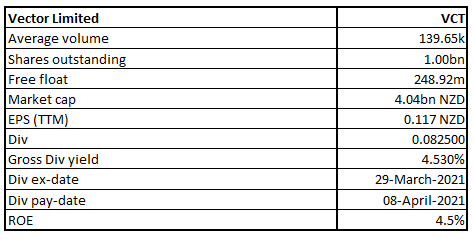
Vector Limited (NZX: VCT) is New Zealand’s leading network infrastructure company which runs a portfolio of businesses delivering energy and communication services to more than one million homes and commercial customers throughout the country. The market capitalisation of the company stood at ~$4.04 billion on 2nd August 2021.
Looking at the past performance, VCT’s topline for FY16-20 grew with a compounded annual growth rate (CAGR) of 3.11%. Its total revenue for FY20 stood at $1,294.0 million, as compared to $1,144.6 million in FY16.
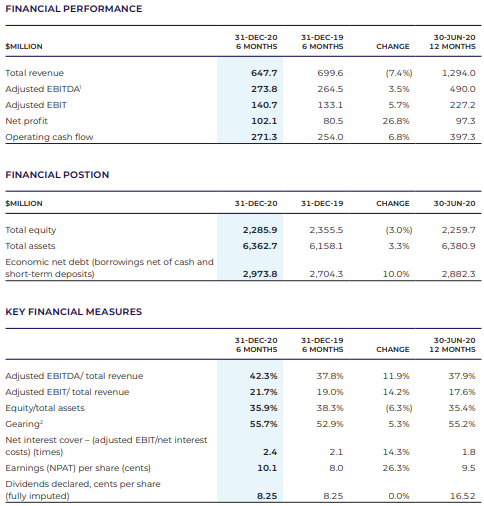
Exhibit 1: Operating Performance
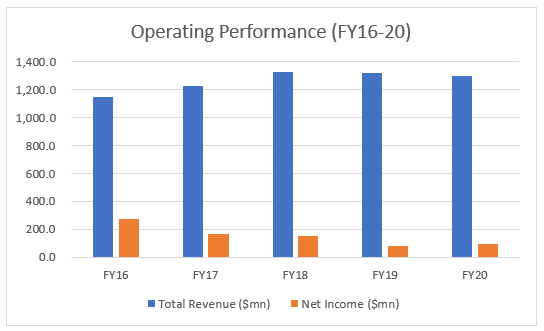
(Source: Company Reports, Analysis by Kalkine Group)
Operational Performance (For Nine Months ended 31 March 2021)
Increase in Electricity Connection Numbers: Total electricity connection numbers for 9 months ended 31 March 2021, grew by 1.7% to 588,018, as compared to the previous corresponding period (pcp). Electricity volume for the nine-month period, declined by 1.6% as compared to pcp, mainly due to reduced activity from the industrial and commercial sectors due to COVID-19.
Increase in Gas Network Customers: Gas distribution network customers increased by 2.1% in total connections to 116,014, mainly because of the continued growth of Auckland. However, Gas distribution volume over the period was down 2.8% on pcp, due to reduced activity from the industrial and commercial sectors. Natural gas, LPG volumes as well as Liquigas LPG tolling are down on the March 2020 comparative period, and 35.3% reduction in natural gas volumes was mainly because of the loss of large customer in January 2020.
Increase in Metering Business: The company’s metering business continued to show resilience both in New Zealand and Australia. Advanced meter numbers increased by 8.7% YoY during the period with a total fleet of 1,822,510. It has installed more than 360,000 advanced meters in Australia.
Initiatives to Improve Network Resilience: Due to significant initiatives to improve network resilience, System Average Interruption Duration Index (SAIDI) minutes for the twelve months ended 31 March 2021, was 21.5% lower than the previous year, despite ongoing challenges caused by weather events, traffic congestion and vegetation.
Results Performance (Half-Year ended 31 December 2020 – H1FY21)
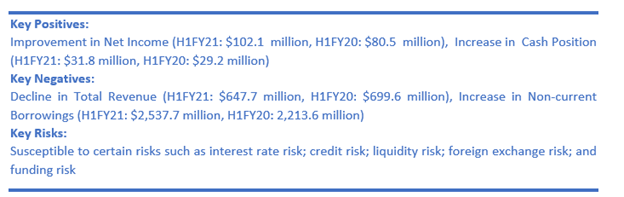
NPAT Improved Despite Pandemic: Despite the uncertainties that have arisen due to COVID-19, the company’s net profit from continuing operations for the period stood at $102.1 million, an increase of 26.8% on the previous corresponding period (pcp). However, its revenue for the first-half period stood at $647.66 million, a decline of 7.4% on pcp which was negatively impacted by the new Commerce Commission DPP3 regulatory settings.
Adjusted EBITDA Up by 3.5% (on PCP): Adjusted EBITDA for the interim period stood at $273.8 million, an increase of 3.5% on pcp which was positively impacted by continued focus on business resilience and Symphony strategy. Net tangible assets per share for the period stood at $0.974, as compared to $0.993 in the pcp. The Board declared an interim dividend of 8.25 cents per share at an imputation rate of 10.5%.
Strength in Balance Sheet: The company’s cash balance at the end of the period stood at $31.8 million, as compared to $29.2 million in the previous half year period. Total assets at the end of the period stood at $6,362.7 million , as compared to $6,158.1 million in the previous half year. Its total liabilities at the end of the period stood at $4,076.8 million, as compared to $3,802.6 million in the previous half year.
Exhibit 2: Key Metrics
Key Data (Source: Company Reports)
Top 10 Shareholders: The top 10 shareholders have been highlighted in the pie chart, which together form around 76.95% of the total shareholding. Entrust is holding maximum stake in the company at 75.10%.
Exhibit 3: Top 10 Shareholders
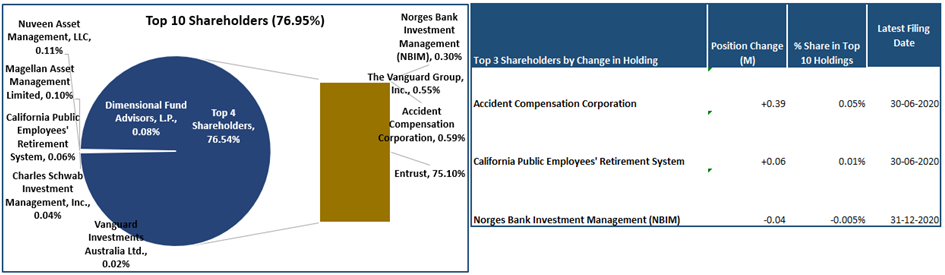
Data Source: Refinitiv, Analysis by Kalkine Group
A Quick Look at Key Metrics: The company’s gross margin, EBITDA margin and net margin for H1FY21 stood at 69.0%, 50.2% and 15.8%, better than the H1FY20 result of 63.0%, 44.3% and 11.5%, respectively, implying an improvement in the company’s operational efficiency. Its cash cycle for H1FY21 stood at 66.7 days, better than the H1FY20 figure of 70.7 days, implying that the company has efficiently managed its asset-liability balances. The period witnessed the current ratio remaining at the same level of 0.38x as compared to H1 FY 2020.
Exhibit 4: Key Metrics
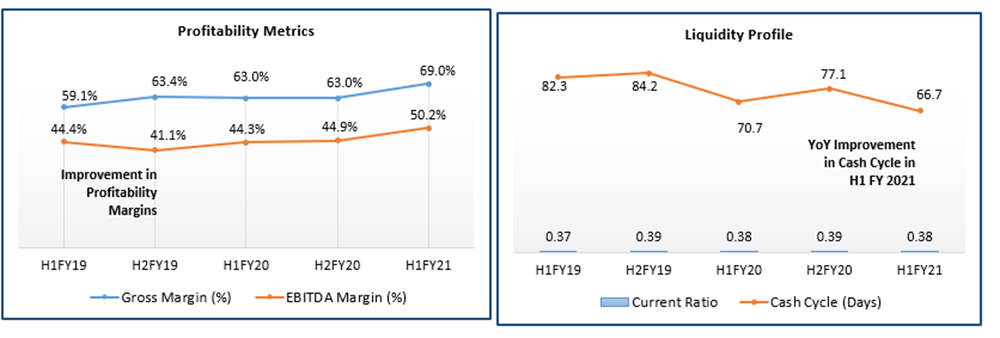
Data Source: Refinitiv, Analysis by Kalkine Group
Recent Update:
The company, on 30 July 2021, announced that its financial results for the year ended 30 June 2021 would be released on 24th August 2021.
Outlook:
Satisfying First Half Year: The company’s H1FY21 results were satisfying having registered a growth of 26.8% in its net profit after tax despite revenue getting adversely impacted by the new Commerce Commission DPP3 regulatory settings. It is expected to advance its Symphony strategy while continuing to focus on business resilience. Moreover, the company is working closely with its partners to deliver advanced energy solutions, such as the development of a next-generation advanced meter platform to reduce the processing time for meter data as well as analytical solutions for retailer customers.
Strong 9 Months Operational Performance: It highlighted strong demand for network connections across electricity, gas and metering which augurs well for the future performance of the company.
Upward Revision in its FY21 Guidance: VCT has revised its adjusted EBITDA guidance from the range of $480 - $500 million to $500 - 520 million for the coming financial year.
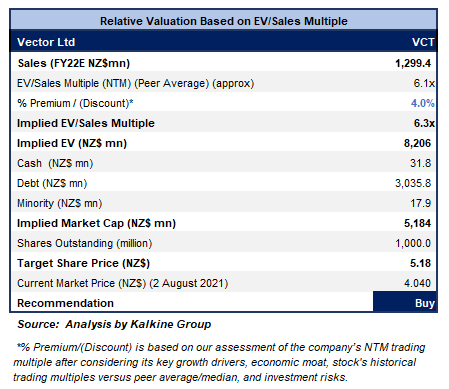
Valuation Methodology: EV/Sales Based Relative Valuation (Illustrative)
Technical Overview:
Chart:
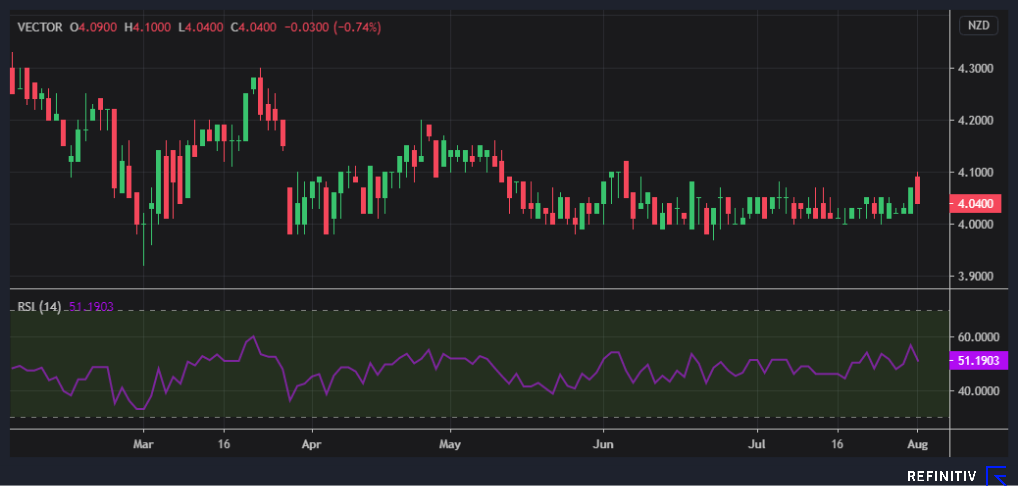
Source: REFINITIV
Note: Purple Color Line Reflects RSI (14-Period)
Stock Recommendation:
The company is working closely with its partners (strategic alliance with Amazon Web Services (AWS)) to deliver advanced energy solutions, such as the development of a next-generation advanced meter platform to reduce the processing time for meter data as well as analytical solutions for retailer customers. Moreover, the company is expected to continue to invest in innovative technologies and infrastructure that support its customers.
We have valued the stock using EV/Sales multiple-based illustrative relative valuation and have arrived at a target price that reflects a rise of low double-digit (in % terms). We have assigned a slight premium to EV/Sales Multiple (NTM) (Peer Average) considering its diversified business as well as an improvement in the cash position. VCT’s stock has declined by ~2.41% in 3 months. It has made a 52-week low and high of $3.8200 and $4.6500, respectively.
Hence, we give a “Buy” recommendation on the stock at the current market price of NZ$4.040 per share, down by 0.74% on 2nd August 2021.
Note 1: The reference data in this report has been partly sourced from REFINITIV.
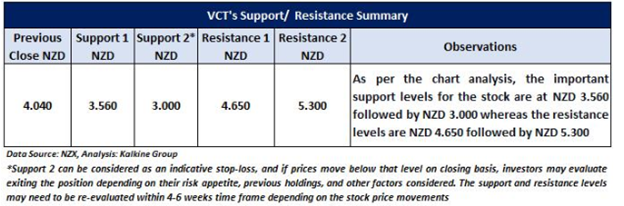
Note 2: Investment decisions should be made depending on the investors’ appetite on upside potential, risks, holding duration, and any previous holdings. Investors can consider exiting from the stock if the Target Price mentioned as per the analysis has been achieved and subject to the factors discussed above alongside support levels provided.
Technical Indicators Defined:-
Support: A level where-in the stock prices tend to find support if they are falling, and downtrend may take a pause backed by demand or buying interest.
Resistance: A level where-in the stock prices tend to find resistance when they are rising, and uptrend may take a pause due to profit booking or selling interest.
Stop-loss: It is a level to protect further losses in case of unfavourable movement in the stock prices.
Disclaimer
Kalkine New Zealand Limited is authorised to provide class advice only. The information on this site does not take into account any of your investment objectives, financial situation or needs. Before you make a decision about whether to acquire a financial product, you should obtain the Product Disclosure Statement from the product issuer. You should consider the appropriateness of advice taking into account your own objectives, financial situation and needs and seek independent financial advice before making any financial decisions.
Past performance is not a reliable indicator of future performance.
 Please wait processing your request...