
Section 1: Company Overview and Fundamentals
1.1 Company Overview:
Universal Corporation (NYSE: UVV) is a global business-to-business agriproducts company. The Company is a global leaf tobacco supplier and provides plant-based ingredients to food and beverage end markets. The Company operates through two segments: Tobacco Operations and Ingredients Operations. The Tobacco Operations segment activities involve contracting, procuring, processing, packing, storing, and shipping leaf tobacco for sale to, or for the account of, manufacturers of consumer tobacco products throughout the world.
Kalkine’s Diversified Opportunities Report covers the Company Overview, Key positives & negatives, Investment summary, Key investment metrics, Top 10 shareholding, Business updates and insights into company recent financial results, Key Risks & Outlook, Price performance and technical summary, Target Price, and Recommendation on the stock.
Stock Performance:

1.2 The Key Positives, Negatives, and Investment summary

1.3 Top 10 shareholders:
The top 10 shareholders together form ~56.11% of the total shareholding, signifying concentrated shareholding. BlackRock Institutional Trust Company, N.A., and Capital Research Global Investors., are the biggest shareholders, holding the maximum stake in the company at 7.04% and 6.34%, respectively.

1.4 Key Metrics:
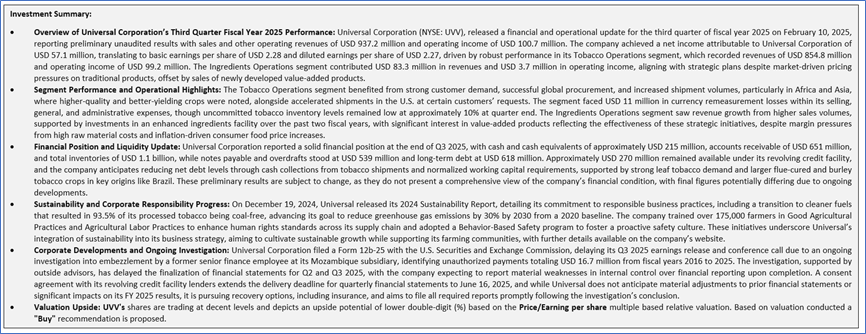
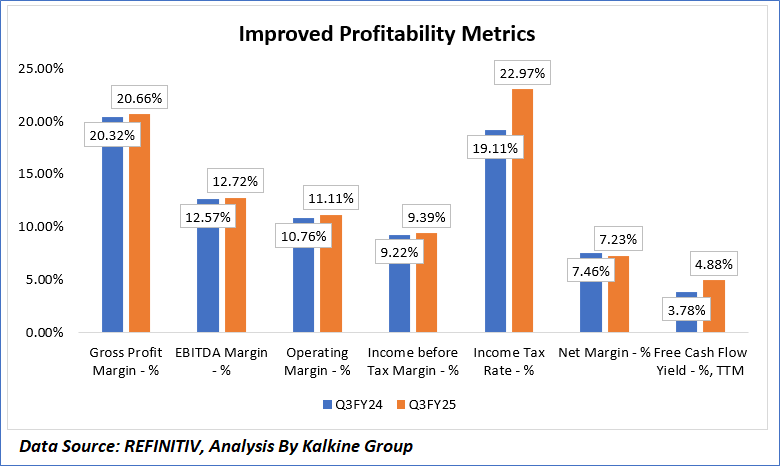
Universal Corporation (NYSE: UVV) exhibited a marginal improvement in several key financial metrics in Q3 FY 2025 compared to Q3 FY 2024, reflecting operational resilience amidst market challenges. The gross profit margin increased slightly to 20.66% from 20.32%, indicating modest gains in cost management or pricing strategies within its Tobacco and Ingredients Operations segments. Similarly, the EBITDA margin rose to 12.72% from 12.57%, and the operating margin improved to 11.11% from 10.76%, driven by robust tobacco sales volumes and enhanced operational efficiencies, despite currency remeasurement losses of USD 11 million in the Tobacco Operations segment. The income before tax margin edged up to 9.39% from 9.22%, but a higher income tax rate of 22.97% compared to 19.11% in the prior year led to a slight decline in the net margin to 7.23% from 7.46%, reflecting increased tax pressures that offset operational gains. Additionally, the trailing twelve-month free cash flow yield improved significantly to 4.88% from 3.78%, signaling stronger cash generation capabilities, supported by efficient working capital management and tobacco shipment cash collections, which bolsters the company’s financial flexibility despite ongoing challenges such as the embezzlement investigation and high leverage.
Section 2: Business Updates and Corporate Business Highlights
2.1 Recent Updates:
The below picture gives an overview of the recent updates:

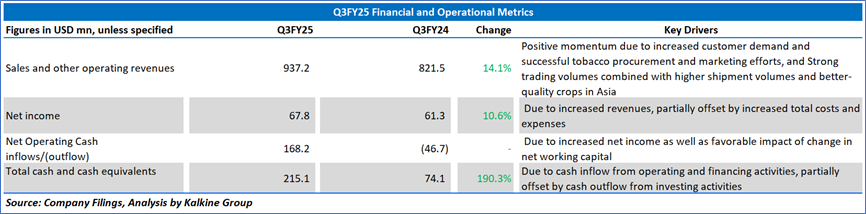
2.2 Insights of Q3FY25:
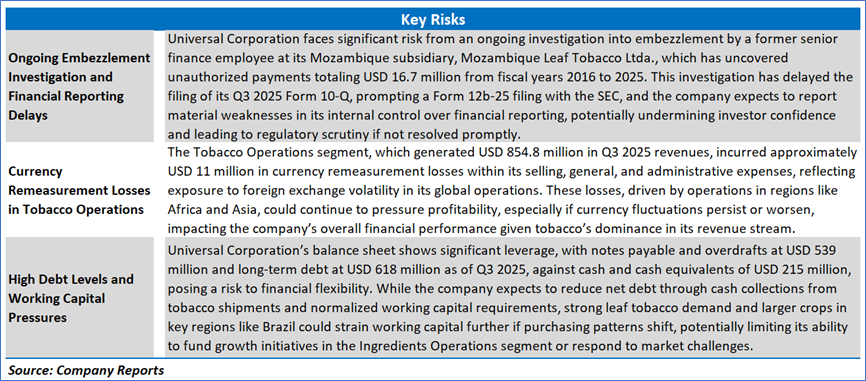
Section 3: Key Risks & Outlook
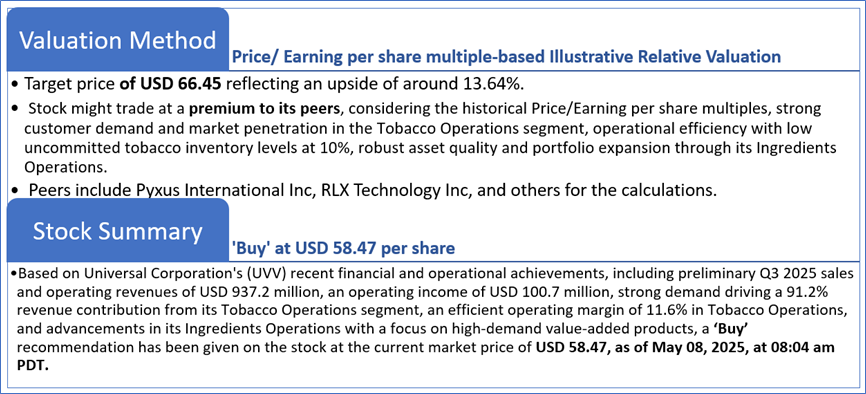
Section 4: Stock Recommendation Summary:
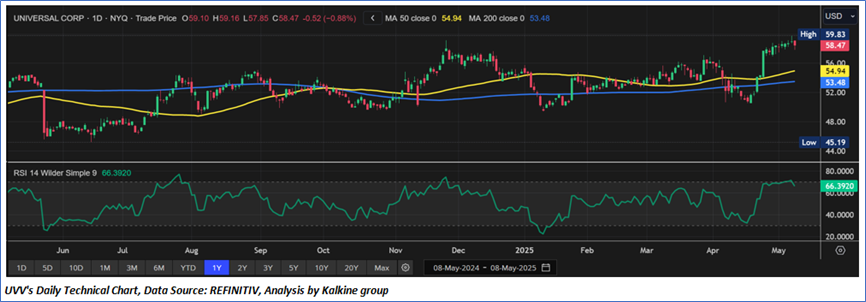
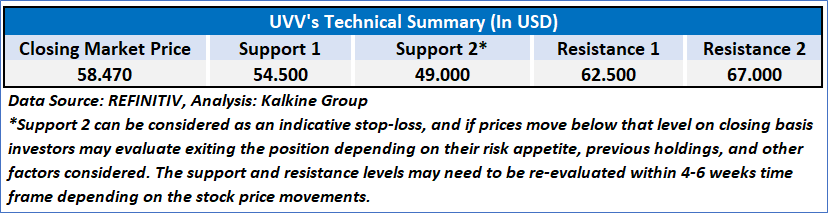
4.1 Price Performance and Technical Summary:
Stock Performance:
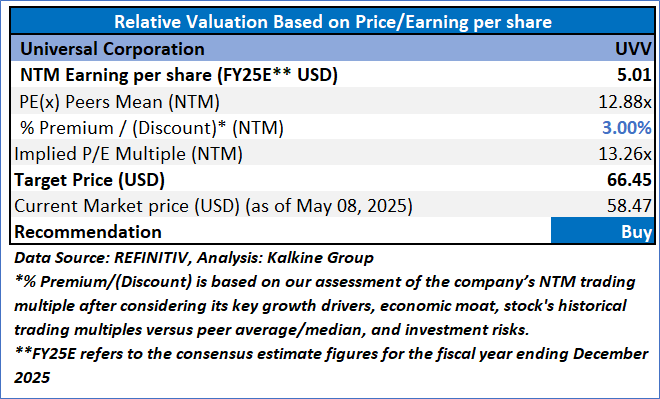
4.2 Fundamental Valuation
Valuation Methodology: Price/ Earnings per share Multiple Based Relative Valuation
Markets are trading in a highly volatile zone currently due to certain macroeconomic issues and geopolitical tensions prevailing. Therefore, it is prudent to follow a cautious approach while investing.
Note 1: Past performance is not a reliable indicator of future performance.
Note 2: The reference date for all price data, currency, technical indicators, support, and resistance levels is May 08, 2025. The reference data in this report has been partly sourced from REFINITIV.
Note 3: Investment decisions should be made depending on an individual's appetite for upside potential, risks, holding duration, and any previous holdings. An 'Exit' from the stock can be considered if the Target Price mentioned as per the Valuation and or the technical levels provided has been achieved and is subject to the factors discussed above.
Note 4: The report publishing date is as per the Pacific Time Zone.
Technical Indicators Defined: -
Support: A level at which the stock prices tend to find support if they are falling, and a downtrend may take a pause backed by demand or buying interest. Support 1 refers to the nearby support level for the stock and if the price breaches the level, then Support 2 may act as the crucial support level for the stock.
Resistance: A level at which the stock prices tend to find resistance when they are rising, and an uptrend may take a pause due to profit booking or selling interest. Resistance 1 refers to the nearby resistance level for the stock and if the price surpasses the level, then Resistance 2 may act as the crucial resistance level for the stock.
Stop-loss: It is a level to protect against further losses in case of unfavorable movement in the stock prices.
Disclaimer This report has been issued by Kalkine New Zealand Limited (FSP691351) (NZBN:9429047678101) (“Kalkine”). Kalkine is a Financial Advice Provider (“FAP”) and is authorised by a Class 1 Financial Advice Provider Licence issued by Financial Markets Authority (“FMA”) to provide financial advice. Kalkine provides only general financial advice through its research reports following a person becoming a member. The reports contain buy/sell/hold and other recommendations in relation to equity securities, managed funds and other managed investment schemes and other financial advice products. The recommendations and opinions in this report and on Kalkine website do not take into account any of your investment objectives, financial situation or needs. Before you make a decision about whether to acquire a financial product, you should obtain the Product Disclosure Statement from the product issuer. You should consider the appropriateness of advice taking into account your own objectives, financial situation and needs and seek independent financial advice before making any financial decisions. If you act on the advice in the research reports, you may have to pay fees, expenses or other amounts (but not to Kalkine). Further information about the complaints and dispute resolution process, as well as information about Kalkine’s duties are available on Kalkine’s website. Please read our Financial Advice Provider (FAP) disclosure statement and Complaints Handling Guide, which are available on the website.
Past performance is not a reliable indicator of future performance.
 Please wait processing your request...