
Section 1: Company Overview and Fundamentals
Company Overview:
Uber Technologies, Inc. (NYSE: UBER) operates a technology platform that uses network and technology to power movement from point A to point B. It develops and operates technology applications supporting a variety of offerings on its platform (platform(s)). Its segments include Mobility, Delivery and Freight. Mobility products connect consumers with drivers who provide rides in a variety of vehicles, such as cars, auto rickshaws, motorbikes, minibuses, or taxis.
Kalkine’s Diversified Opportunities Report covers the Company Overview, Key positives & negatives, Investment summary, Key investment metrics, Top 10 shareholding, Business updates and insights into company recent financial results, Key Risks & Outlook, Price performance and technical summary, Target Price, and Recommendation on the stock.
Stock Performance:

1.2 The Key Positives, Negatives, and Investment summary


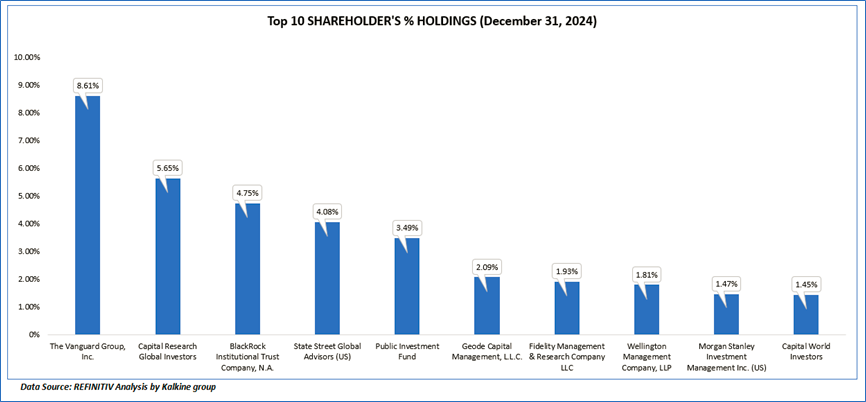
1.3 Top 10 shareholders:
The top 10 shareholders together form ~35.33% of the total shareholding, signifying concentrated shareholding. The Vanguard Group, Inc., and Capital Research Global Investors, are the biggest shareholders, holding the maximum stake in the company at 8.61% and 5.5%, respectively.
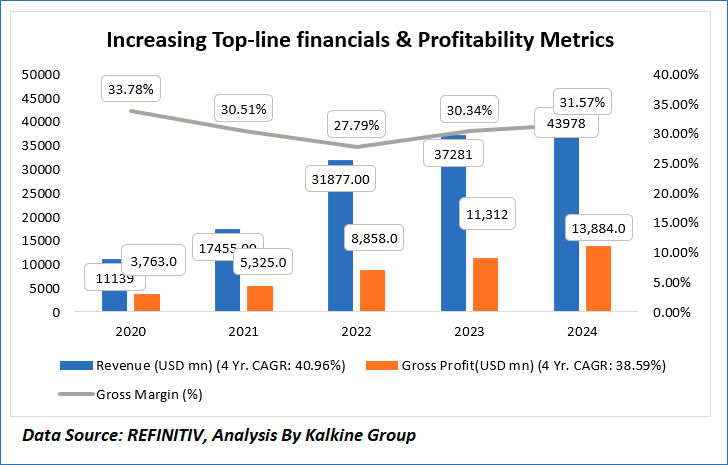
1.4 Key Metrics
Uber Technologies, Inc. demonstrated remarkable financial growth from 2020 to 2024, with revenue escalating from USD 11,139 million to USD 43,978 million, reflecting a robust four-year Compound Annual Growth Rate (CAGR) of 40.96%, underpinned by a 19% increase in trips to 11.27 billion and an 18% rise in Gross Bookings to USD 162.77 billion in 2024, signaling strong demand across its Mobility and Delivery segments. Gross profit advanced from USD 3,763 million to USD 13,884 million over the same period, with a CAGR of 38.59%, though the gross margin fluctuated, peaking at 33.78% in 2020 before stabilizing at 31.57% in 2024, suggesting effective cost management amid scaling operations, despite a dip to 27.79% in 2022 due to inflationary pressures and freight segment challenges. This performance, coupled with a net income turnaround to USD 9.86 billion in 2024 and a 44% Adjusted EBITDA growth to USD 1.8 billion in Q4 2024, highlights Uber’s ability to enhance profitability and operational efficiency, positioning it favorably for a premium valuation despite currency headwinds projected for Q1 2025.
Section 2: Business Updates and Corporate Business Highlights
2.1 Recent Updates:
The below picture gives an overview of the recent updates:

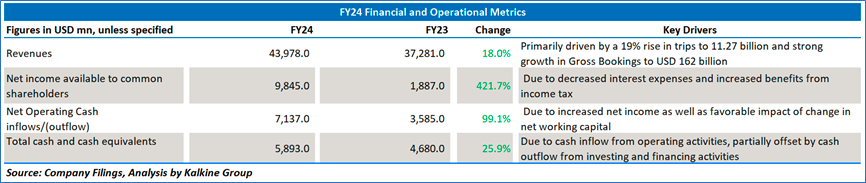
2.2 Insights of FY24:
Section 3: Key Risks & Outlook

Section 4: Stock Recommendation Summary:
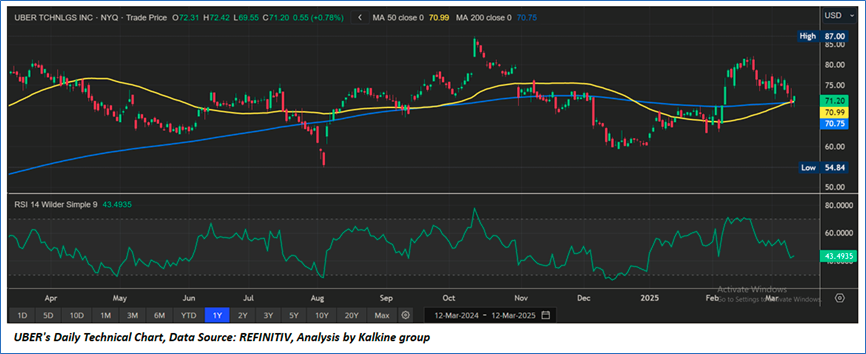
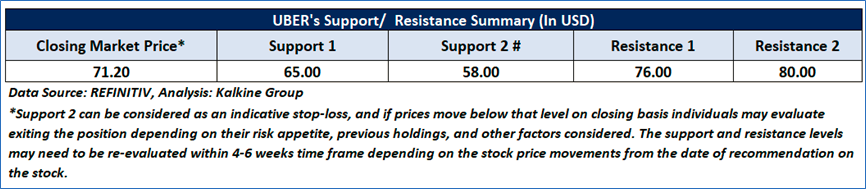
4.1 Price Performance and Technical Summary:
Stock Performance:
4.2 Fundamental Valuation
Valuation Methodology: Price/Earnings Per Share Multiple Based Relative Valuation


Markets are trading in a highly volatile zone currently due to certain macroeconomic issues and geopolitical tensions prevailing. Therefore, it is prudent to follow a cautious approach while investing.
Note 1: Past performance is not a reliable indicator of future performance.
Note 2: The reference date for all price data, currency, technical indicators, support, and resistance levels is March 12, 2025. The reference data in this report has been partly sourced from REFINITIV.
Note 3: Investment decisions should be made depending on an individual's appetite for upside potential, risks, holding duration, and any previous holdings. An 'Exit' from the stock can be considered if the Target Price mentioned as per the Valuation and or the technical levels provided has been achieved and is subject to the factors discussed above.
Note 4: The report publishing date is as per the Pacific Time Zone.
Technical Indicators Defined: -
Support: A level at which the stock prices tend to find support if they are falling, and a downtrend may take a pause backed by demand or buying interest. Support 1 refers to the nearby support level for the stock and if the price breaches the level, then Support 2 may act as the crucial support level for the stock.
Resistance: A level at which the stock prices tend to find resistance when they are rising, and an uptrend may take a pause due to profit booking or selling interest. Resistance 1 refers to the nearby resistance level for the stock and if the price surpasses the level, then Resistance 2 may act as the crucial resistance level for the stock.
Stop-loss: It is a level to protect against further losses in case of unfavorable movement in the stock prices.
Disclaimer This report has been issued by Kalkine New Zealand Limited (FSP691351) (NZBN:9429047678101) (“Kalkine”). Kalkine is a Financial Advice Provider (“FAP”) and is authorised by a Class 1 Financial Advice Provider Licence issued by Financial Markets Authority (“FMA”) to provide financial advice. Kalkine provides only general financial advice through its research reports following a person becoming a member. The reports contain buy/sell/hold and other recommendations in relation to equity securities, managed funds and other managed investment schemes and other financial advice products. The recommendations and opinions in this report and on Kalkine website do not take into account any of your investment objectives, financial situation or needs. Before you make a decision about whether to acquire a financial product, you should obtain the Product Disclosure Statement from the product issuer. You should consider the appropriateness of advice taking into account your own objectives, financial situation and needs and seek independent financial advice before making any financial decisions. If you act on the advice in the research reports, you may have to pay fees, expenses or other amounts (but not to Kalkine). Further information about the complaints and dispute resolution process, as well as information about Kalkine’s duties are available on Kalkine’s website. Please read our Financial Advice Provider (FAP) disclosure statement and Complaints Handling Guide, which are available on the website.
Past performance is not a reliable indicator of future performance.
 Please wait processing your request...