This report is an updated version of the report published on 17 October 2025 at 12:11 PM AEDT
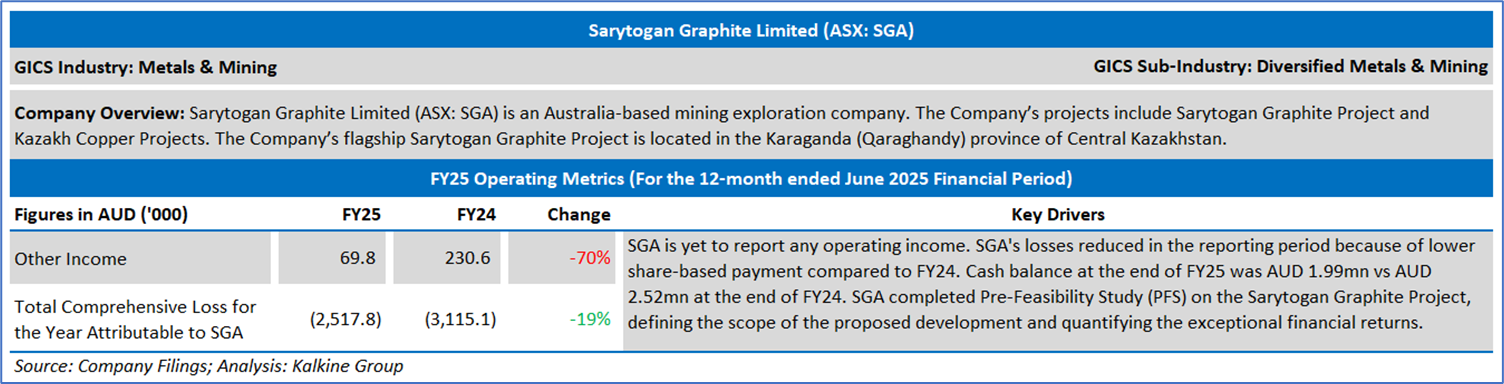
Company Overview: Sarytogan Graphite Limited (ASX: SGA) is an Australia-based mining exploration company. The Company’s projects include Sarytogan Graphite Project and Kazakh Copper Projects. The Company’s flagship Sarytogan Graphite Project is located in the Karaganda (Qaraghandy) province of Central Kazakhstan. Comet Ridge Limited (ASX: COI) is an ASX-listed energy company focused on the development of natural gas resources for the strained east coast Australian market. It has tenement interests and a suite of prospective projects in Queensland. Kalkine’s ‘Stocks Under 20 cents’ report covers the Investment Summary, Key Financial Metrics, Risks, Outlook, SWOT Analysis, Technical Analysis along with the TTM based Valuation, and Recommendation on the stocks.
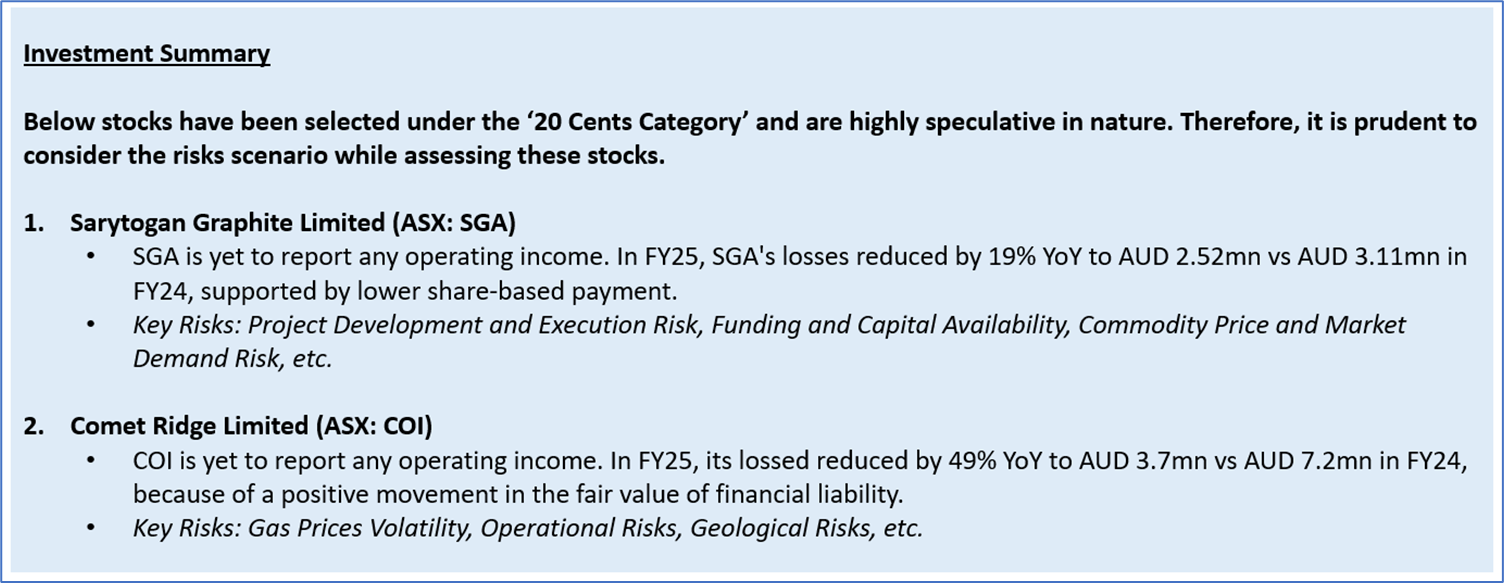
1. Sarytogan Graphite Limited (ASX: SGA) (Recommendation: Speculative Buy, Market Cap: AUD 27.14mn)
FY25 Update:
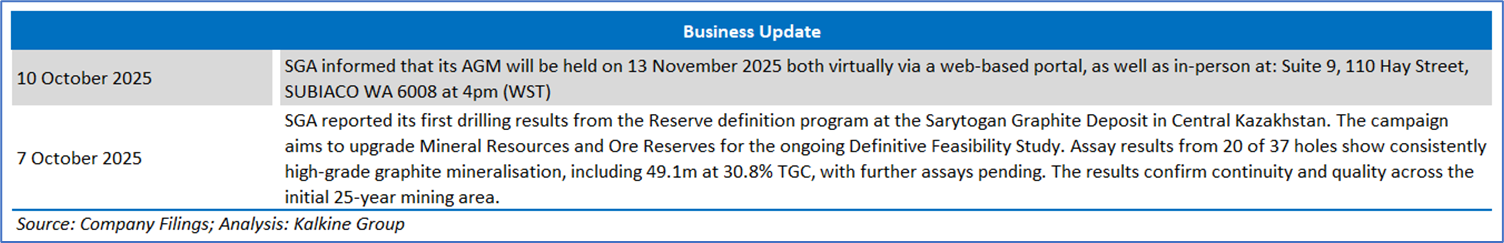
Business Update:
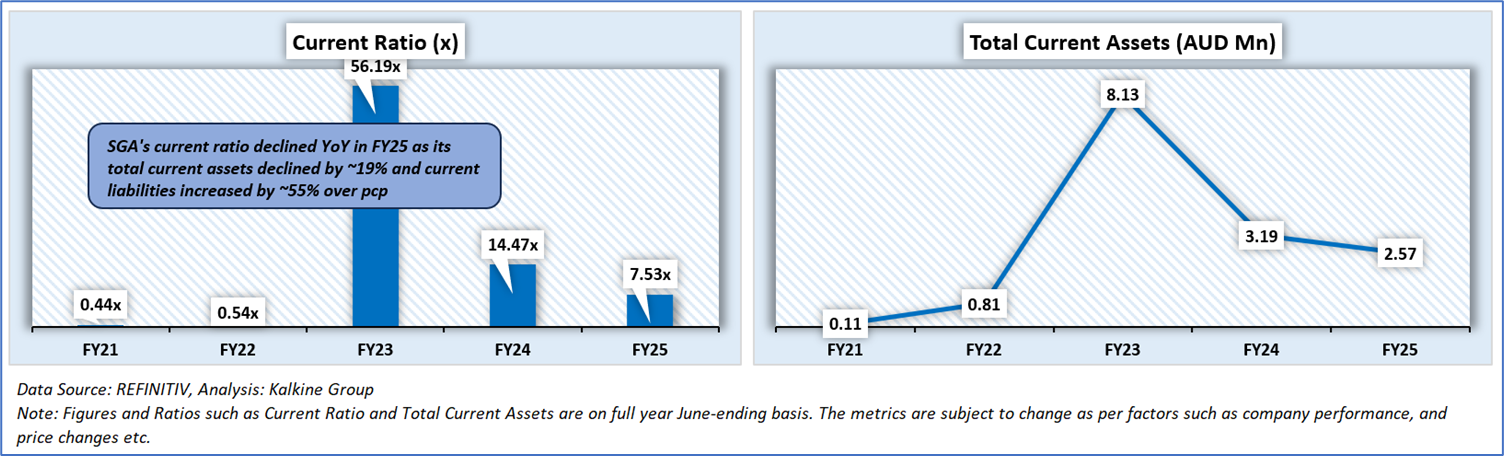
Key Ratios & Figures:
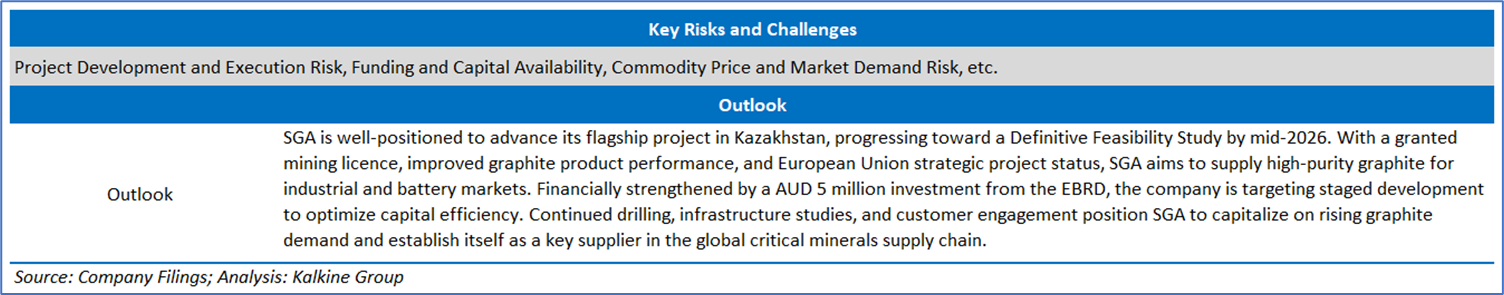
Key Risks and Outlook:
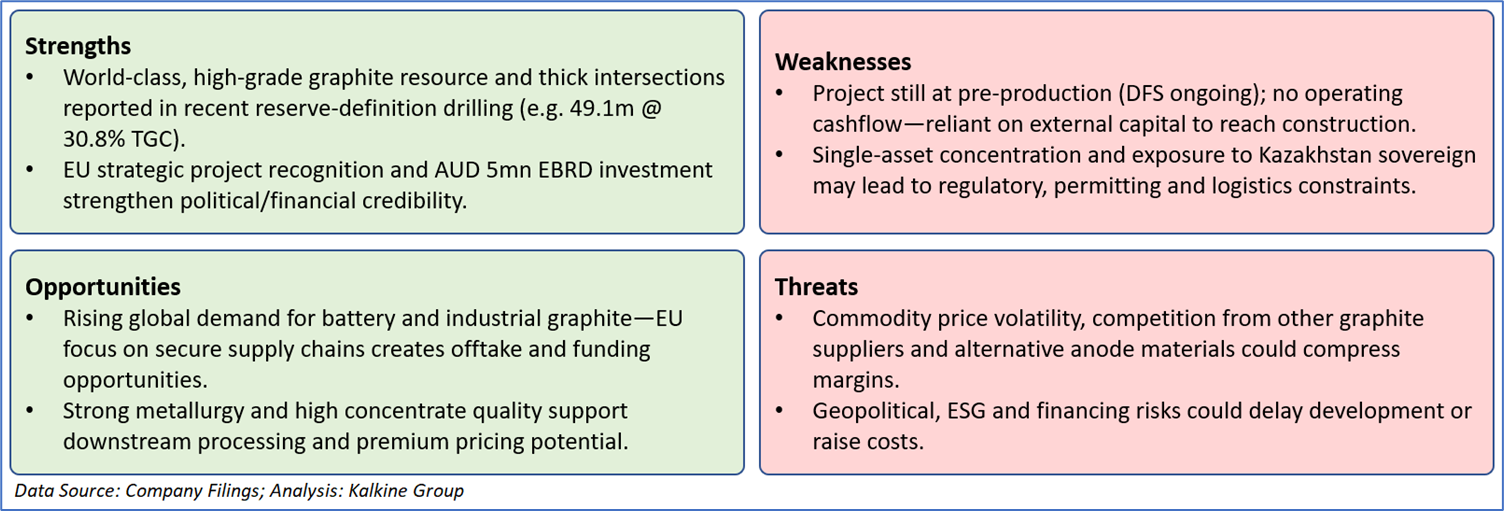
SWOT Analysis:
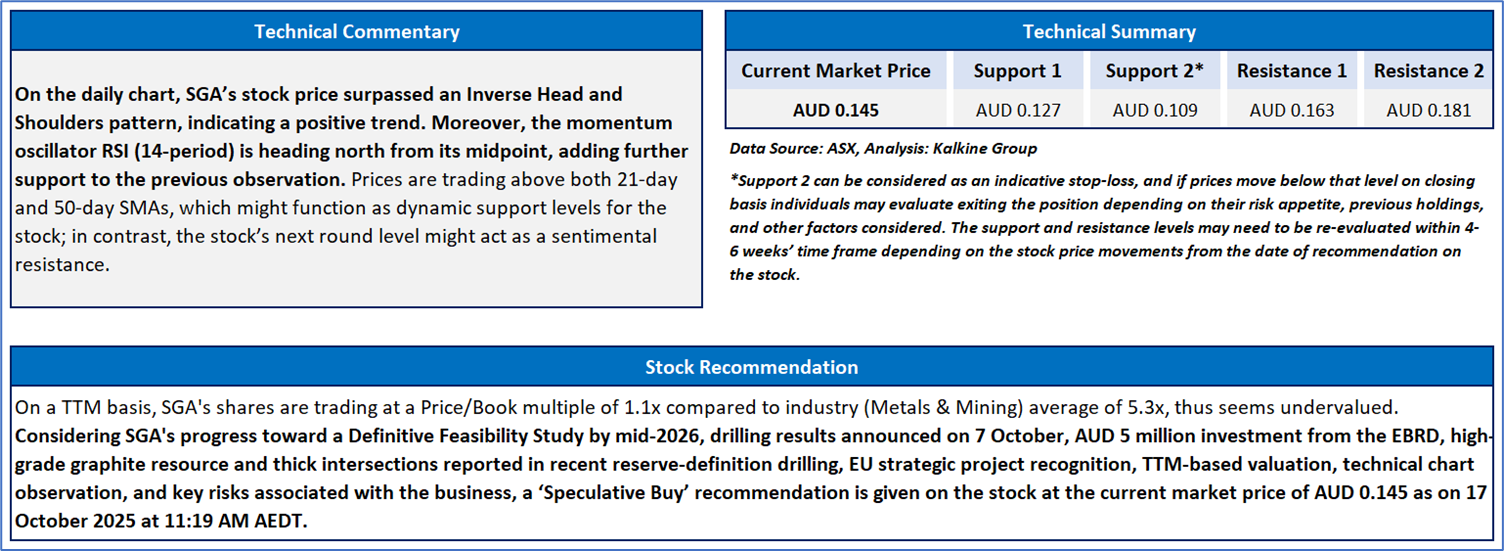
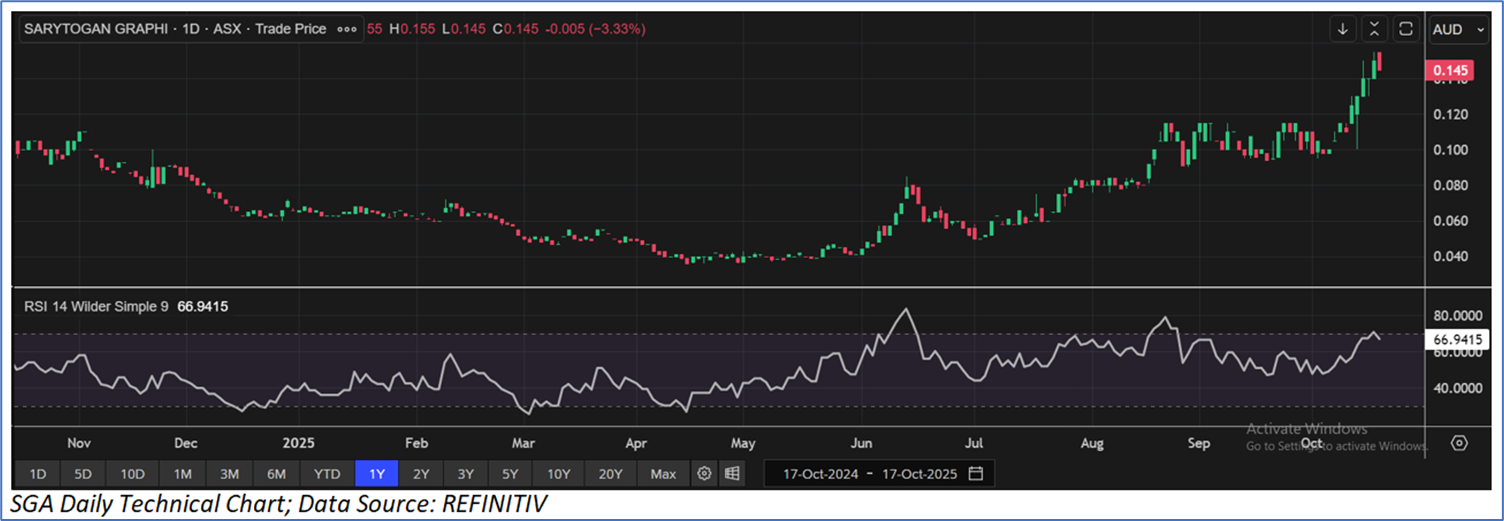
Stock Recommendation and Technical Analysis:
The stock has increased by ~46.19% in the last one month and over the last six months, it has jumped by ~262.5%. The stock has a 52-week low and 52-week high of AUD 0.036 and AUD 0.155, respectively, and is currently trading around the average of 52-week high level. SGA was last covered in a report dated ‘14 November 2022’.

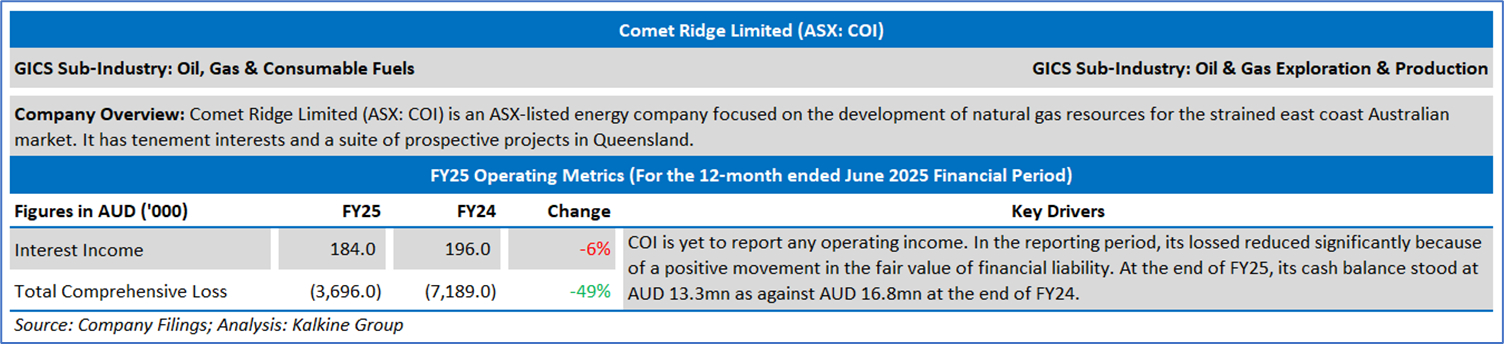
2. Comet Ridge Limited (ASX: COI) (Recommendation: Speculative Buy, Market Cap: AUD 137.59mn)
Result Highlights of FY25:
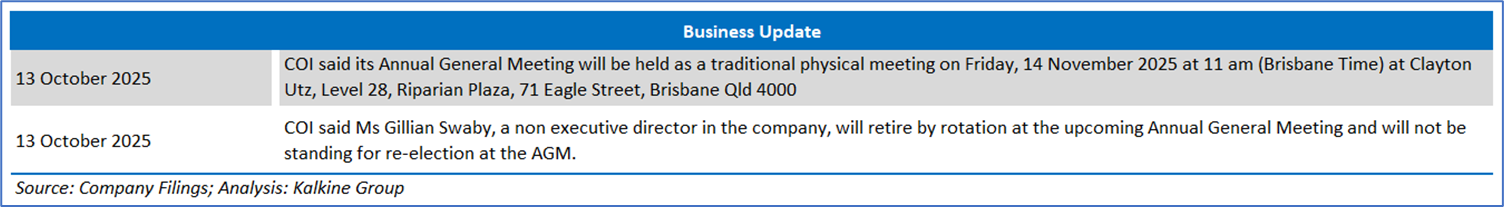
Business Update:
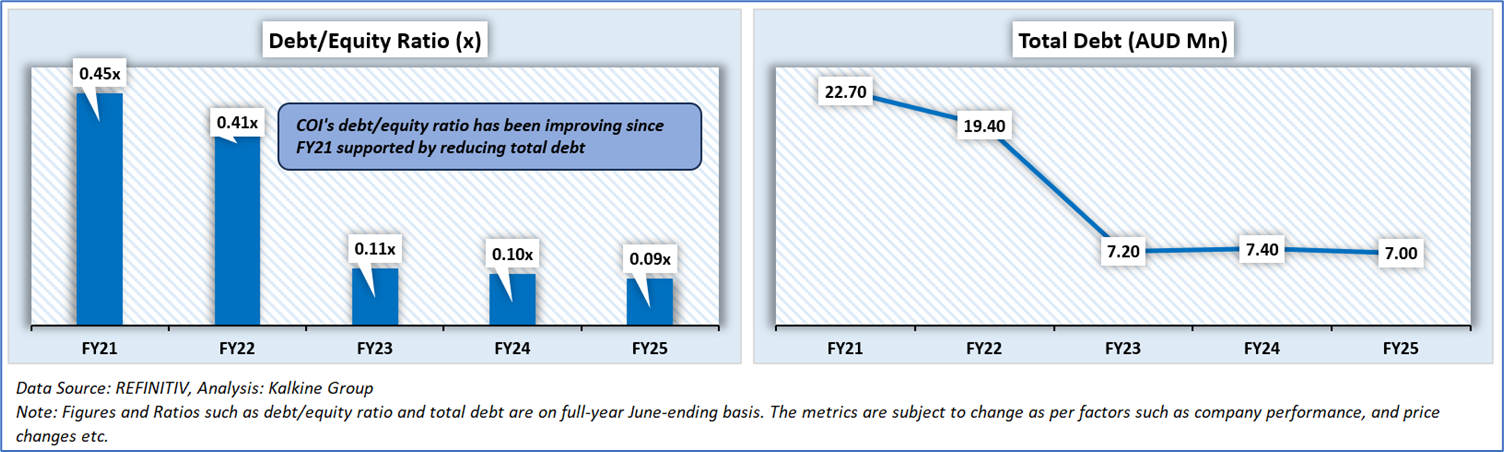
Key Ratios & Figures:
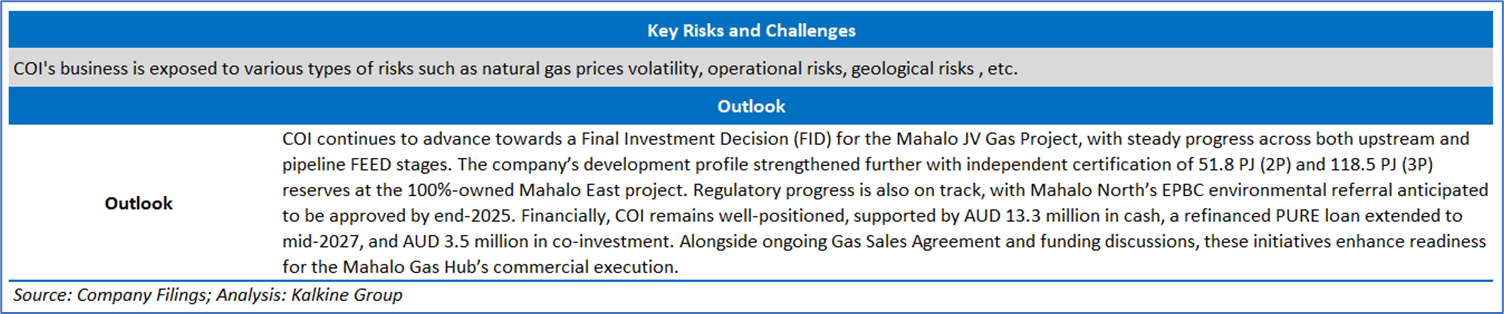
Key Risks and Outlook:
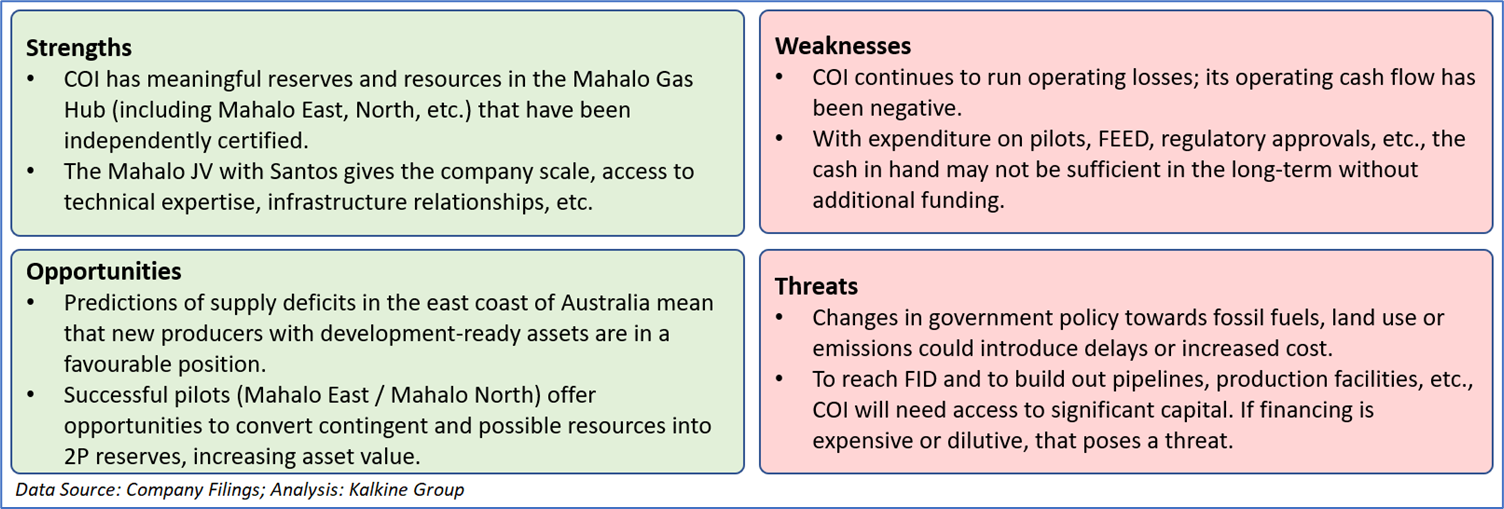
SWOT Analysis:
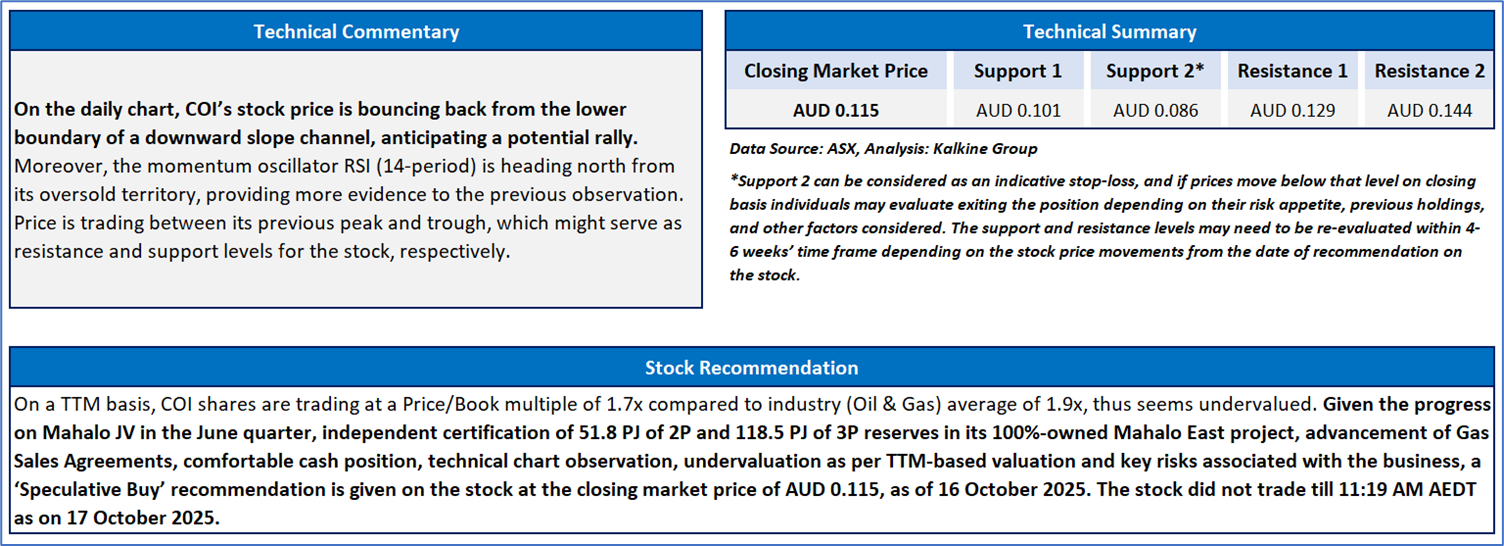
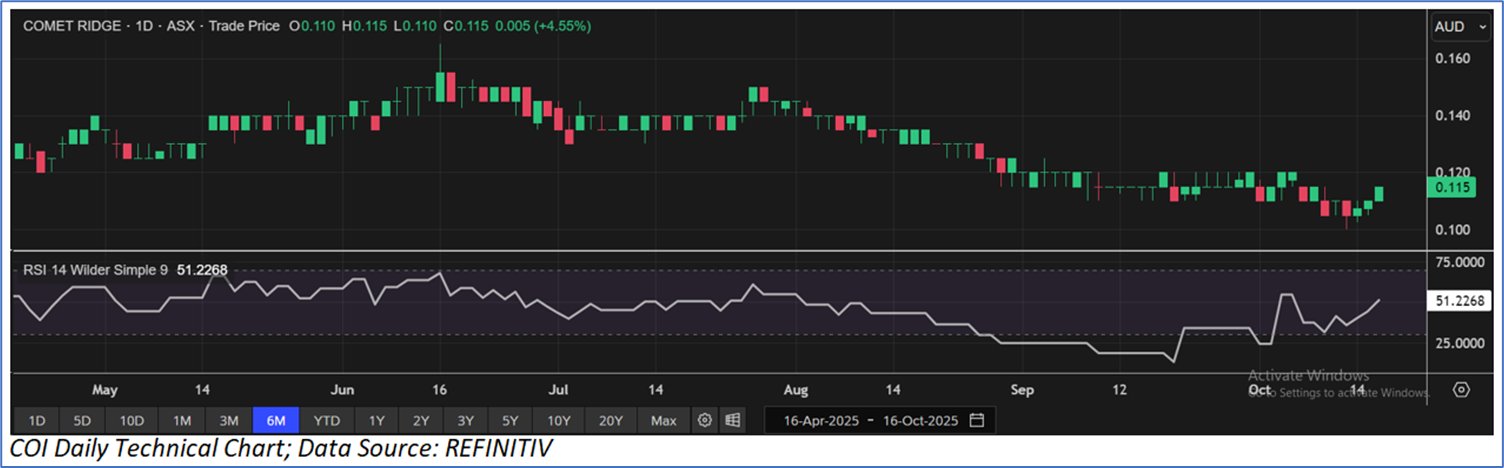
Stock Recommendation and Technical Analysis:
The stock has declined by ~4.02% in the last one month and over the last six months, it has fallen by ~10.47%. The stock has a 52-week low and 52-week high of AUD 0.100 and AUD 0.173, respectively, and is currently trading below its 52-week mid-level. COI was last covered in a report dated ‘22 August 2025’.

Markets are trading in a highly volatile zone currently due to certain macro-economic issues and geopolitical tensions prevailing. Therefore, it is prudent to follow a cautious approach while investing.
Note 1: Past performance is neither an indicator nor a guarantee of future performance.
Note 2: The reference date for all price data, currency, technical indicators, support, and resistance levels is 17 October 2025. The reference data in this report has been partly sourced from REFINITIV.
Note 3: Investment decisions should be made depending on an individual’s appetite for upside potential, risks, holding duration, and any previous holdings. An ‘Exit’ from the stock can be considered if the Target Price mentioned as per the Valuation and or the technical levels provided has been achieved and is subject to the factors discussed above.
Note 4: Kalkine reports are prepared based on the stock prices captured either from REFINITIV or Trading View. Typically, REFINITIV or Trading View may reflect stock prices with a delay which could be a lag of 25-30 minutes. There can be no assurance that future results or events will be consistent with the information provided in the report. The information is subject to change without any prior notice.
Technical Indicators Defined: -
Support: A level at which the stock prices tend to find support if they are falling, and a downtrend may take a pause backed by demand or buying interest. Support 1 refers to the nearby support level for the stock and if the price breaches the level, then Support 2 may act as the crucial support level for the stock.
Resistance: A level at which the stock prices tend to find resistance when they are rising, and an uptrend may take a pause due to profit booking or selling interest. Resistance 1 refers to the nearby resistance level for the stock and if the price surpasses the level, then Resistance 2 may act as the crucial resistance level for the stock.
Stop-loss: It is a level to protect against further losses in case of unfavourable movement in the stock prices.
This report (“Report”) has been issued by Kalkine New Zealand Limited (FSP691351) (NZBN:9429047678101) (“Kalkine”). Kalkine is a Financial Advice Provider (“FAP”) and is authorised by a Class 1 Financial Advice Provider Licence issued by Financial Markets Authority (“FMA”) to provide financial advice. Kalkine provides only general financial advice through its research reports following a person becoming a member. The reports contain buy/sell/hold and other recommendations in relation to equity securities, managed funds and other managed investment schemes and other financial advice products. The recommendations and opinions in this Report and on Kalkine website do not take into account any of your investment objectives, financial situation or needs. Before you make a decision about whether to acquire a financial product, you should obtain the Product Disclosure Statement from the product issuer. You should consider the appropriateness of advice taking into account your own objectives, financial situation and needs and seek independent financial advice before making any financial decisions. If you act on the advice in the research reports, you may have to pay fees, expenses or other amounts (but not to Kalkine).
The information in this Report and on the Kalkine website has been prepared from a wide variety of sources, which Kalkine, to the best of its knowledge and belief, considers accurate. Kalkine has made every effort to ensure the reliability of the information contained in its reports (including this Report), newsletters and websites. All information represents our views at the date of publication and may change without notice.
Kalkine does not issue, sell or deal in any financial products. The information in this Report does not constitute an offer to sell securities or other financial products or a solicitation of an offer to buy securities or other financial products. Our reports contain general recommendations to invest in securities and other financial products. Kalkine is not responsible for, and does not guarantee, the performance of, or returns on, any investments mentioned in this Report.
This Report may contain information on past performance of particular investments. Past performance is not a reliable indicator of future performance. Returns stated do not take into account transaction costs and taxes.
Further information about the complaints and dispute resolution process, as well as information about Kalkine’s duties are available on Kalkine’s website. Please read our Financial Advice Provider (FAP) disclosure statement and Complaints Handling Guide, which are available on the website.
Copyright 2025 Krish Capital Pty. Ltd. (ABN 61629651510). All Rights Reserved. No part of this Report, or its content, may be reproduced in any form without our prior consent.
Past performance is not a reliable indicator of future performance.
 Please wait processing your request...