
This report is an updated version of the report published on 24 May 2024 at 1:54 PM AEST.
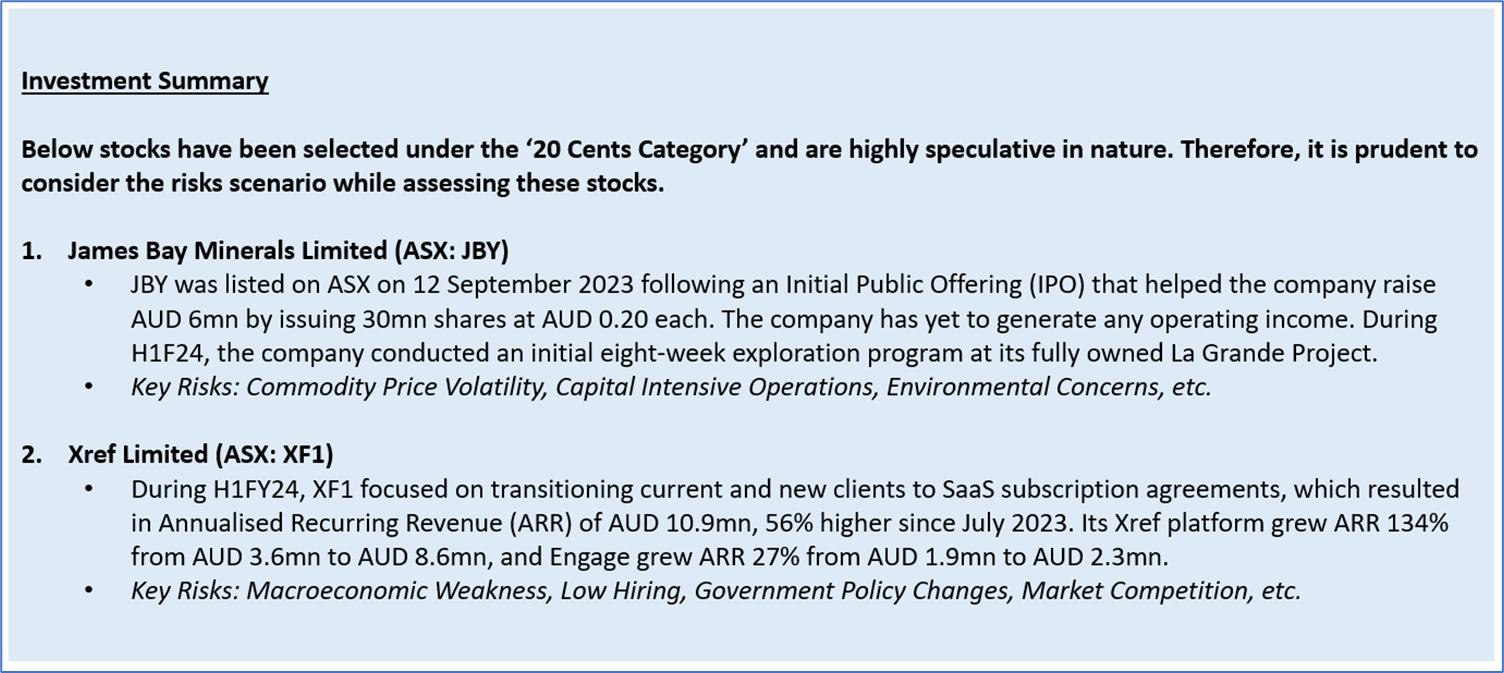
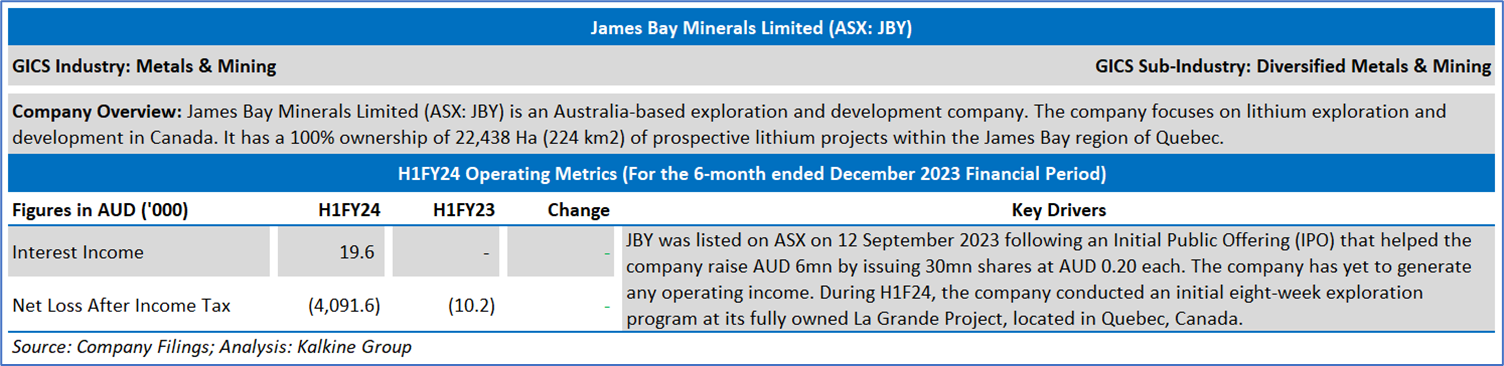
Company Overview: James Bay Minerals Limited (ASX: JBY) is an Australia-based exploration and development company. The company focuses on lithium exploration and development in Canada. It has a 100% ownership of 22,438 Ha (224 km2) of prospective lithium projects within the James Bay region of Quebec. Xref Limited (ASX: XF1) is an Australia-based human resource and recruitment technology company that allows organizations with people-focused feedback to make decisions. Its segments include candidate referencing, ID verification and Engagement surveys. Kalkine’s ‘Stocks Under 20 cents’ report covers the Investment Summary, Key Financial Metrics, Risks, Outlook, SWOT Analysis, Technical Analysis along with the Valuation, Target Price, and Recommendation on the stocks.
H1FY24 Update:
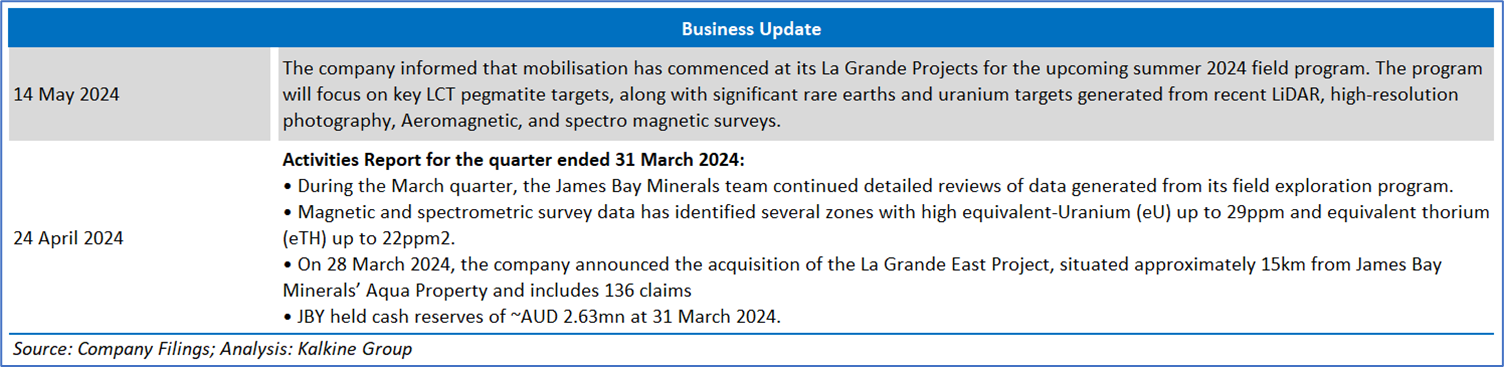
Business Update:
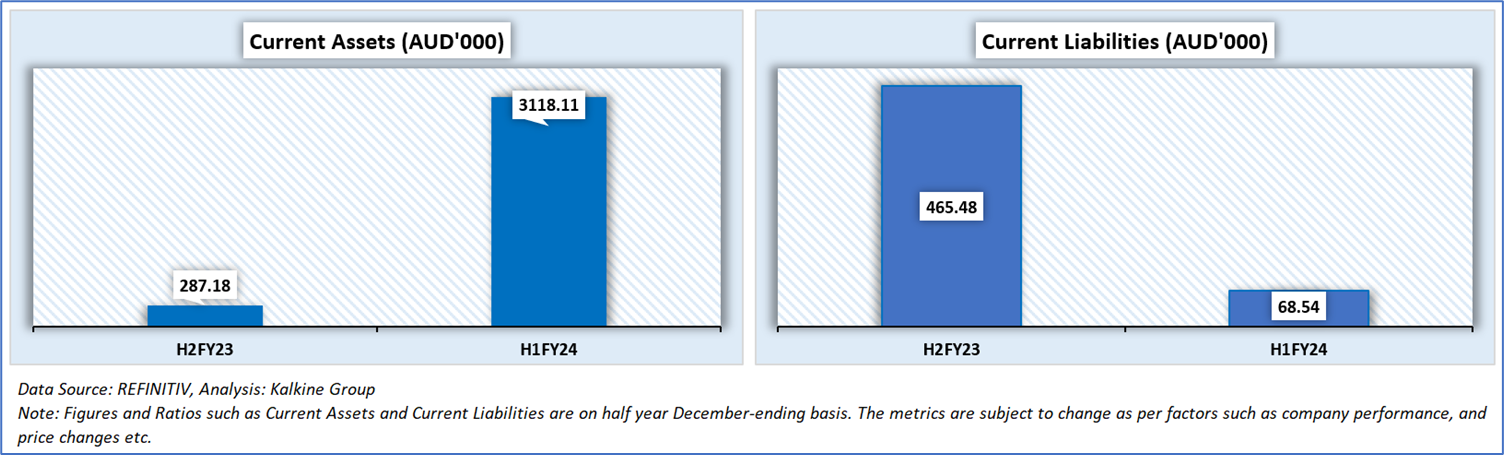
Key Ratios & Figures:
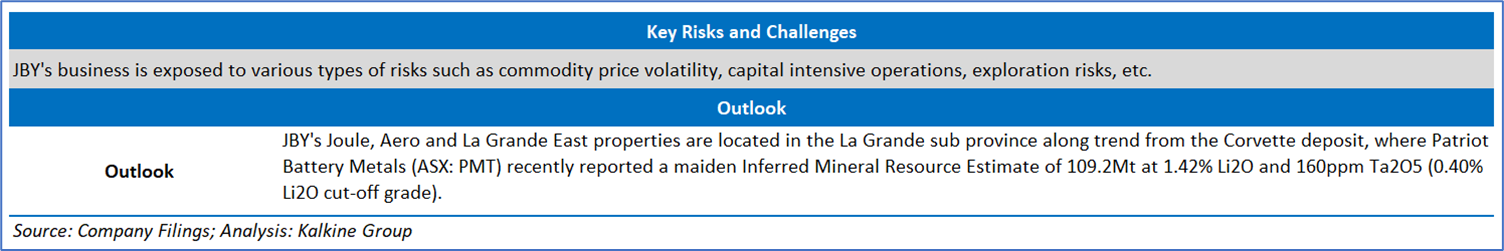
Key Risks and Outlook:
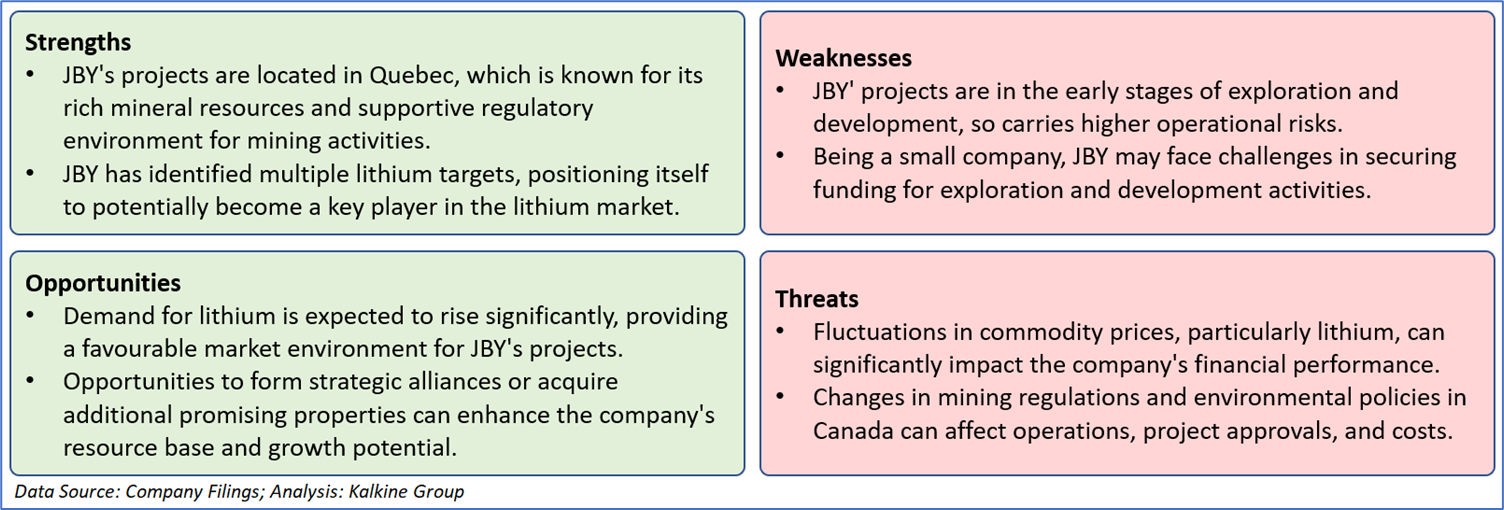
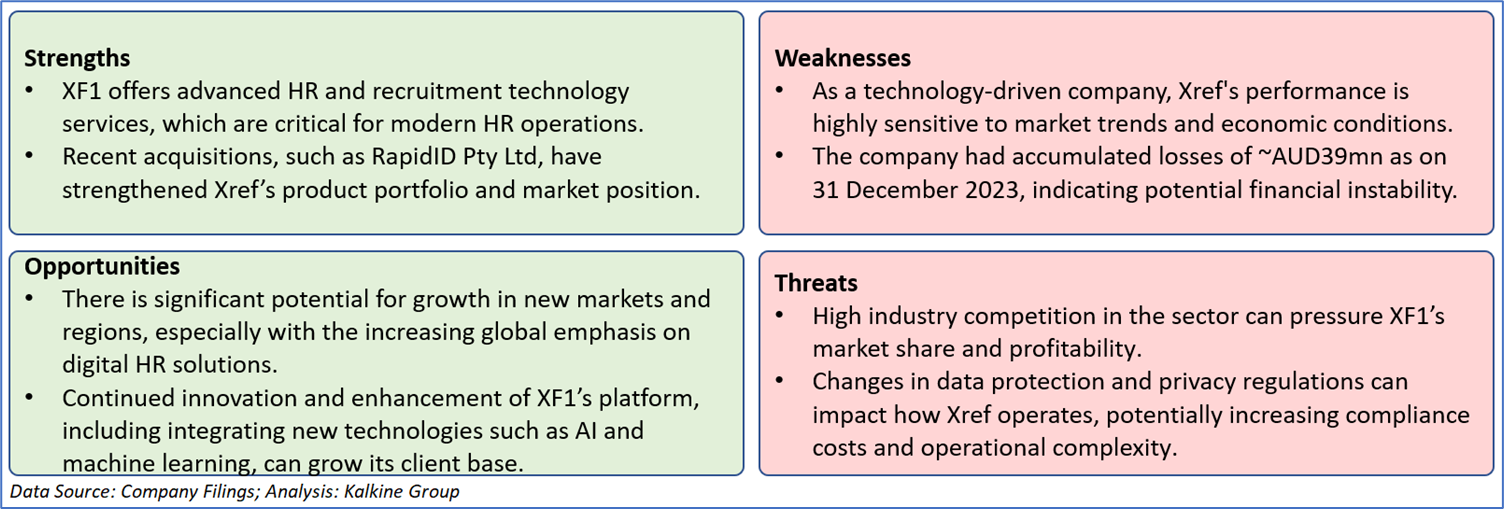
SWOT Analysis:
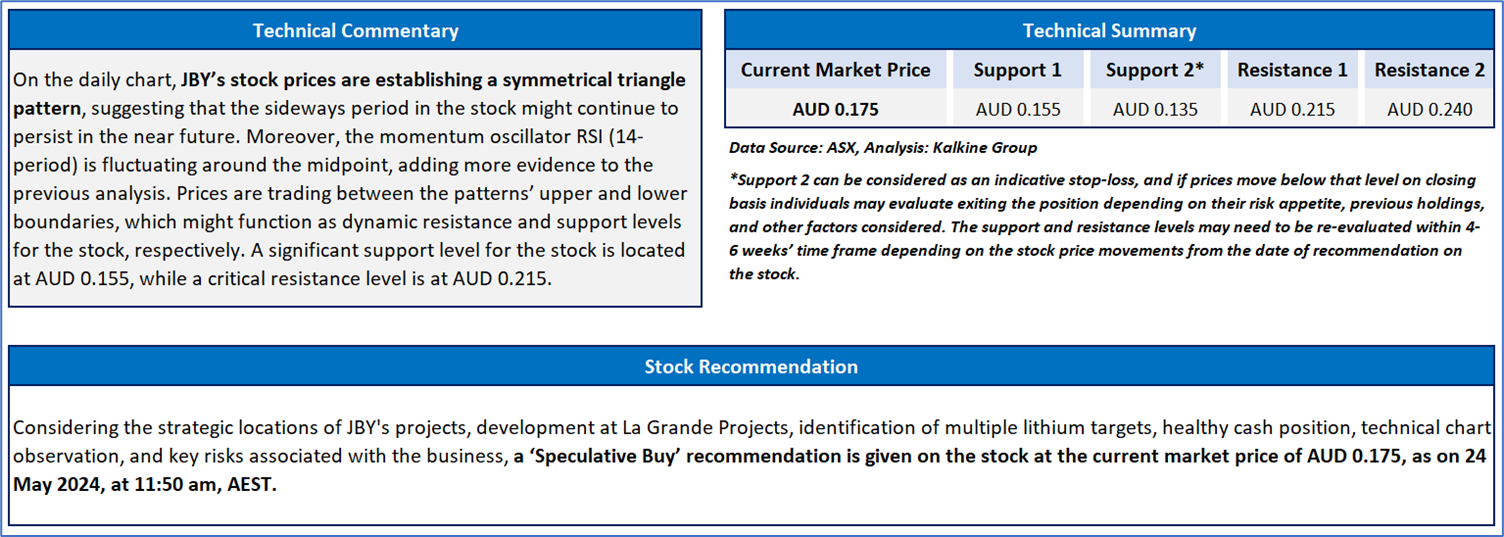
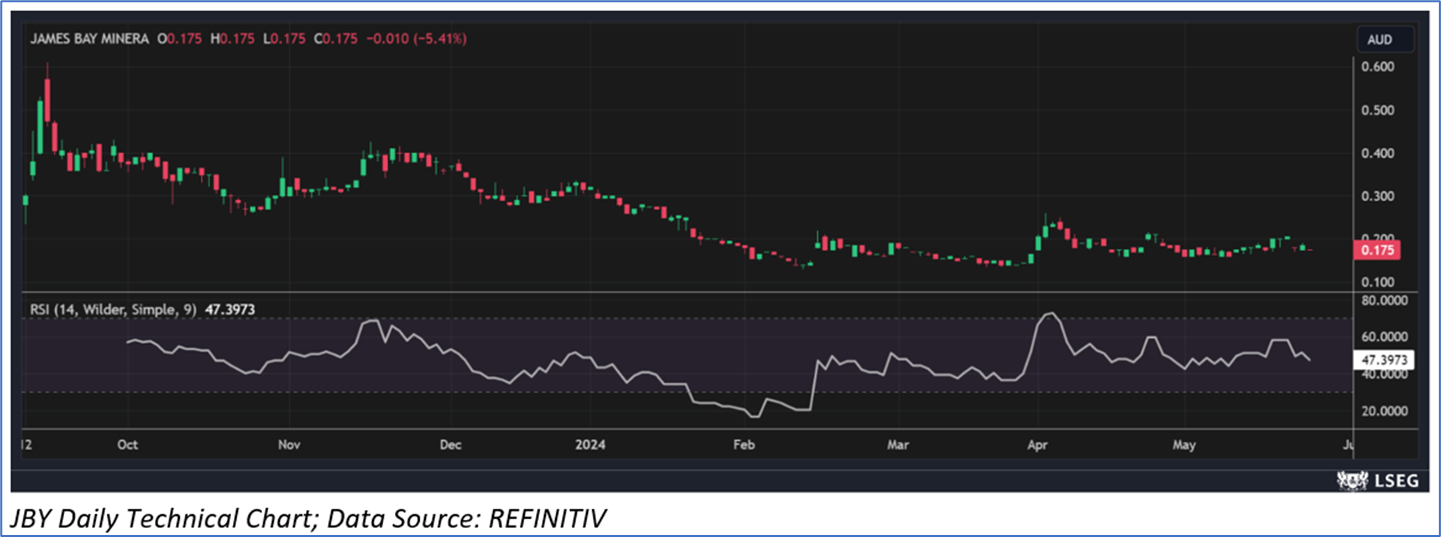
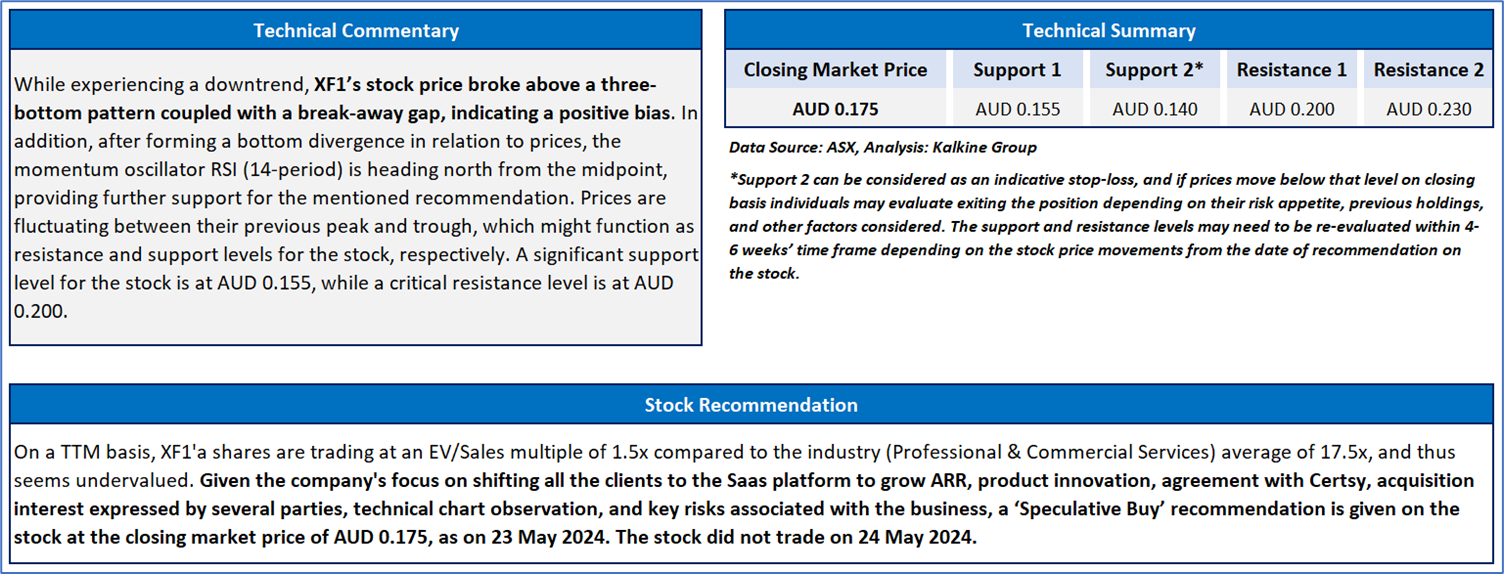
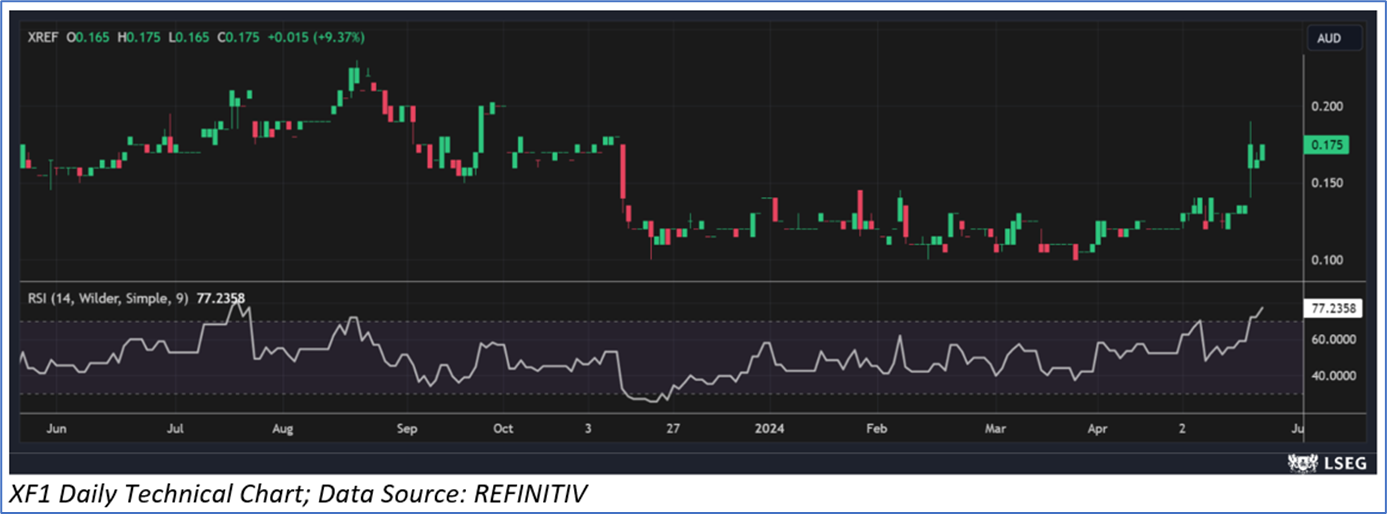
Valuation, Stock Recommendation and Technical Analysis:
The stock has corrected ~11.90% in the last one month and over the last three months, it has increased by ~8.82%. The stock has a 52-week low and 52-week high of AUD 0.130 and AUD 0.610, respectively, and is currently trading below the average of 52-week high-low average.

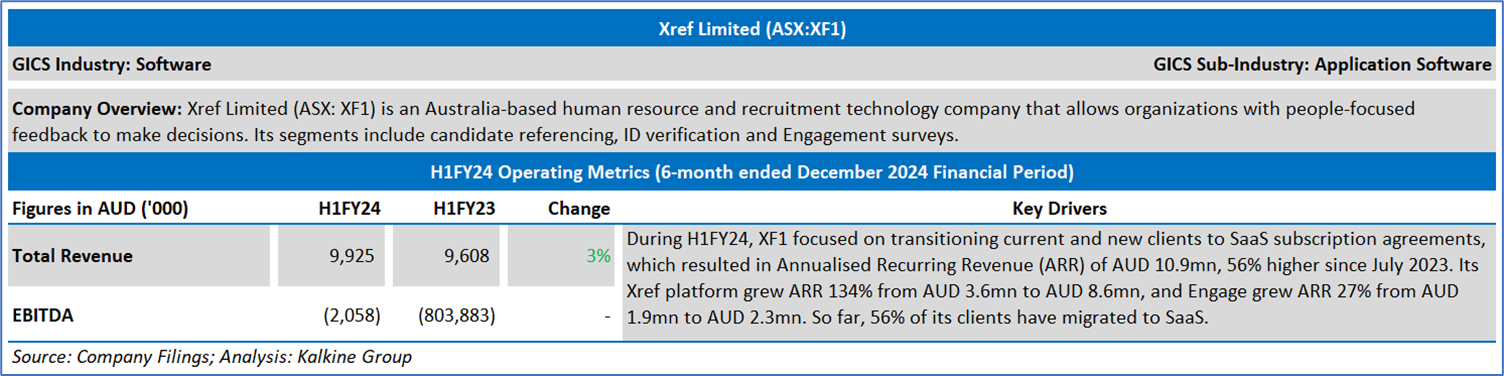
Result Highlights of H1FY24:
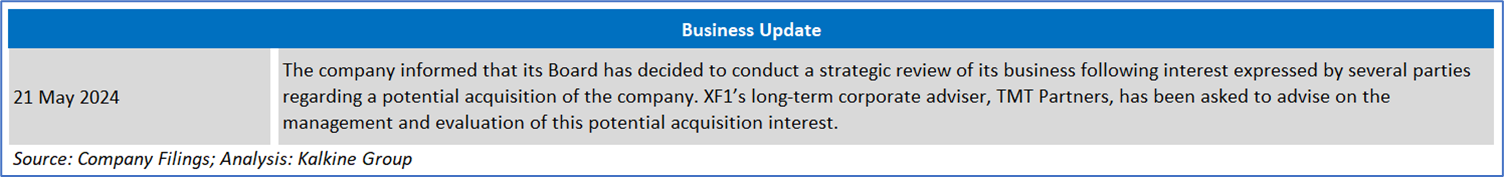
Business Update:
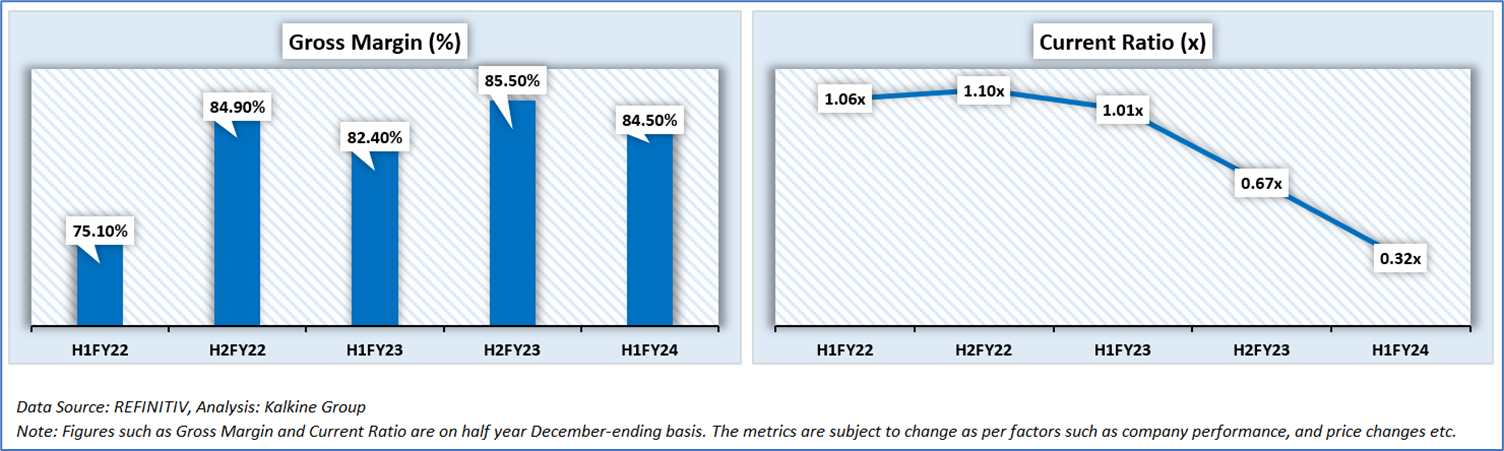
Key Ratios & Figures:
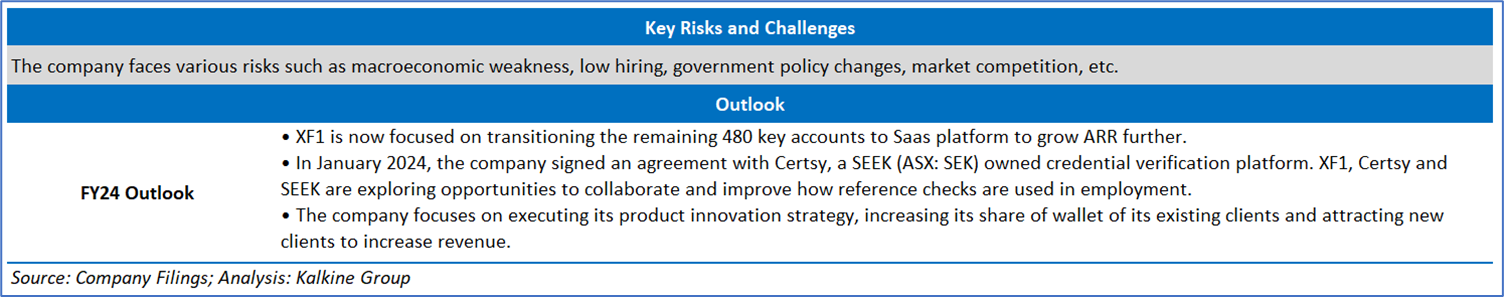
Key Risks and Outlook:
SWOT Analysis:
Valuation, Stock Recommendation and Technical Analysis:
The stock has witnessed a correction of ~16.66% in the last 9 months and over the past 12 months, it has gained by ~9.38%. The stock has a 52-week low and 52-week high of AUD 0.100 and AUD 0.230, respectively, and is currently trading above the average of 52-week high-low average. XF1 was last covered in a report dated 24 December 2020.

Markets are trading in a highly volatile zone currently due to certain macro-economic issues and geopolitical tensions prevailing. Therefore, it is prudent to follow a cautious approach while investing.
Note 1: Past performance is neither an indicator nor a guarantee of future performance.
Note 2: The reference date for all price data, currency, technical indicators, support, and resistance levels is 24 May 2024. The reference data in this report has been partly sourced from REFINITIV.
Note 3: Investment decisions should be made depending on an individual’s appetite for upside potential, risks, holding duration, and any previous holdings. An ‘Exit’ from the stock can be considered if the Target Price mentioned as per the Valuation and or the technical levels provided has been achieved and is subject to the factors discussed above.
Technical Indicators Defined: -
Support: A level at which the stock prices tend to find support if they are falling, and a downtrend may take a pause backed by demand or buying interest. Support 1 refers to the nearby support level for the stock and if the price breaches the level, then Support 2 may act as the crucial support level for the stock.
Resistance: A level at which the stock prices tend to find resistance when they are rising, and an uptrend may take a pause due to profit booking or selling interest. Resistance 1 refers to the nearby resistance level for the stock and if the price surpasses the level, then Resistance 2 may act as the crucial resistance level for the stock.
Stop-loss: It is a level to protect further losses in case of unfavourable movement in the stock prices.
Kalkine New Zealand Limited is a Financial Advice Provider (“FAP”) and is authorised by a Class 1 Financial Advice Provider Licence issued by Financial Markets Authority (“FMA”) to provide financial advice. Kalkine provides only general financial advice through its research reports following a person becoming a member. The reports contain buy/sell/hold and other recommendations in relation to equity financial products. The recommendations and opinions [on this website] / [in this report] do not take into account any of your investment objectives, financial situation or needs. Before you make a decision about whether to acquire a financial product, you should obtain the Product Disclosure Statement from the product issuer. You should consider the appropriateness of advice taking into account your own objectives, financial situation and needs and seek independent financial advice before making any financial decisions. If you act on the advice in the research reports, you may have to pay fees, expenses or other amounts (but not to Kalkine). Further information about the complaints and dispute resolution process, as well as information about Kalkine’s duties are available on Kalkine’s website. Please read our Financial Advice Provider (FAP) disclosure statement and Complaints Handling Guide, which are available on the website.
Past performance is not a reliable indicator of future performance.
 Please wait processing your request...