This report is an updated version of the report published on the 24 April 2024 at 2:07 PM AEST.
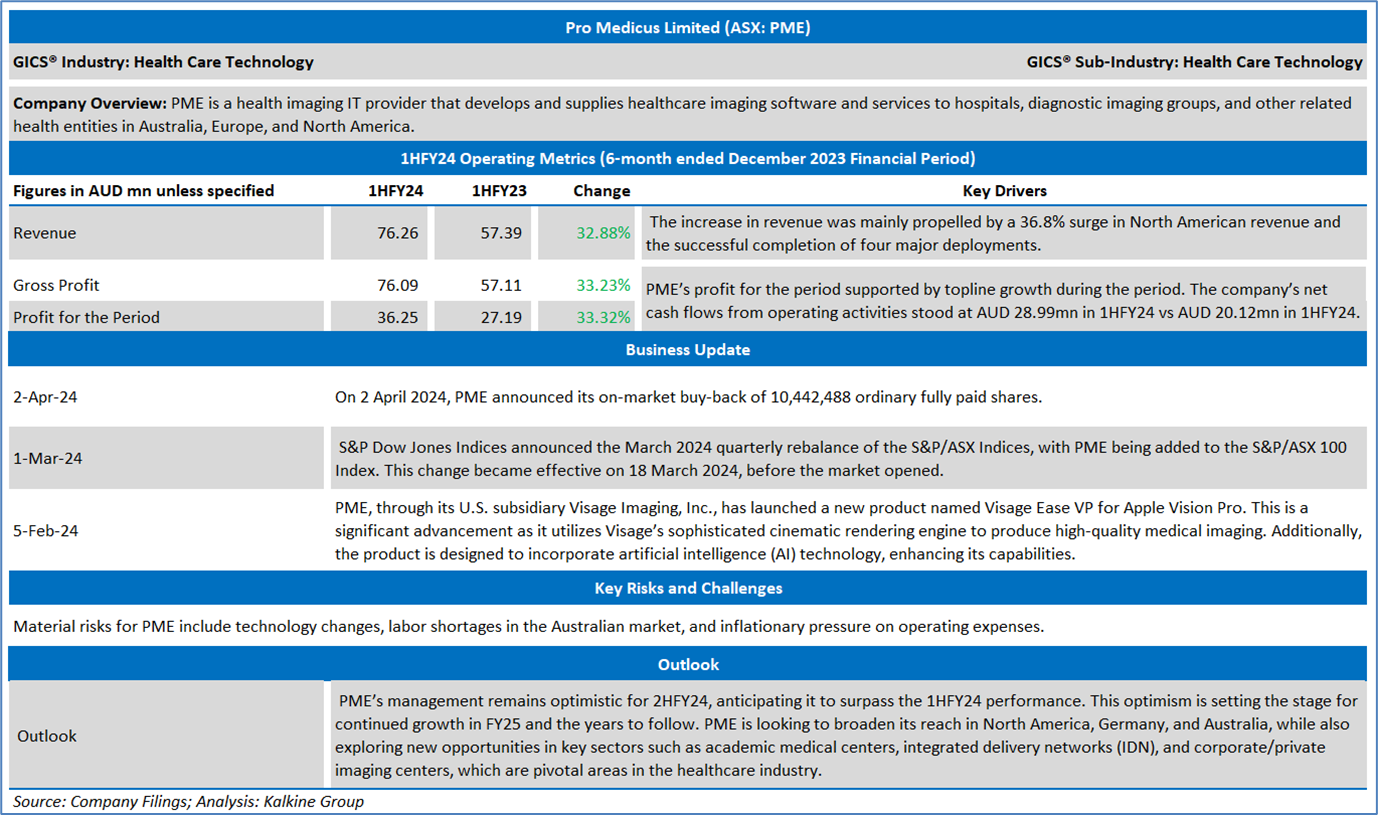
Company Overview: Overview: Pro Medicus Limited (ASX: PME) is a health imaging IT provider that develops and supplies healthcare imaging software and services to hospitals, diagnostic imaging groups and other related health entities in Australia, Europe, and North America. Appen Limited (ASX: APX) is a technology company enabling organisations to launch artificial intelligence (AI) systems. The company has more than 25 years of experience in data sourcing, data annotation, and model evaluation. Its products and services aid governments as well as players in the technology, automotive, financial services, retail, and healthcare space. This Global Artificial Intelligence & Emerging Technologies Report covers the Company Overview & Price performance, Summary table, Key positives & negatives, Key metrics, Company details, technical guidance & Stock recommendation, and Price chart.
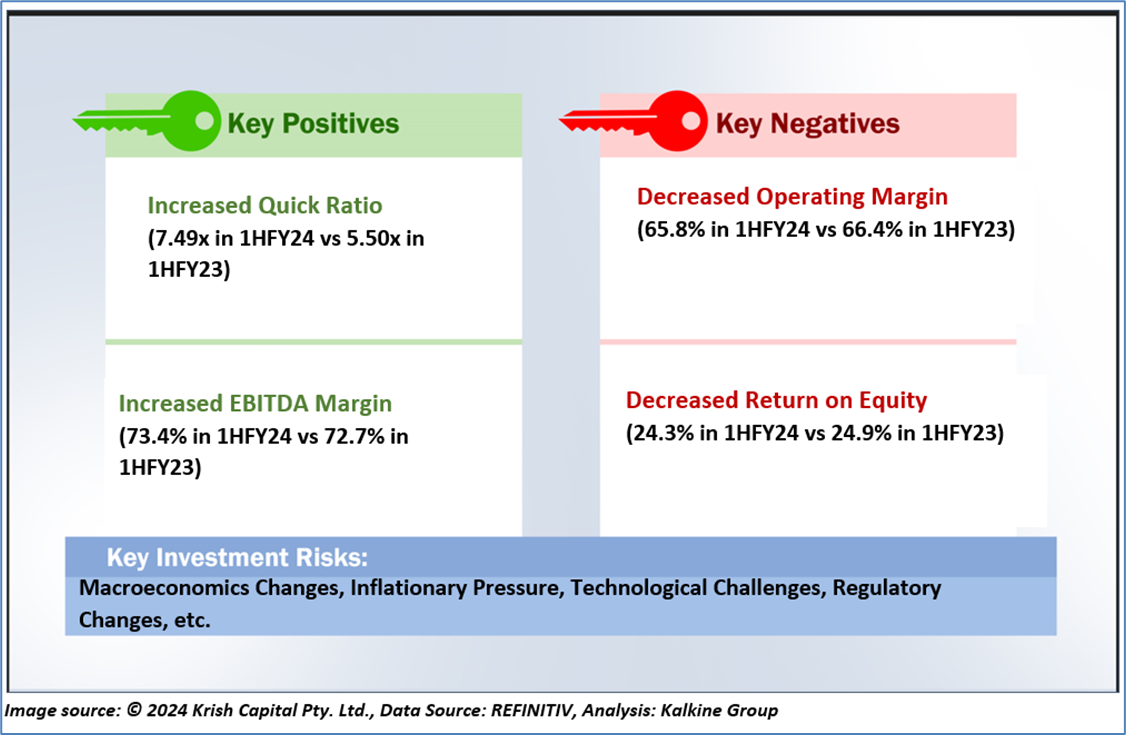
Section 1.0: Key Metrics in Pictures
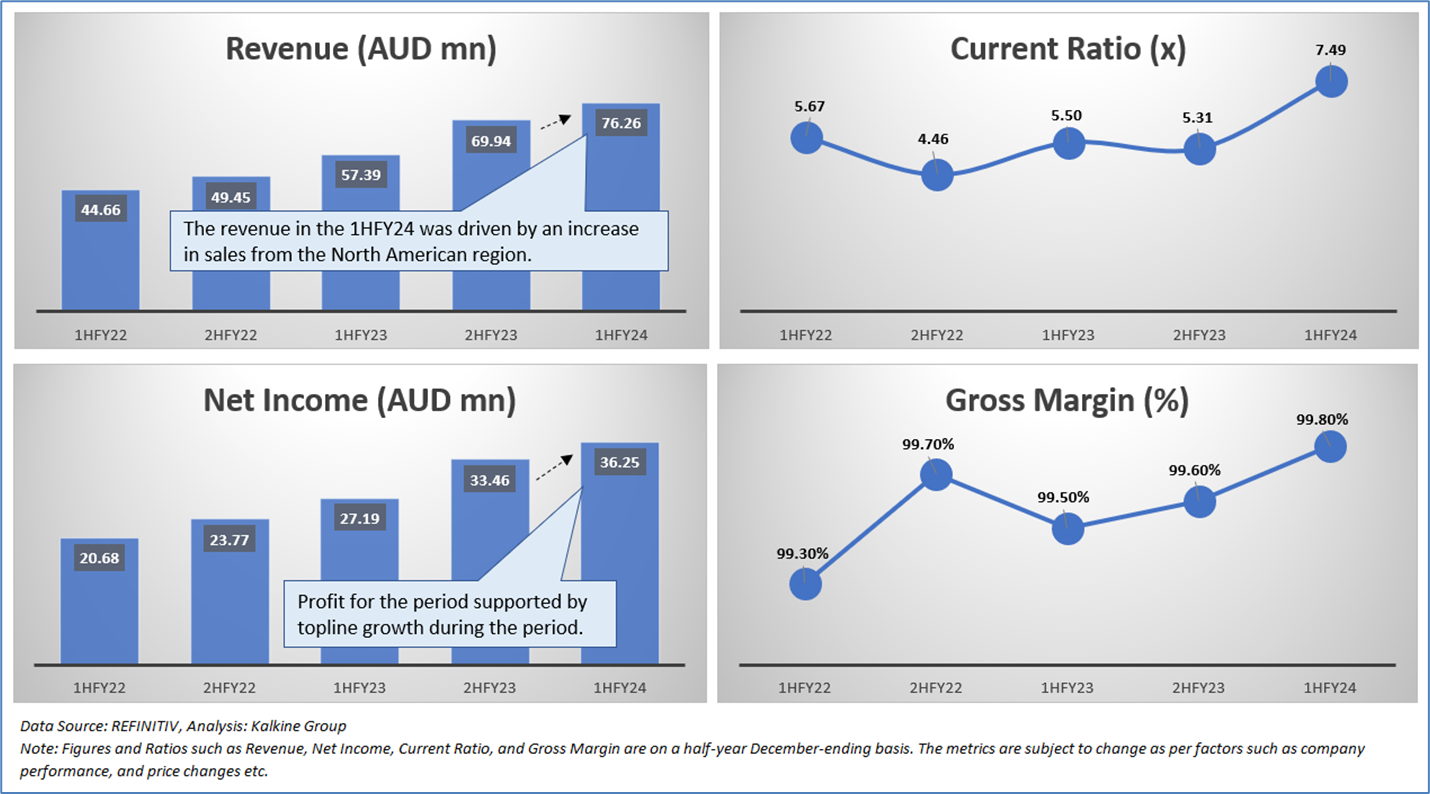
Having looked at the key financial metrics above the below sections provide in-depth fundamental, and technical analysis on this Health Care Technology Business along with recommendation, technical support, and resistance level & indicative stop-loss.
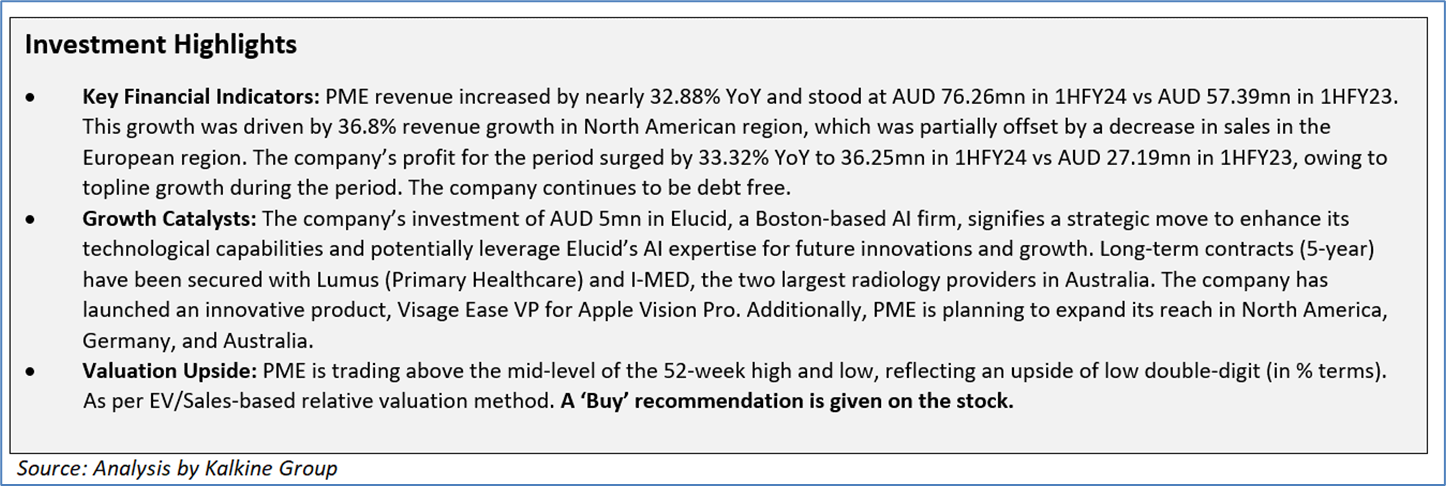
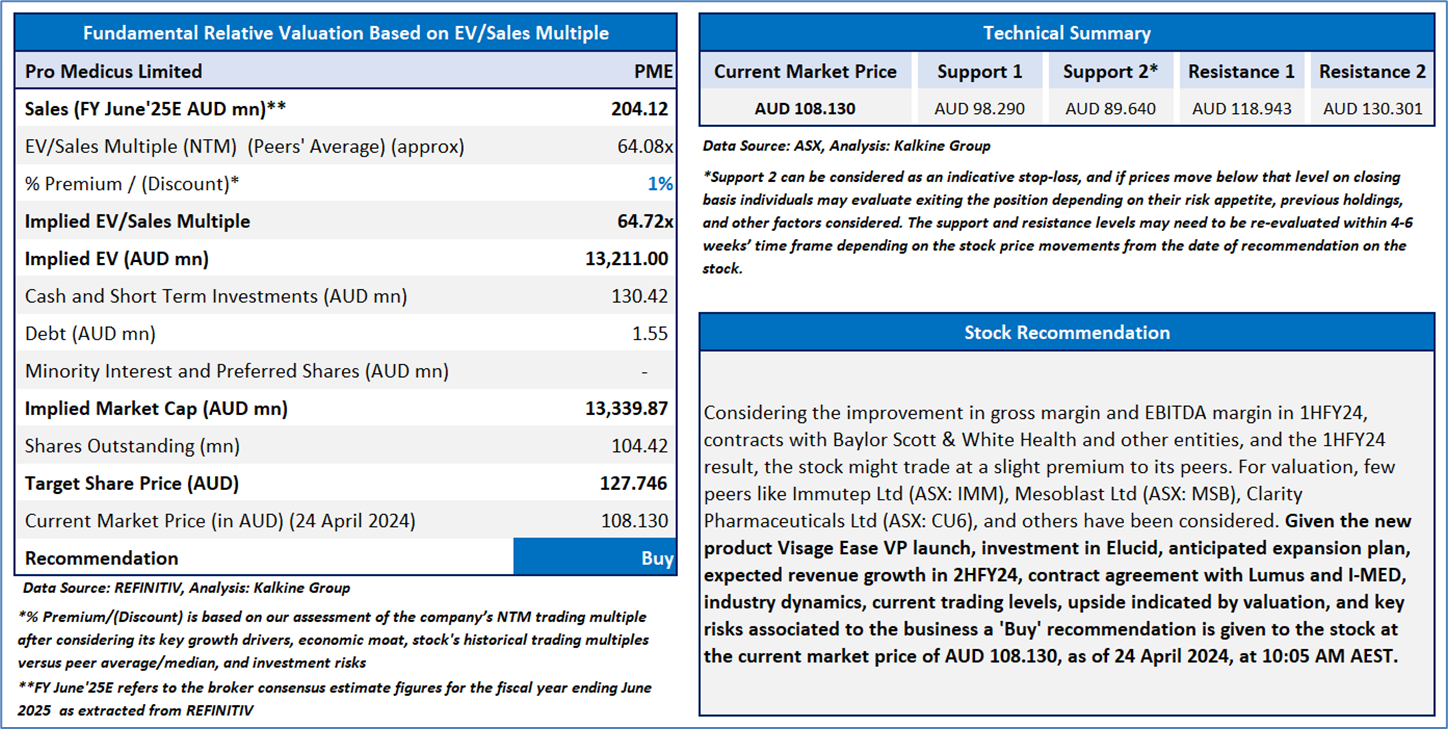
Section 2.0: Pro Medicus Limited (‘Buy’ at AUD 108.130 current market price per share as on 24 April 2024)
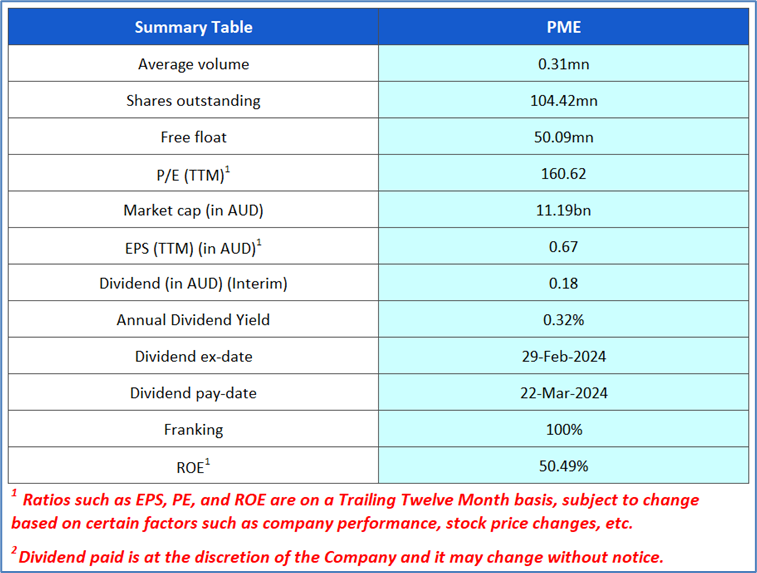
2.1 Company Details
2.2 Valuation, Technical Summary & Stock Recommendation
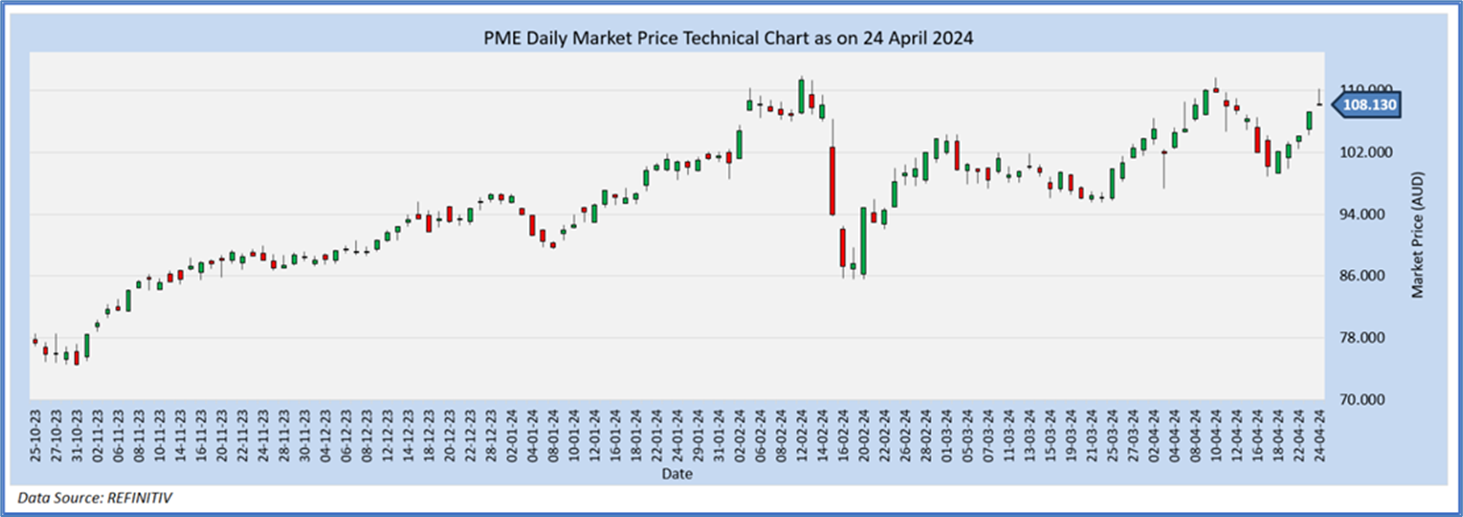
The stock has increased by ~8.2% in last one month, and over the last three months, it has moved up by ~7.38%. The stock has a 52-week low and 52-week high of AUD 58.600 and AUD 111.885, respectively and is currently trading above the 52-week high-low average. PME was last covered in a report dated ’02 November 2022’.
Appen Limited (ASX: APX)
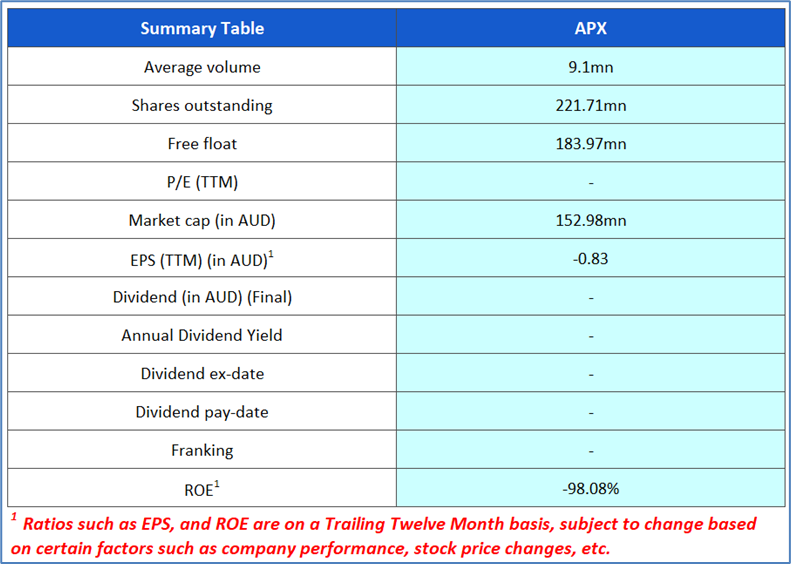
Section 3.0: Key Metrics in Pictures
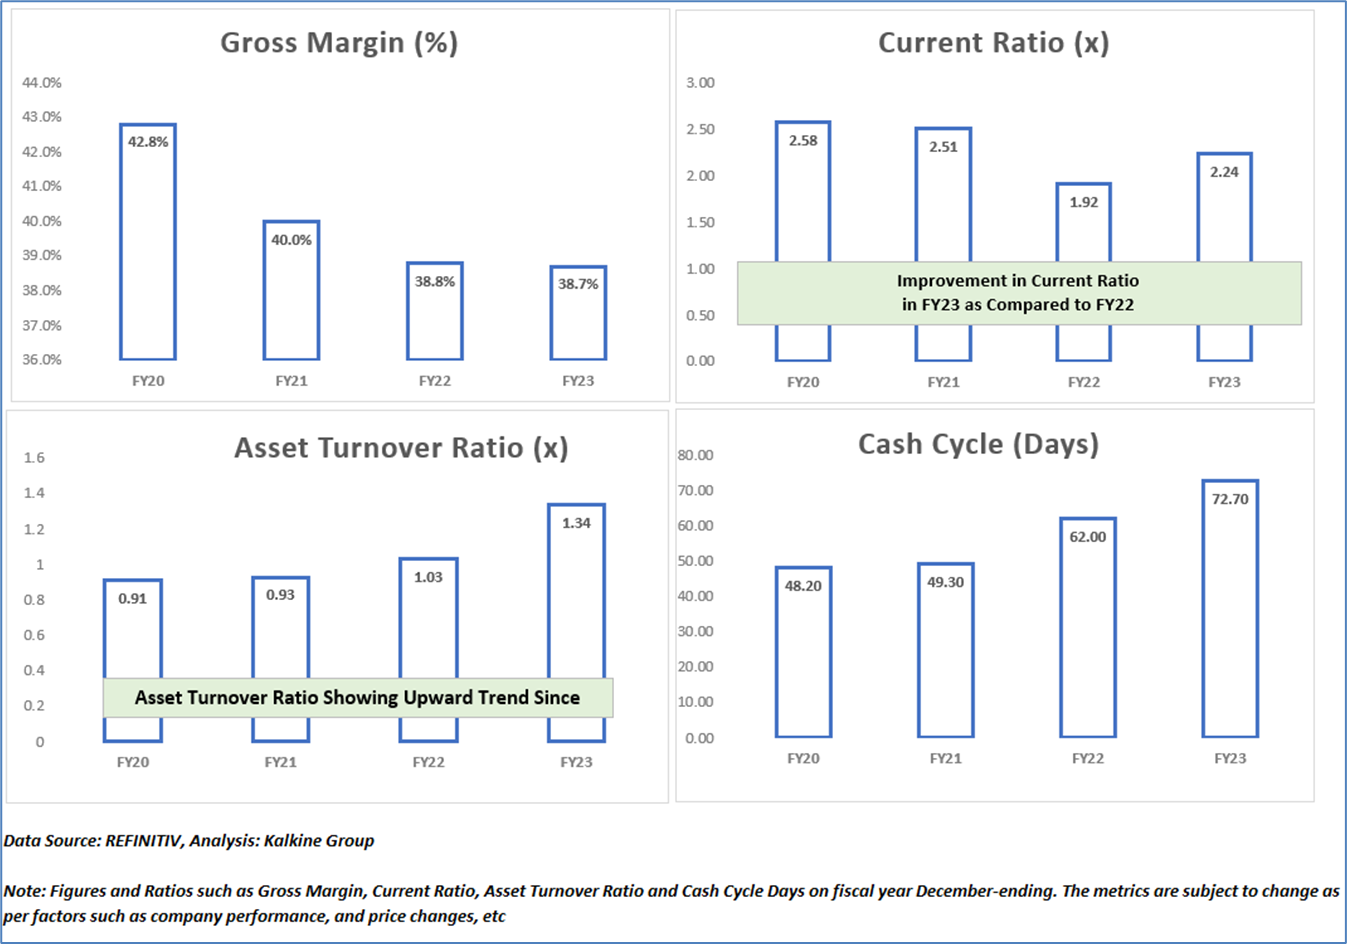
Having looked at the key financial metrics above the below sections provide in-depth fundamental, and technical analysis on this Technology Stock along with recommendation, technical support, and resistance level & indicative stop-loss.
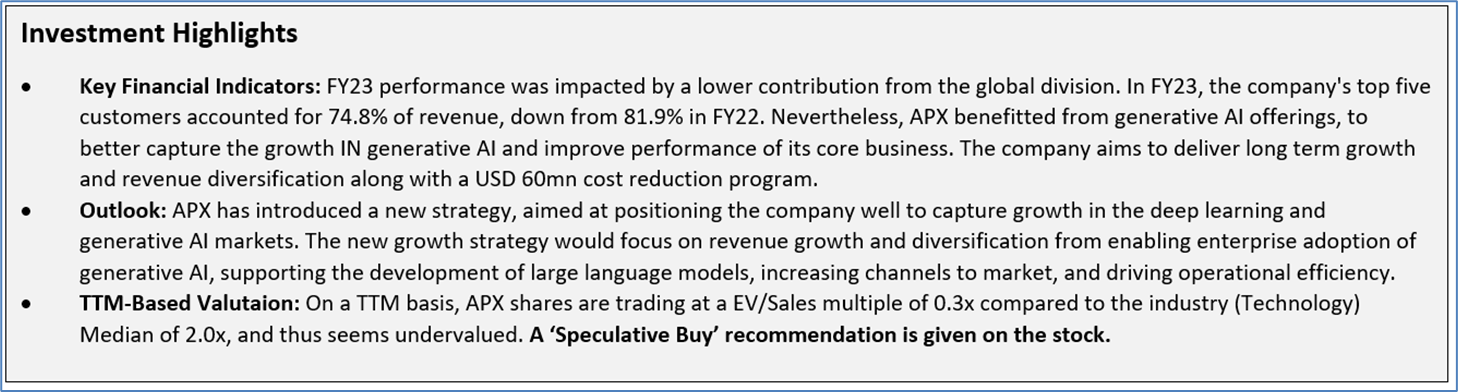
Section 4.0: Appen Limited (ASX: APX) (‘Speculative Buy’ at AUD 0.700 current market price per share as on 24 April 2024)
4.1 Company Details

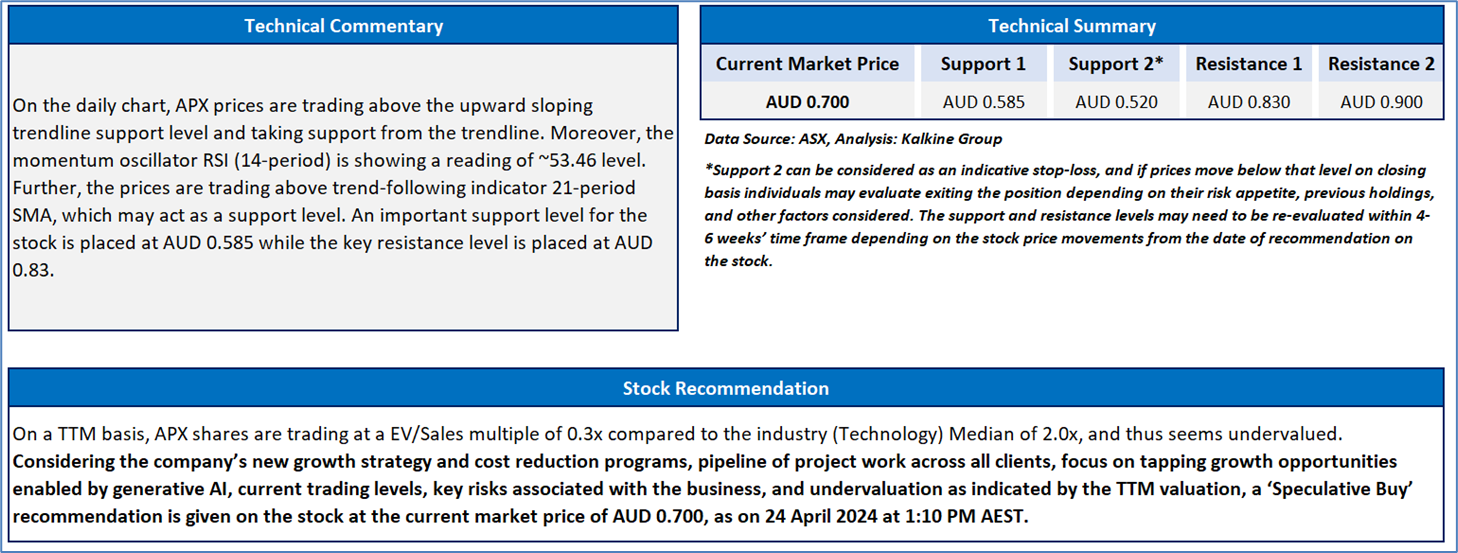
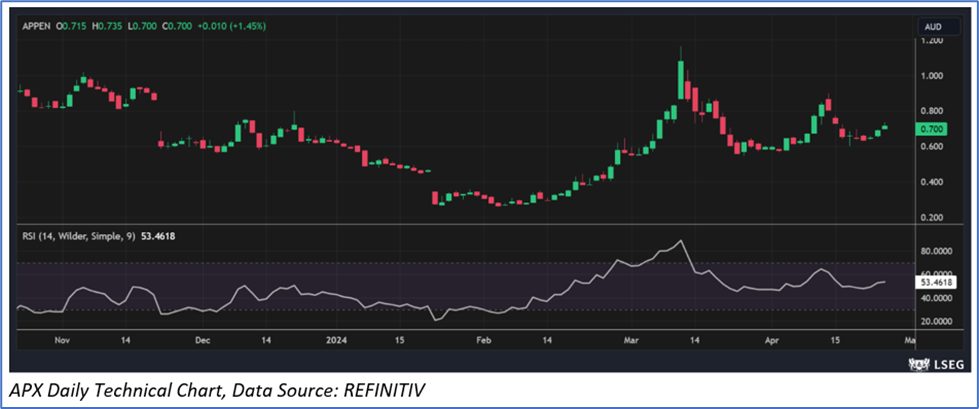
4.2 Valuation, Technical Summary & Stock Recommendation
The stock has decreased by ~21% in last six months, and over the last nine months, it has moved down by ~65%. The stock has a 52-week low and 52-week high of AUD 0.260 and AUD 3.602, respectively and is currently trading below the 52-week high-low average. APX was last covered in a report dated ’18 March 2024’.
Markets are trading in a highly volatile zone currently due to certain macro-economic issues and geopolitical issues prevailing geopolitical tensions. Therefore, it is prudent to follow a cautious approach while investing.
Note 1: Past performance is neither an Indicator nor a guarantee of future performance.
Note 2: The reference date for all price data, currency, technical indicators, support, and resistance levels is 24 April 2024. The reference data in this report has been partly sourced from REFINITIV.
Note 3: Investment decisions should be made depending on an individual’s appetite for upside potential, risks, holding duration, and any previous holdings. An ‘Exit’ from the stock can be considered if the Target Price mentioned as per the Valuation and or the technical levels provided has been achieved and is subject to the factors discussed above.
Note 4: Dividend Yield may vary as per the stock price movement.
Technical Indicators Defined: -
Support: A level at which the stock prices tend to find support if they are falling, and a downtrend may take a pause backed by demand or buying interest. Support 1 refers to the nearby support level for the stock and if the price breaches the level, then Support 2 may act as the crucial support level for the stock.
Resistance: A level at which the stock prices tend to find resistance when they are rising, and an uptrend may take a pause due to profit booking or selling interest. Resistance 1 refers to the nearby resistance level for the stock and if the price surpasses the level, then Resistance 2 may act as the crucial resistance level for the stock.
Stop-loss: It is a level to protect further losses in case of unfavourable movement in the stock prices.
Disclaimer
Kalkine New Zealand Limited is a Financial Advice Provider (“FAP”) and is authorised by a Class 1 Financial Advice Provider Licence issued by Financial Markets Authority (“FMA”) to provide financial advice. Kalkine provides only general financial advice through its research reports following a person becoming a member. The reports contain buy/sell/hold and other recommendations in relation to equity financial products. The recommendations and opinions [on this website] / [in this report] do not take into account any of your investment objectives, financial situation or needs. Before you make a decision about whether to acquire a financial product, you should obtain the Product Disclosure Statement from the product issuer. You should consider the appropriateness of advice taking into account your own objectives, financial situation and needs and seek independent financial advice before making any financial decisions. If you act on the advice in the research reports, you may have to pay fees, expenses or other amounts (but not to Kalkine). Further information about the complaints and dispute resolution process, as well as information about Kalkine’s duties are available on Kalkine’s website. Please read our Financial Advice Provider (FAP) disclosure statement and Complaints Handling Guide, which are available on the website.
Past performance is not a reliable indicator of future performance.
 Please wait processing your request...