Section 1: Company Overview and Fundamentals
1.1 Company Overview:
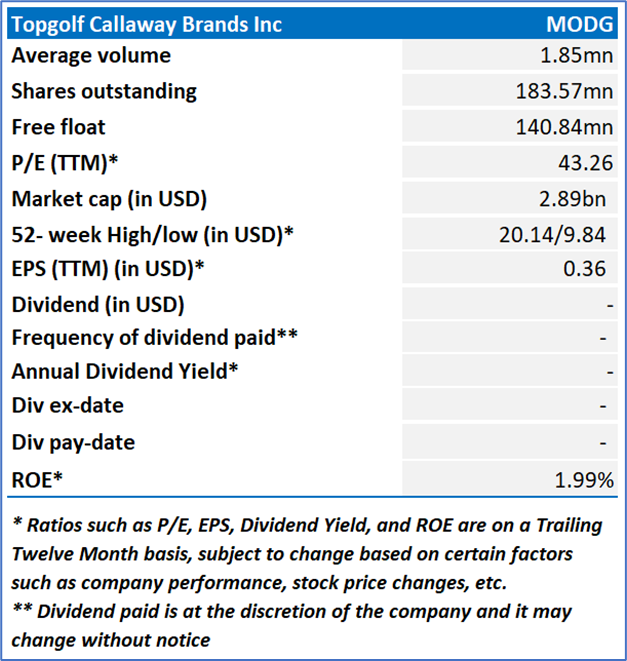
Topgolf Callaway Brands Corp. (NYSE: MODG) is a golf and active lifestyle company. The Company provides golf entertainment experiences, designs, and manufactures golf equipment, and sells golf and active lifestyle apparel and other accessories through its family of brand names, which include Topgolf, Callaway Golf, Odyssey, TravisMathew, Jack Wolfskin, OGIO, Toptracer and World Golf Tour. Its segments include Topgolf, Golf Equipment, and Active Lifestyle.
Kalkine’s Diversified Opportunities Report covers the Company Overview, Key positives & negatives, Investment summary, Key investment metrics, Top 10 shareholding, Business updates and insights into company recent financial results, Key Risks & Outlook, Price performance and technical summary, Target Price, and Recommendation on the stock.
Stock Performance:
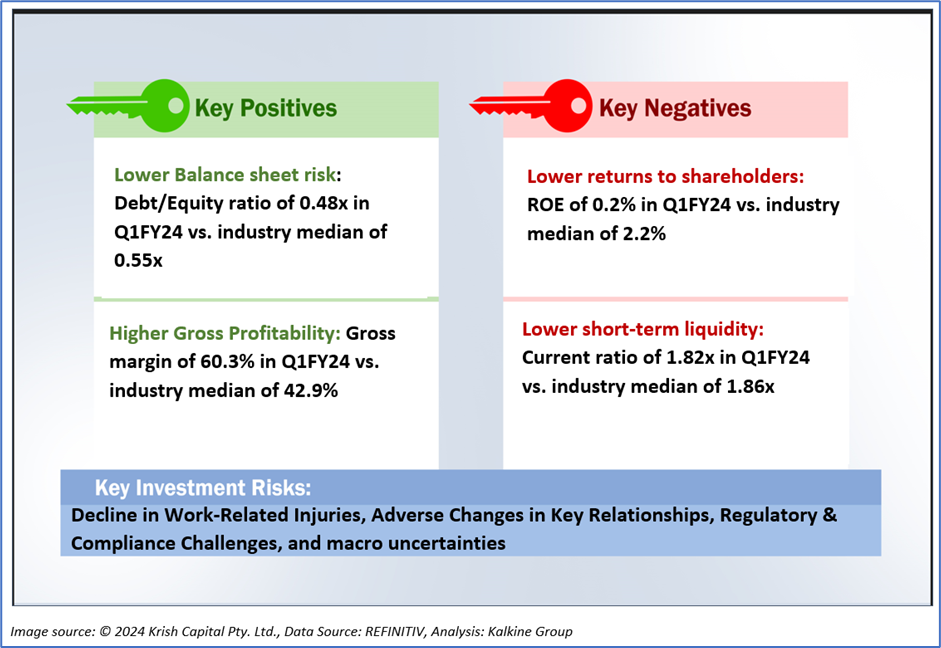
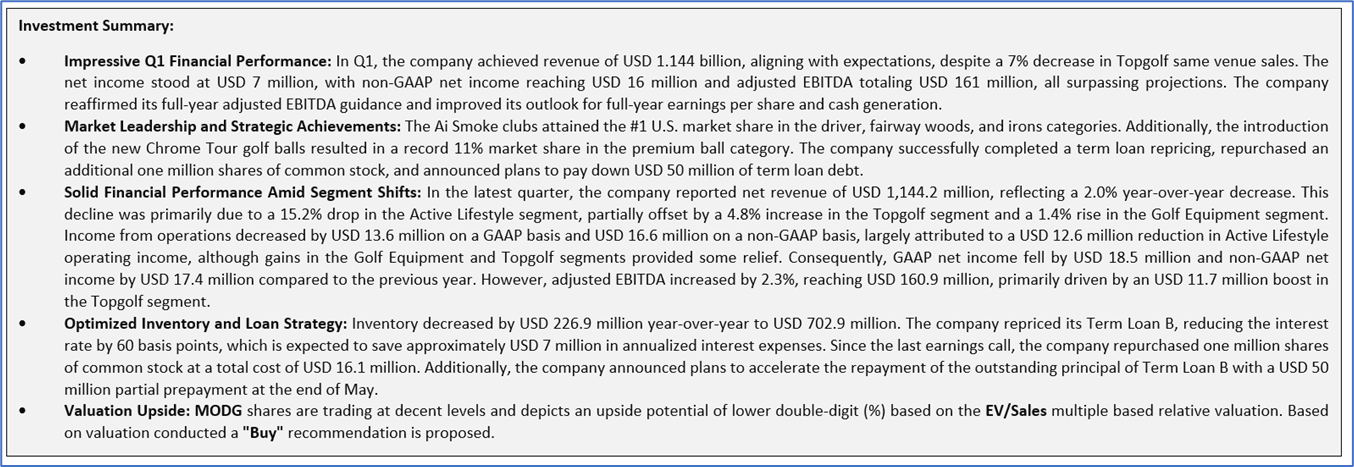
1.2 The Key Positives, Negatives, and Investment summary
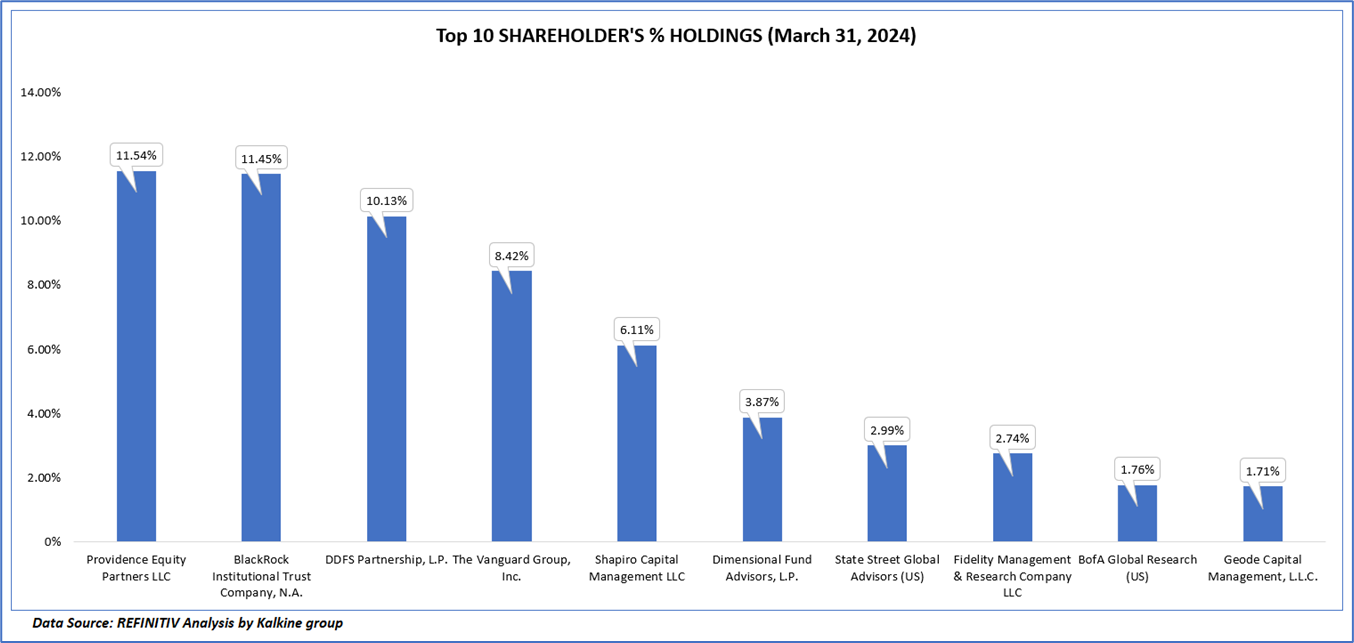
1.3 Top 10 shareholders:
The top 10 shareholders together form ~60.72% of the total shareholding, signifying concentrated shareholding. Providence Equity Partners LLC., and BlackRock Institutional Trust Company, N.A. are the biggest shareholders, holding the maximum stake in the company at 11.54% and 11.45%, respectively.
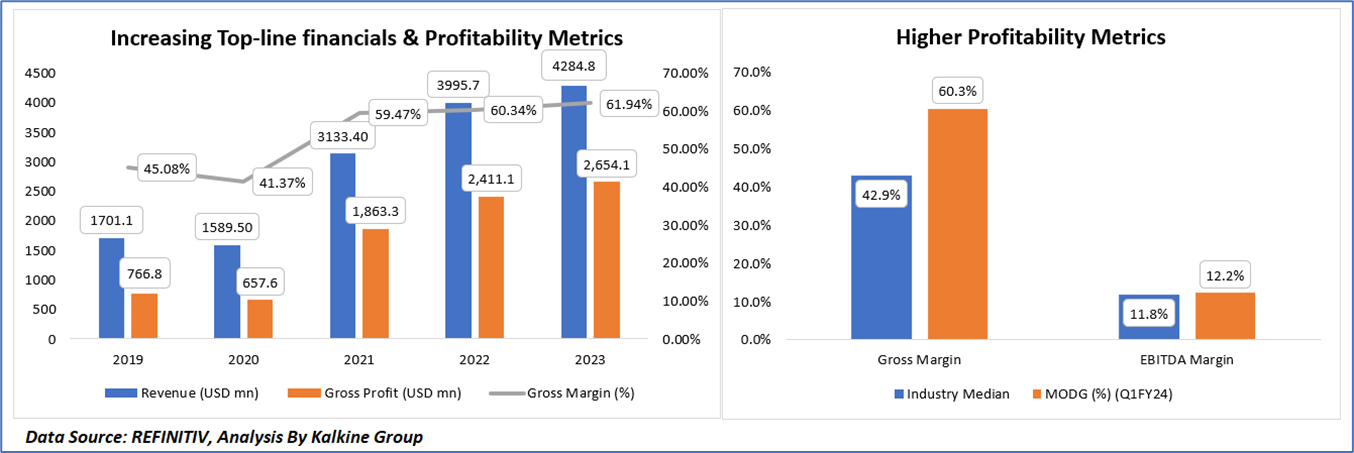
1.4 Key Metrics
From 2019 to 2023, MODG's revenue has shown a substantial growth trajectory, rising from USD 1,701.1 million in 2019 to USD 4,284.8 million in 2023. This growth is highlighted by a significant increase in gross profit, which escalated from USD 766.8 million in 2019 to USD 2,654.1 million in 2023. Correspondingly, MODG's gross margin improved markedly from 45.08% in 2019 to 61.94% in 2023, showcasing the company's enhanced efficiency and profitability over the years.
Comparatively, for Q1 FY2024, MODG achieved a gross margin of 60.3%, well above the industry median of 42.9%, indicating superior cost management and pricing strategies. Furthermore, MODG's EBITDA margin for the same period was 12.2%, slightly surpassing the industry median of 11.8%, reflecting robust operational performance despite market challenges. This performance underscores MODG's strong market position and operational effectiveness in generating higher profitability relative to industry standards.
Section 2: Business Updates and Corporate Business Highlights
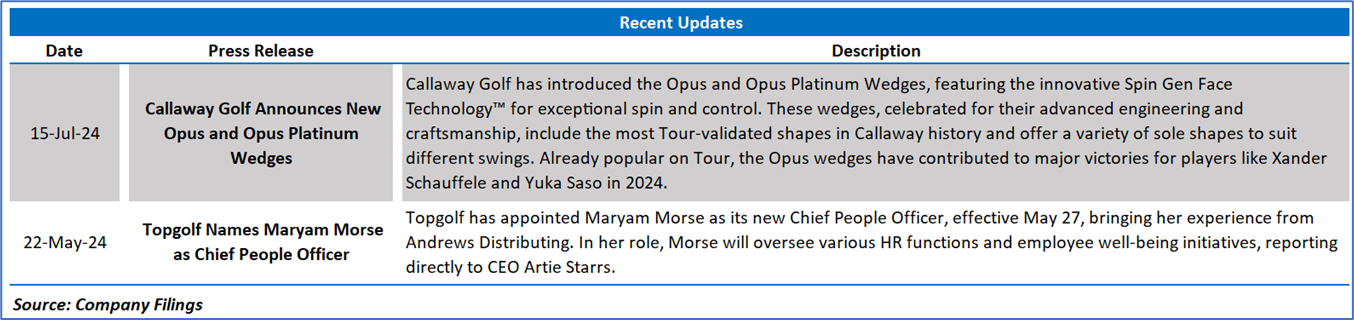
2.1 Recent Updates:
The below picture gives an overview of the recent updates:
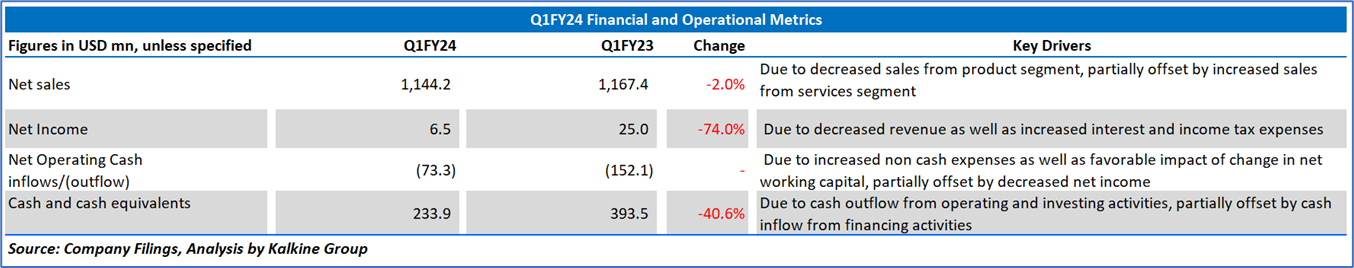
2.2 Insights of Q1FY24:
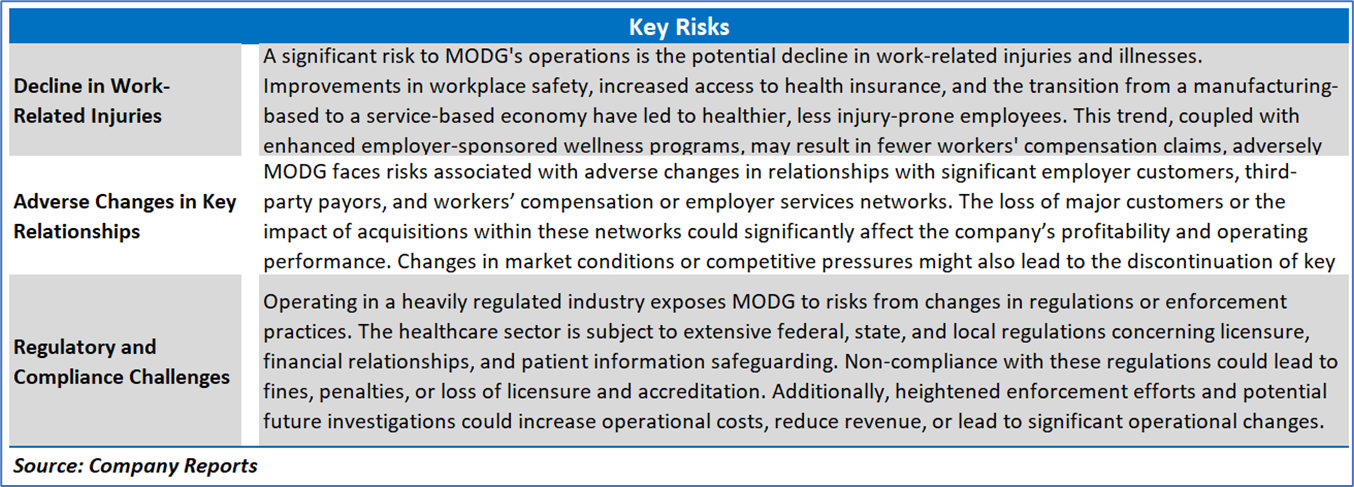
Section 3: Key Risks & Outlook

Section 4: Stock Recommendation Summary:
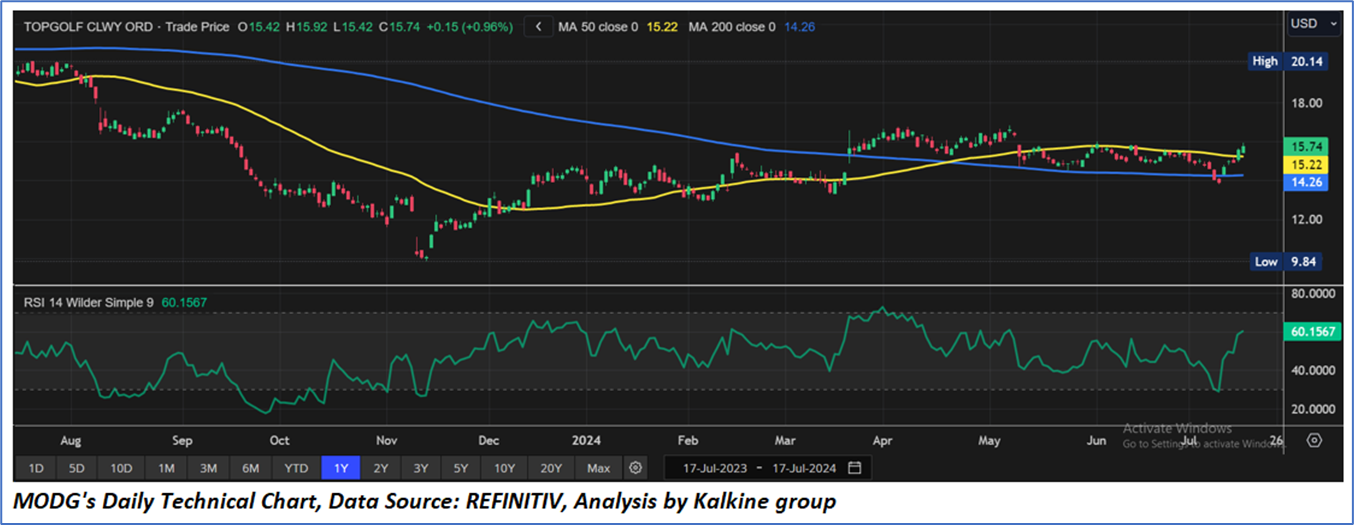
4.1 Price Performance and Technical Summary:
Stock Performance:
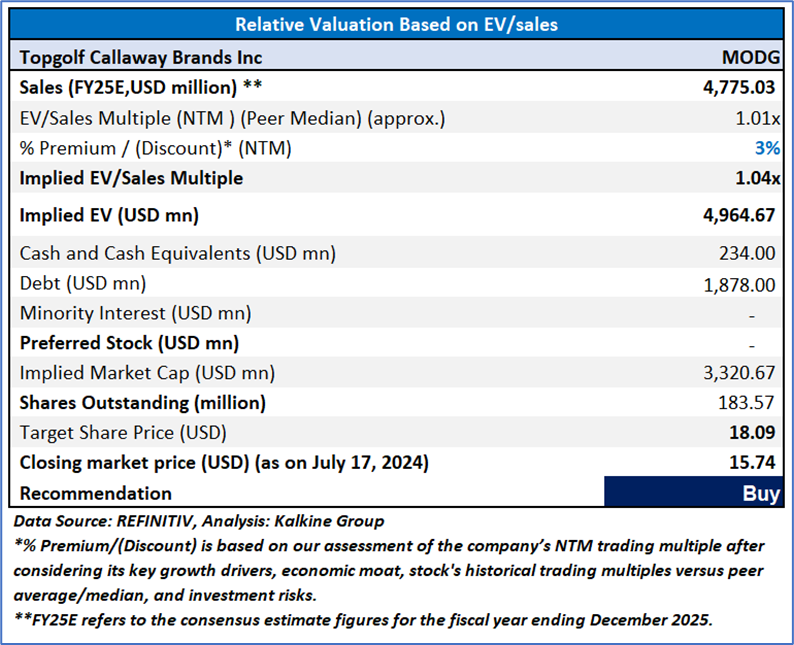
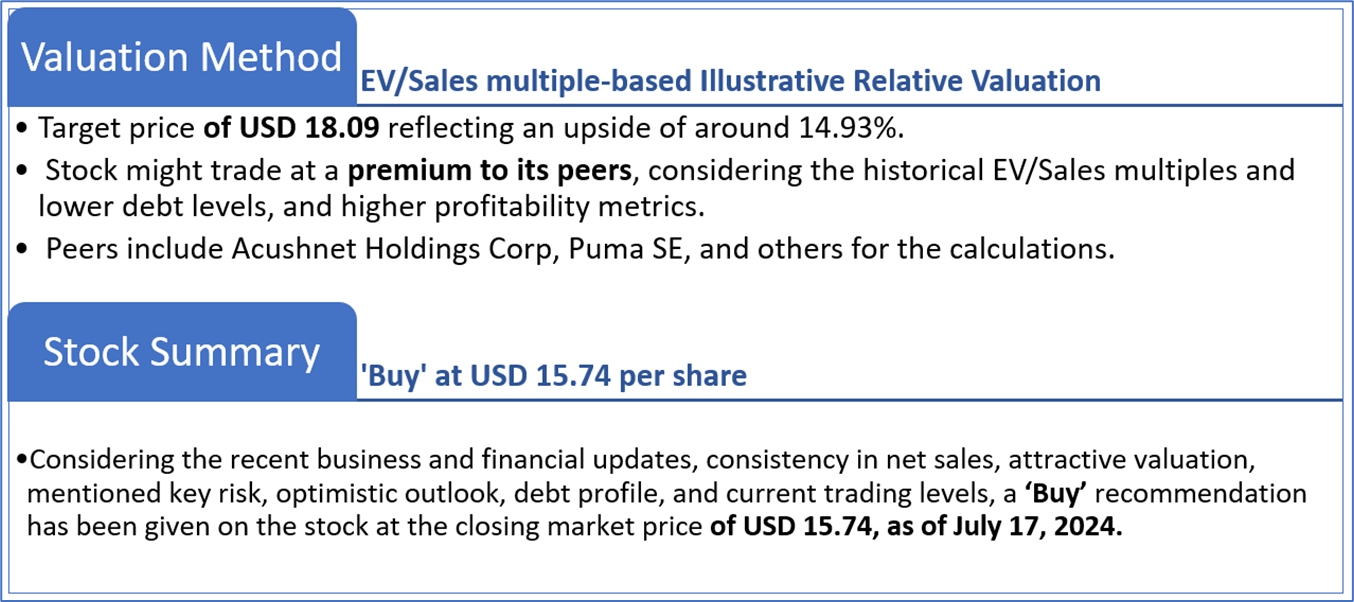
4.2 Fundamental Valuation
Valuation Methodology: EV/Sales Multiple Based Relative Valuation
Markets are trading in a highly volatile zone currently due to certain macroeconomic issues and geopolitical tensions prevailing. Therefore, it is prudent to follow a cautious approach while investing.
Note 1: Past performance is not a reliable indicator of future performance.
Note 2: The reference date for all price data, currency, technical indicators, support, and resistance levels is July 17, 2024. The reference data in this report has been partly sourced from REFINITIV.
Note 3: Investment decisions should be made depending on an individual's appetite for upside potential, risks, holding duration, and any previous holdings. An 'Exit' from the stock can be considered if the Target Price mentioned as per the Valuation and or the technical levels provided has been achieved and is subject to the factors discussed above.
Note 4: The report publishing date is as per the Pacific Time Zone.
Technical Indicators Defined: -
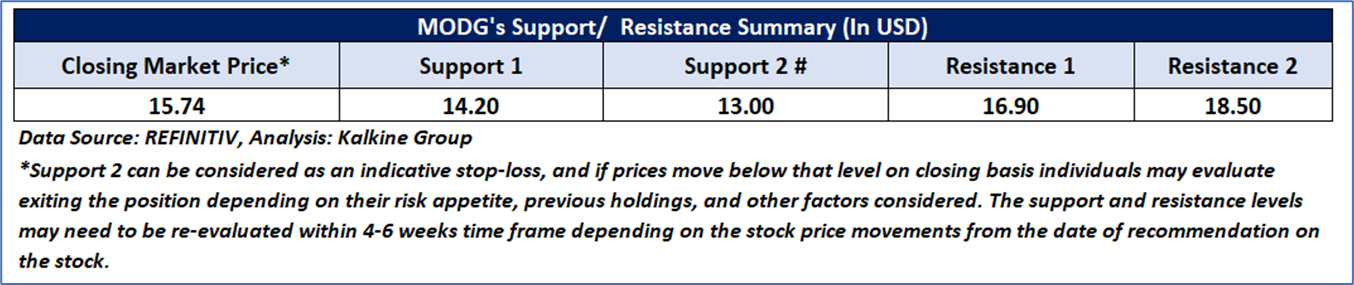
Support: A level at which the stock prices tend to find support if they are falling, and a downtrend may take a pause backed by demand or buying interest. Support 1 refers to the nearby support level for the stock and if the price breaches the level, then Support 2 may act as the crucial support level for the stock.
Resistance: A level at which the stock prices tend to find resistance when they are rising, and an uptrend may take a pause due to profit booking or selling interest. Resistance 1 refers to the nearby resistance level for the stock and if the price surpasses the level, then Resistance 2 may act as the crucial resistance level for the stock.
Stop-loss: It is a level to protect against further losses in case of unfavorable movement in the stock prices.
Disclaimer This report has been issued by Kalkine New Zealand Limited (FSP691351) (NZBN:9429047678101) (“Kalkine”). Kalkine is a Financial Advice Provider (“FAP”) and is authorised by a Class 1 Financial Advice Provider Licence issued by Financial Markets Authority (“FMA”) to provide financial advice. Kalkine provides only general financial advice through its research reports following a person becoming a member. The reports contain buy/sell/hold and other recommendations in relation to equity securities, managed funds and other managed investment schemes and other financial advice products. The recommendations and opinions in this report and on Kalkine website do not take into account any of your investment objectives, financial situation or needs. Before you make a decision about whether to acquire a financial product, you should obtain the Product Disclosure Statement from the product issuer. You should consider the appropriateness of advice taking into account your own objectives, financial situation and needs and seek independent financial advice before making any financial decisions. If you act on the advice in the research reports, you may have to pay fees, expenses or other amounts (but not to Kalkine). Further information about the complaints and dispute resolution process, as well as information about Kalkine’s duties are available on Kalkine’s website. Please read our Financial Advice Provider (FAP) disclosure statement and Complaints Handling Guide, which are available on the website.
Past performance is not a reliable indicator of future performance.
 Please wait processing your request...