Section 1: Company Overview and Fundamentals
1.1 Company Overview:
Thermo Fisher Scientific Inc (NYSE: TMO) focuses on advancing life sciences research, addressing intricate analytical problems, enhancing laboratory efficiency, and supporting patient health through diagnostics and the creation and production of transformative therapies.
Kalkine’s Low Carbon Research Report covers the Investment Highlights, Low Carbon Emission Initiatives, Key Financial Metrics, Risks, and Technical Analysis along with the Valuation, Target Price, and Recommendation on the stock.
Stock Performance:
1.2 Why do Low Carbon Emissions matter?
The shift toward a low-carbon economy is one of the most significant challenges of current time, spurred by the urgent need to combat climate change and reduce the environmental impact of corporate activities. This report covers the US-listed low-carbon emission company Thermo Fisher Scientific Inc (NYSE: TMO), that is committed to sustainability and responsible environmental practices.
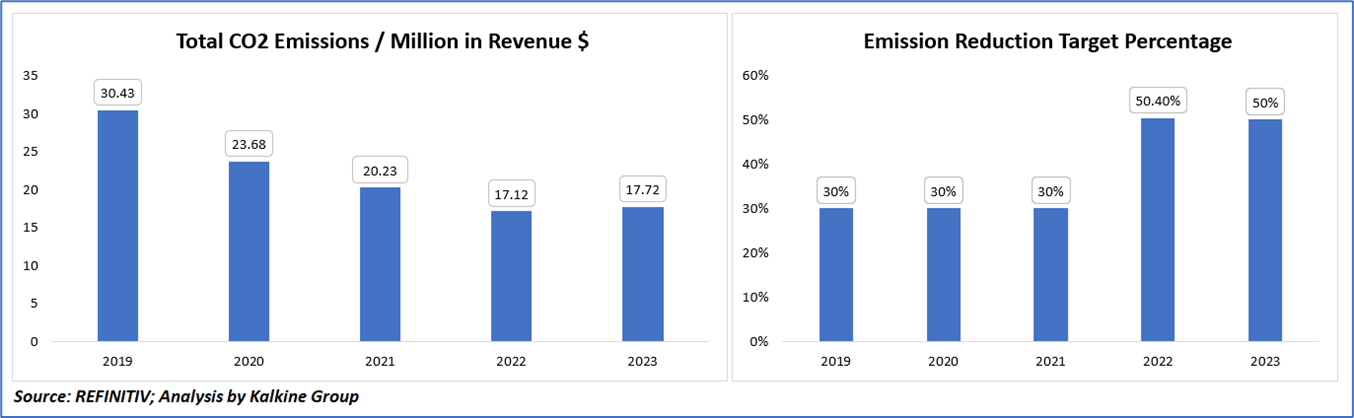
Carbon and Waste Management - Key Metrics
The charts illustrate Thermo Fisher Scientific’s progress in reducing carbon intensity and aligning emission reduction targets over five years. From 2019 to 2023, total CO₂ emissions per million dollars in revenue dropped significantly from 30.43 to 17.72, reflecting improved operational efficiency and sustainability efforts. Despite a slight uptick in 2023, emissions remain well below 2019 levels. Simultaneously, the company elevated its emission reduction target from a consistent 30% (2019–2021) to over 50% in 2022 and 2023, signaling a more aggressive climate strategy. This alignment between measurable performance and ambitious targets underscores Thermo Fisher’s commitment to environmental stewardship.
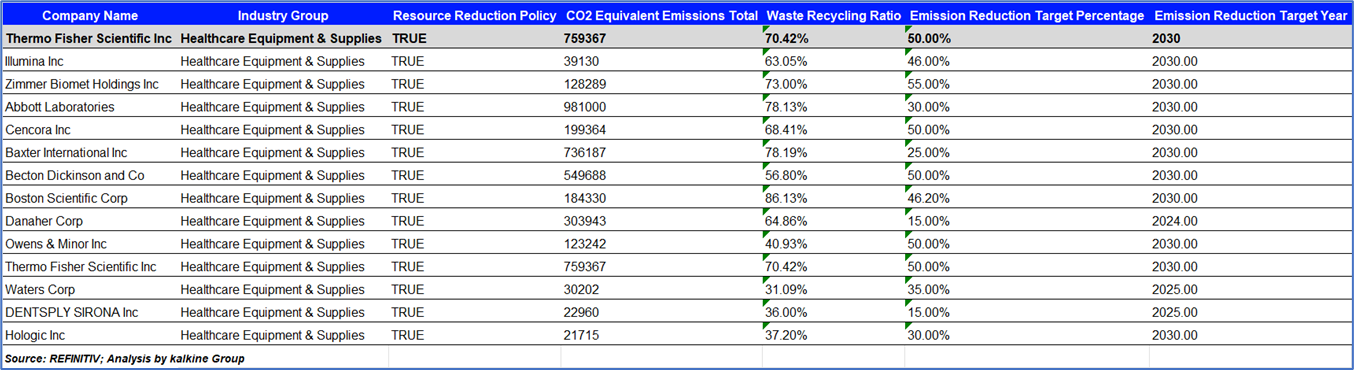
Peer Comparison: Carbon Emission and Waste Management Metrics
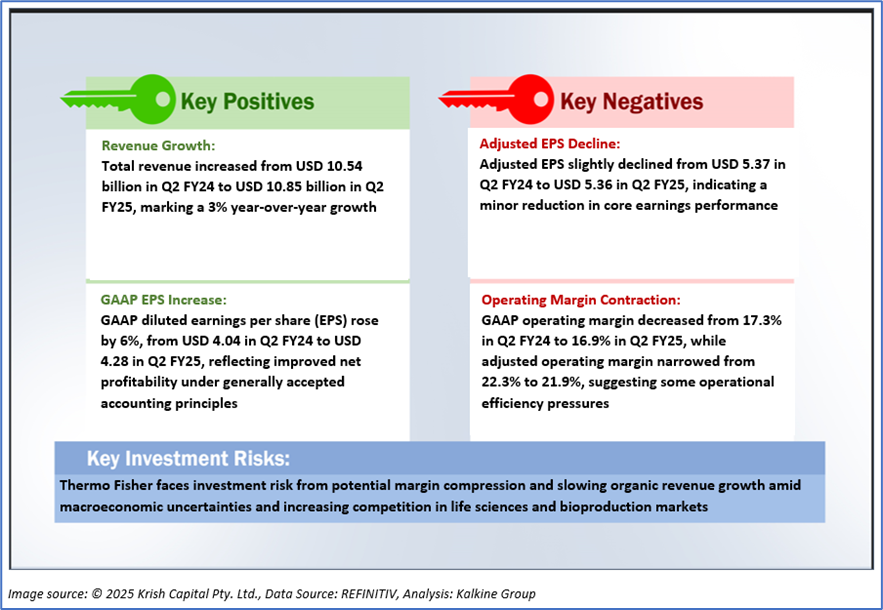
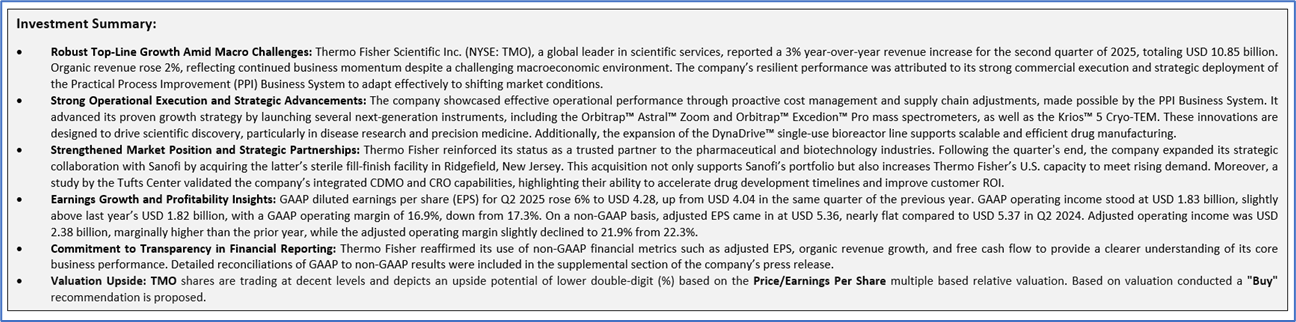
1.2 The Key Positives, Negatives, and Investment summary
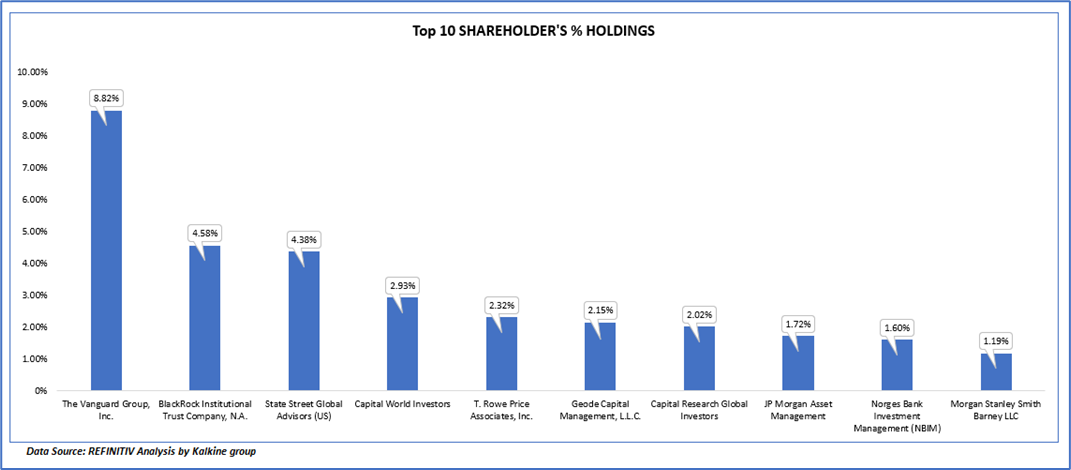
1.3 Top 10 shareholders (As of 31 March 2025):
The top 10 shareholders together form ~31.71% of the total shareholding, signifying concentrated shareholding. The Vanguard Group, Inc. and BlackRock Institutional Trust Company, N.A. are the biggest shareholders, holding the maximum stake in the company at 8.82% and 4.58%, respectively.
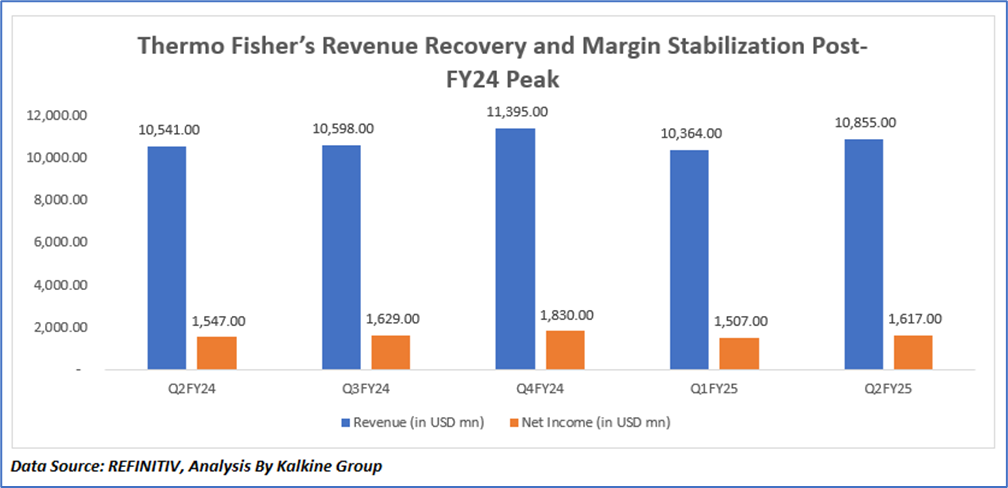
1.4 Key Metrics
The chart highlights Thermo Fisher Scientific’s revenue and net income trends from Q2 FY24 to Q2 FY25, showing a peak in Q4 FY24 followed by a typical seasonal dip in Q1 FY25 and a recovery in Q2 FY25. Revenue rose from USD 10.54 billion in Q2 FY24 to USD 10.86 billion in Q2 FY25, supported by new product launches and strategic partnerships. Net income followed a similar trajectory, dipping in Q1 FY25 before improving in Q2, though growth remained moderate due to margin compression and increased capital investments. Overall, the trend reflects the company’s resilience and operational adaptability amid macroeconomic headwinds.
Section 2: Business Updates and Corporate Business Highlights
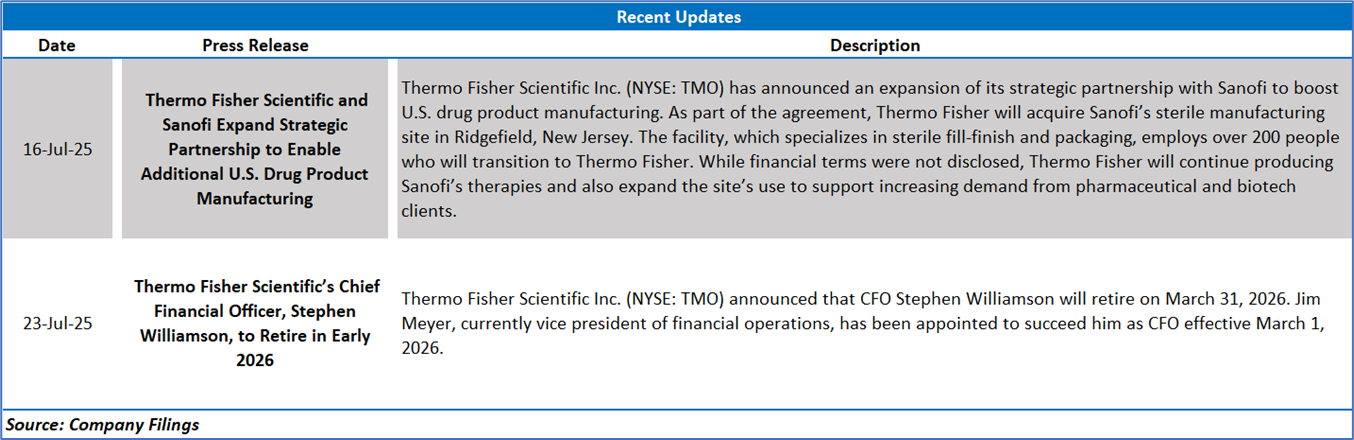
2.1 Business Updates:
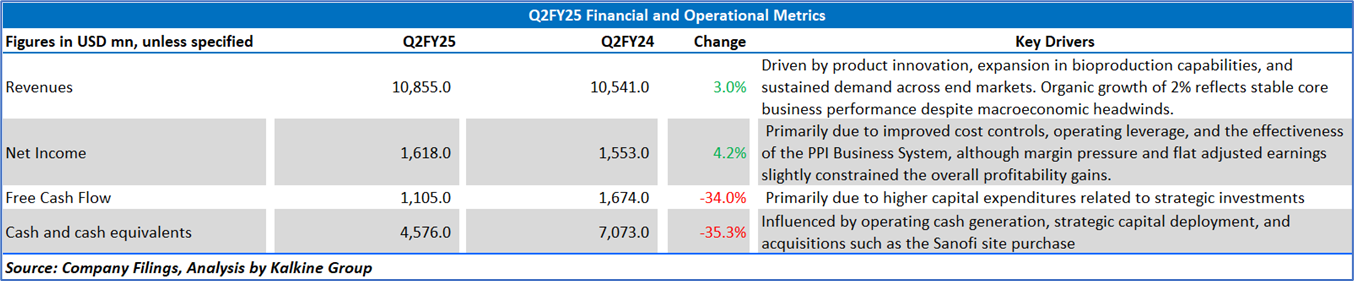
2.2 Insights of Q2 FY25:
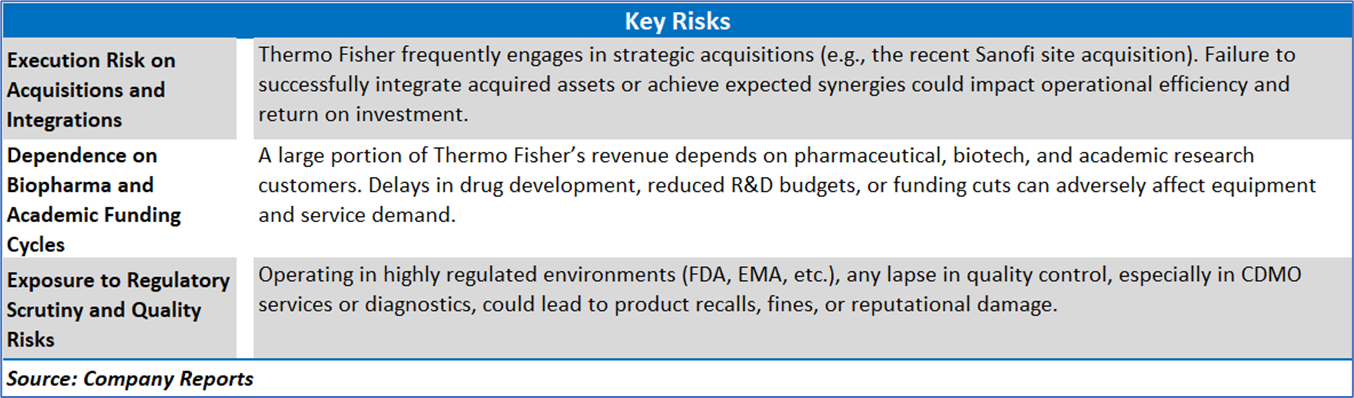
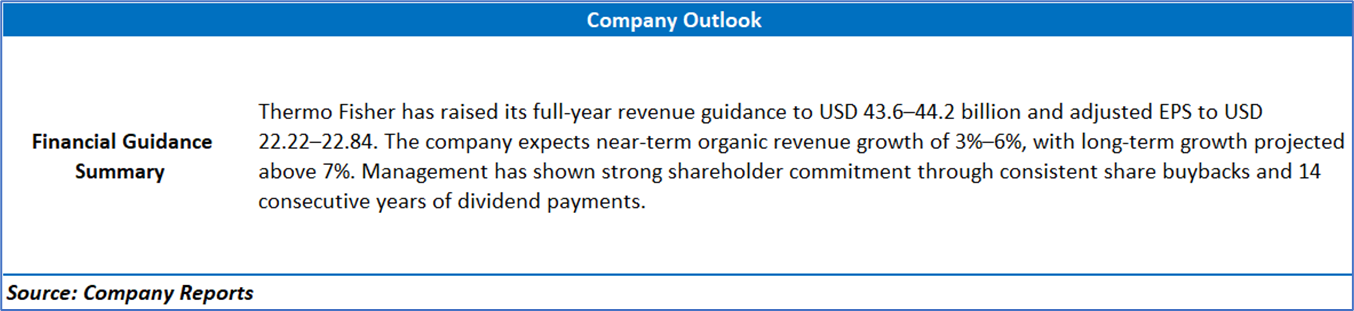
Section 3: Key Risks & Outlook
Section 4: Stock Recommendation Summary:
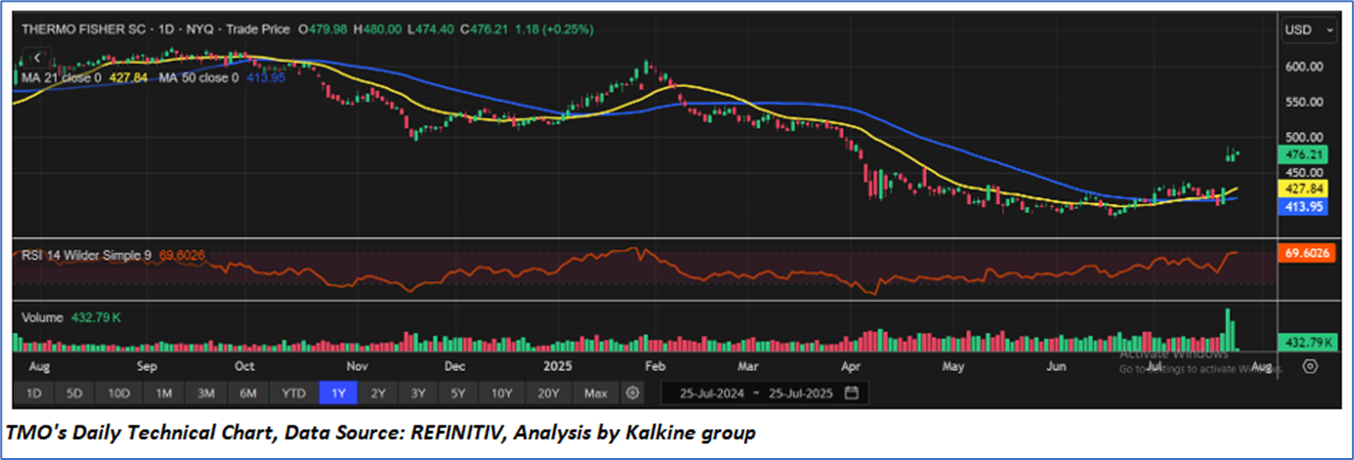
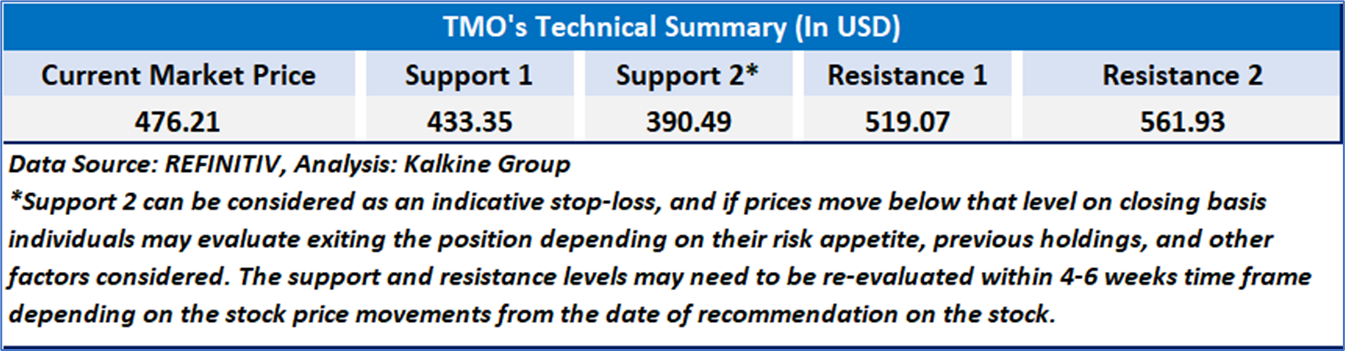
4.1 Price Performance and Technical Summary:
Stock Performance:
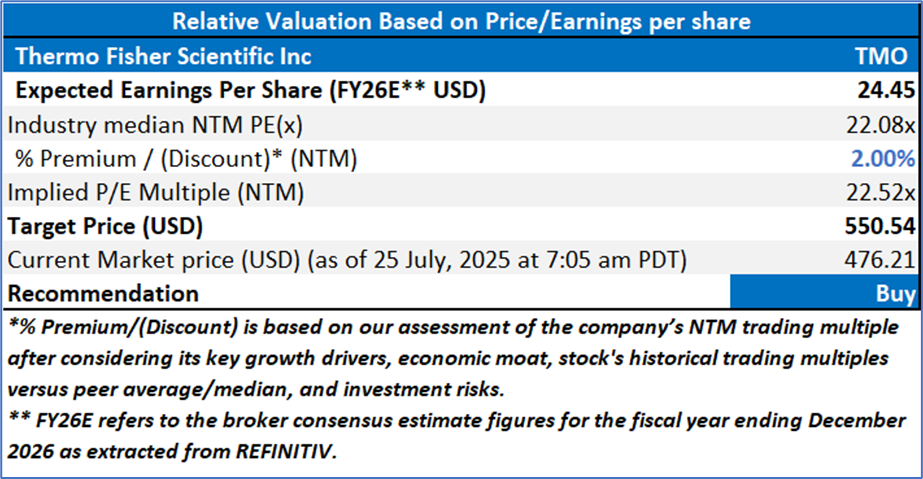
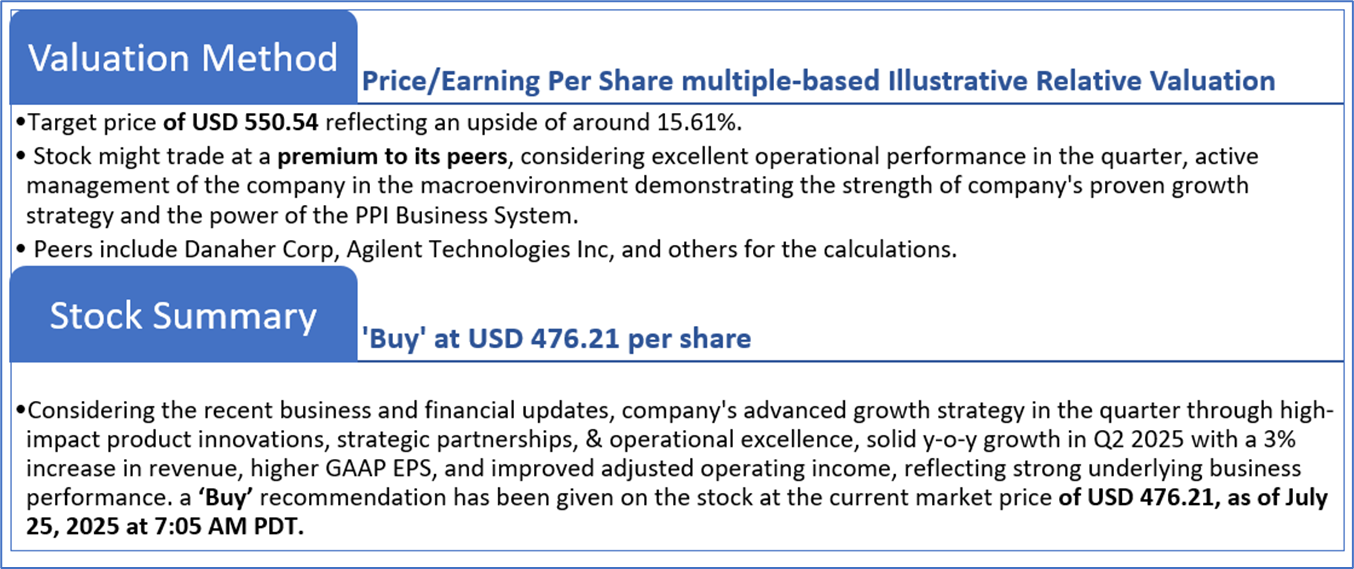
4.2 Fundamental Valuation
Valuation Methodology: Price/Earnings Per Share Multiple Based Relative Valuation
Markets are trading in a highly volatile zone currently due to certain macroeconomic issues and geopolitical tensions prevailing. Therefore, it is prudent to follow a cautious approach while investing.
Note 1: Past performance is not a reliable indicator of future performance.
Note 2: The reference date for all price data, currency, technical indicators, support, and resistance levels is July 25, 2025. The reference data in this report has been partly sourced from REFINITIV.
Note 3: Investment decisions should be made depending on an individual's appetite for upside potential, risks, holding duration, and any previous holdings. An 'Exit' from the stock can be considered if the Target Price mentioned as per the Valuation and or the technical levels provided has been achieved and is subject to the factors discussed above.
Note 4: The report publishing date is as per the Pacific Time Zone.
Technical Indicators Defined: -
Support: A level at which the stock prices tend to find support if they are falling, and a downtrend may take a pause backed by demand or buying interest. Support 1 refers to the nearby support level for the stock and if the price breaches the level, then Support 2 may act as the crucial support level for the stock.
Resistance: A level at which the stock prices tend to find resistance when they are rising, and an uptrend may take a pause due to profit booking or selling interest. Resistance 1 refers to the nearby resistance level for the stock and if the price surpasses the level, then Resistance 2 may act as the crucial resistance level for the stock.
Stop-loss: It is a level to protect against further losses in case of unfavorable movement in the stock prices.
Disclaimer This report has been issued by Kalkine New Zealand Limited (FSP691351) (NZBN:9429047678101) (“Kalkine”). Kalkine is a Financial Advice Provider (“FAP”) and is authorised by a Class 1 Financial Advice Provider Licence issued by Financial Markets Authority (“FMA”) to provide financial advice. Kalkine provides only general financial advice through its research reports following a person becoming a member. The reports contain buy/sell/hold and other recommendations in relation to equity securities, managed funds and other managed investment schemes and other financial advice products. The recommendations and opinions in this report and on Kalkine website do not take into account any of your investment objectives, financial situation or needs. Before you make a decision about whether to acquire a financial product, you should obtain the Product Disclosure Statement from the product issuer. You should consider the appropriateness of advice taking into account your own objectives, financial situation and needs and seek independent financial advice before making any financial decisions. If you act on the advice in the research reports, you may have to pay fees, expenses or other amounts (but not to Kalkine). Further information about the complaints and dispute resolution process, as well as information about Kalkine’s duties are available on Kalkine’s website. Please read our Financial Advice Provider (FAP) disclosure statement and Complaints Handling Guide, which are available on the website.
Past performance is not a reliable indicator of future performance.
 Please wait processing your request...