
Section 1: Company Overview and Fundamentals
1.1 Company Overview:
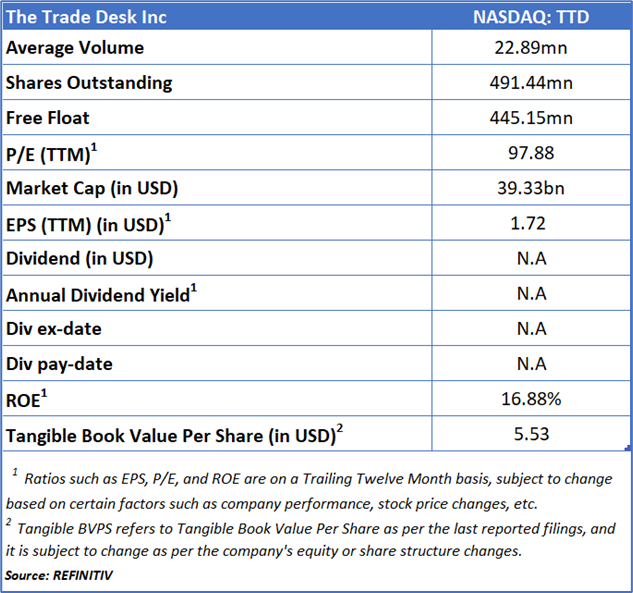
The Trade Desk Inc (NASDAQ: TTD) is a worldwide advertising technology firm that provides a cloud-based, self-service platform. This platform enables clients to design, execute, optimize, and evaluate highly data-driven digital advertising campaigns with greater precision and flexibility.
Kalkine’s American Technology Report covers the Company Overview, Key positives & negatives, Investment summary, Key investment metrics, Top 10 shareholding, Business updates and insights into company recent financial results, Key Risks & Outlook, Price performance and technical summary, Target Price, and Recommendation on the stock.
Stock Performance:
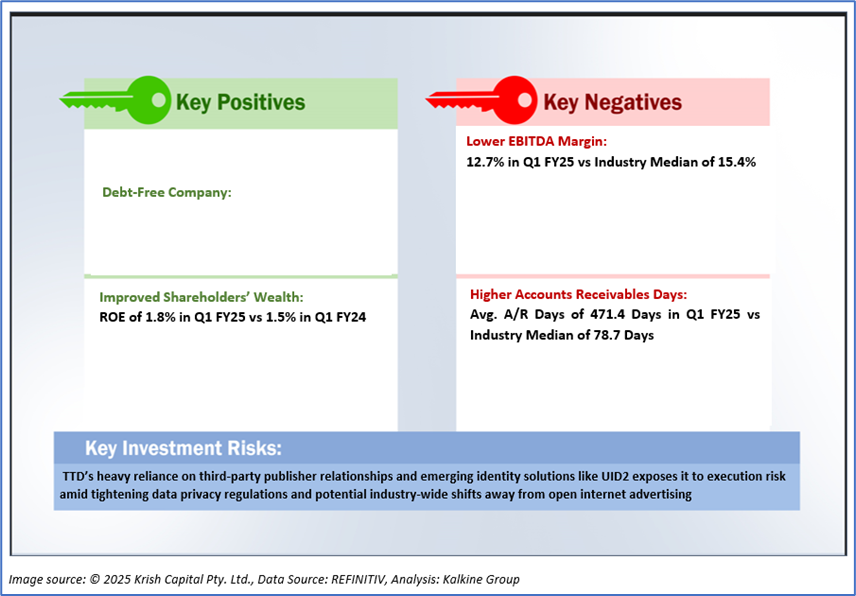
1.2 The Key Positives, Negatives, and Investment summary
1.3 Top 10 shareholders:
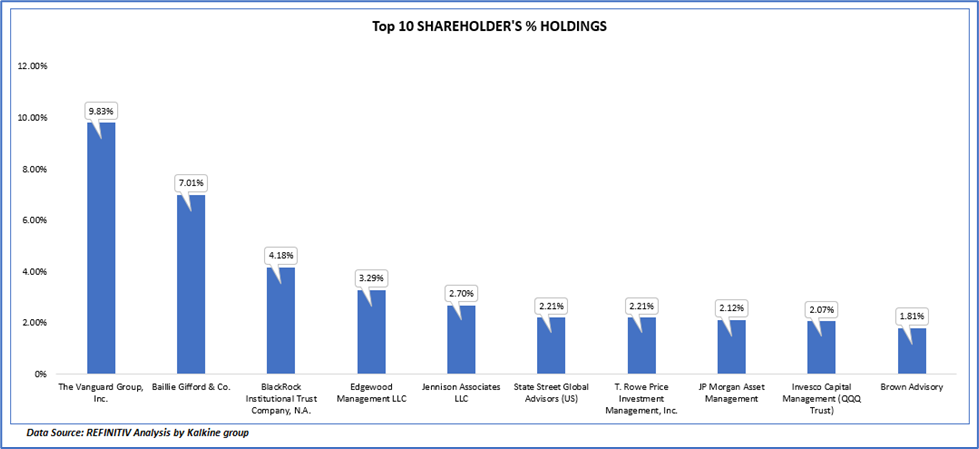
The top 10 shareholders together form ~ 37.43% of the total shareholding, signifying dispersed shareholding. The Vanguard Group, Inc. and Baillie Gifford & Co. are the biggest shareholders, holding the maximum stake in the company at 9.83% and 7.01%, respectively.
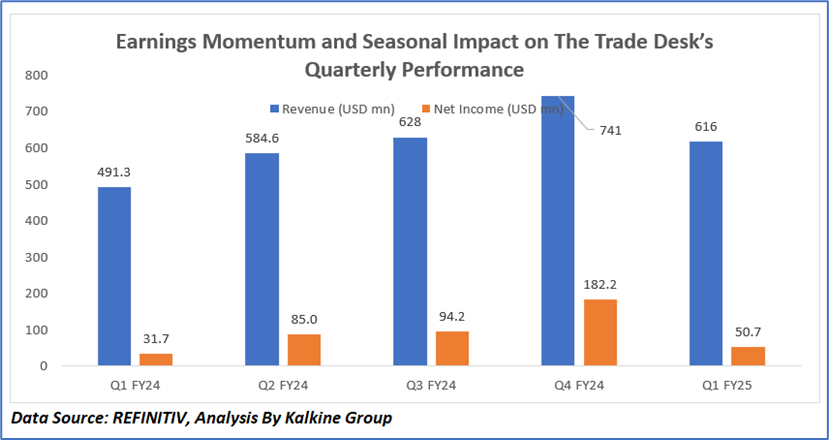
1.4 Key Metrics:
The Trade Desk’s revenue shows a consistent upward trend from USD 491.3 million in Q1 FY24 to a peak of USD 741 million in Q4 FY24, followed by a modest dip to USD 616 million in Q1 FY25. Net income follows a similar growth pattern, rising significantly from USD 31.7 million in Q1 FY24 to USD 182.2 million in Q4 FY24, before declining to USD 50.7 million in Q1 FY25. This Q1 FY25 pullback in both revenue and net income reflects seasonality, wherein Q4 typically benefits from higher ad spending during the holiday season, while Q1 usually sees softer demand. Additionally, as per the financial disclosures, increased operating expenses in platform operations, technology, and marketing (driven partly by higher stock-based compensation) compressed margins. While the company maintained strong year-over-year growth in Q1 FY25 (+25% in revenue), the quarter-over-quarter decline was expected and driven by post-holiday normalization and elevated costs tied to strategic investments and workforce compensation.
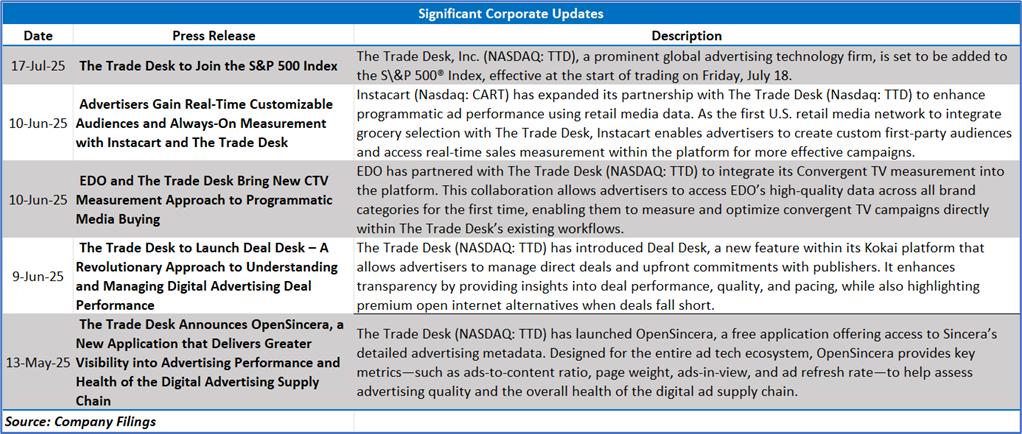
Section 2: Business Updates and Corporate Business Highlights
2.1 Recent Business Updates
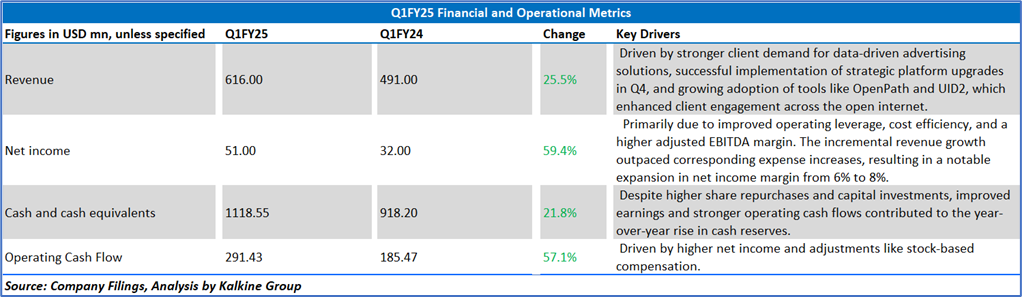
2.2 Insights of Q1FY25:
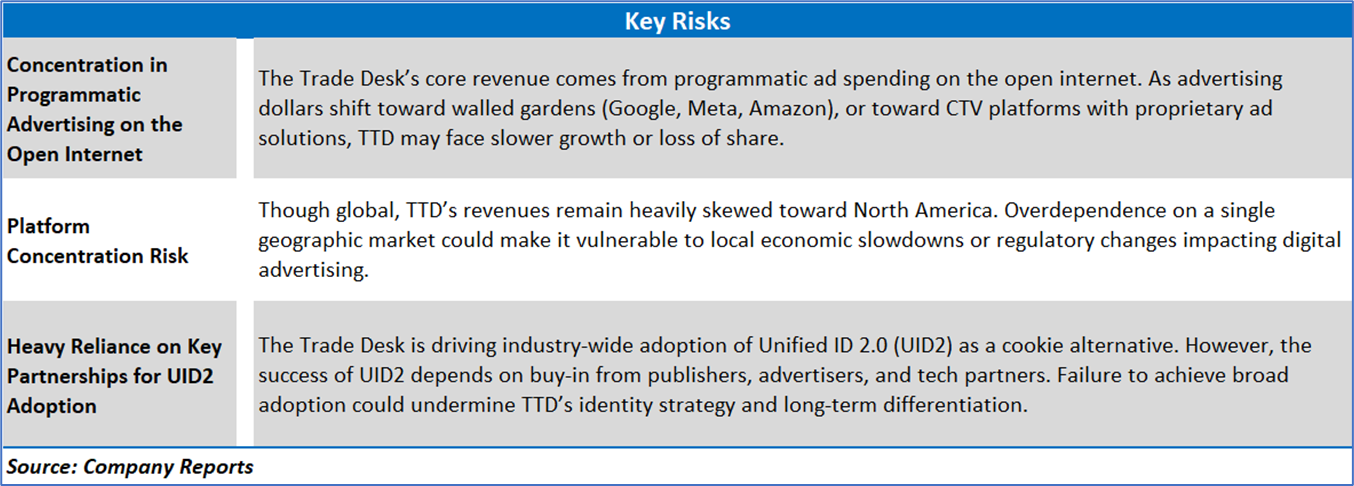
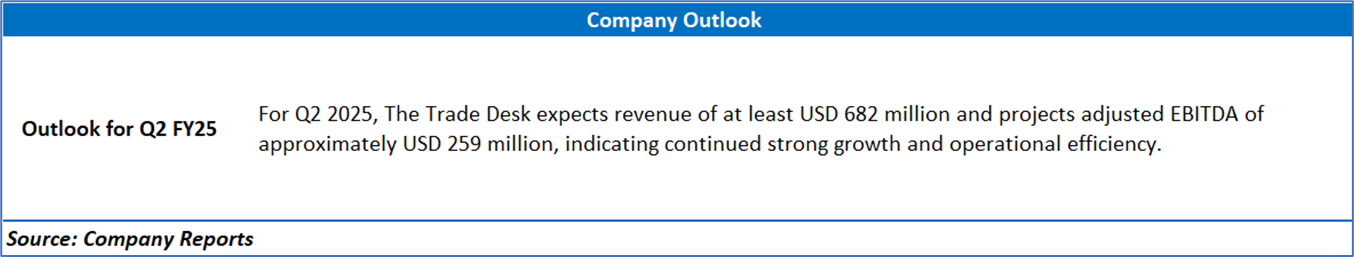
Section 3: Key Risks & Outlook
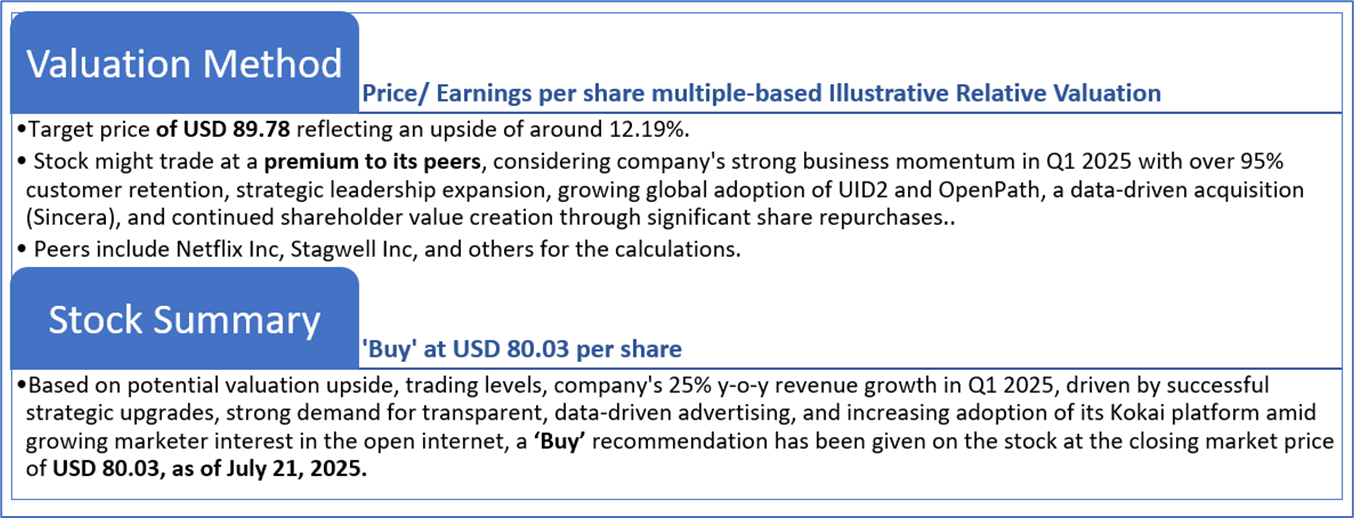
Section 4: Stock Recommendation Summary:
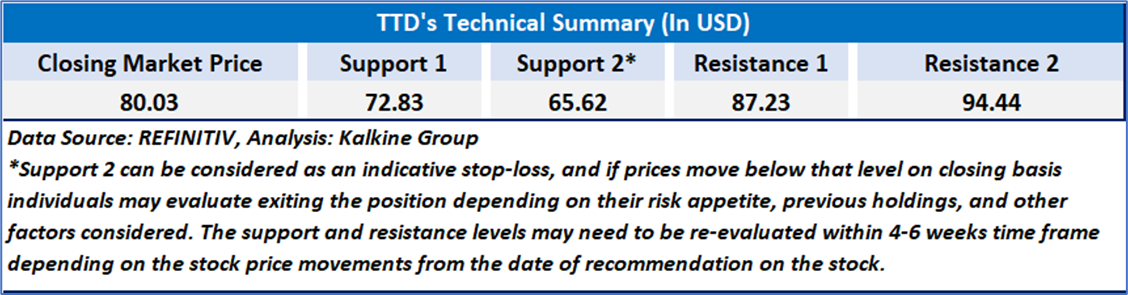
4.1 Price Performance and Technical Summary:
Stock Performance:

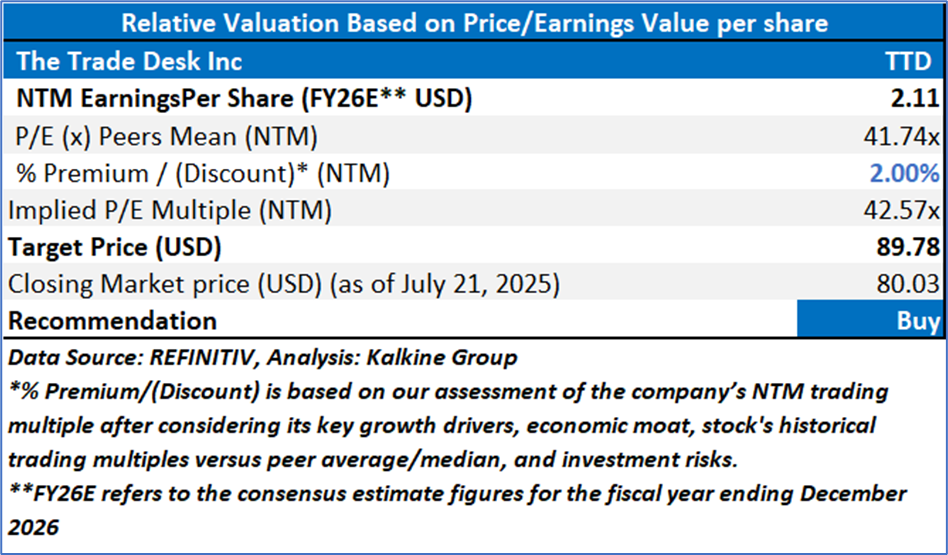
4.2 Fundamental Valuation
Valuation Methodology: Price/Earnings per share Multiple Based Relative Valuation
Markets are trading in a highly volatile zone currently due to certain macroeconomic issues and geopolitical tensions prevailing. Therefore, it is prudent to follow a cautious approach while investing.
Note 1: Past performance is not a reliable indicator of future performance.
Note 2: The reference date for all price data, currency, technical indicators, support, and resistance levels is July 21, 2025. The reference data in this report has been partly sourced from REFINITIV.
Note 3: Investment decisions should be made depending on an individual's appetite for upside potential, risks, holding duration, and any previous holdings. An 'Exit' from the stock can be considered if the Target Price mentioned as per the Valuation and or the technical levels provided has been achieved and is subject to the factors discussed above.
Note 4: The report publishing date is as per the Pacific Time Zone.
Technical Indicators Defined: -
Support: A level at which the stock prices tend to find support if they are falling, and a downtrend may take a pause backed by demand or buying interest. Support 1 refers to the nearby support level for the stock and if the price breaches the level, then Support 2 may act as the crucial support level for the stock.
Resistance: A level at which the stock prices tend to find resistance when they are rising, and an uptrend may take a pause due to profit booking or selling interest. Resistance 1 refers to the nearby resistance level for the stock and if the price surpasses the level, then Resistance 2 may act as the crucial resistance level for the stock.
Stop-loss: It is a level to protect against further losses in case of unfavorable movement in the stock prices.
Disclaimer This report has been issued by Kalkine New Zealand Limited (FSP691351) (NZBN:9429047678101) (“Kalkine”). Kalkine is a Financial Advice Provider (“FAP”) and is authorised by a Class 1 Financial Advice Provider Licence issued by Financial Markets Authority (“FMA”) to provide financial advice. Kalkine provides only general financial advice through its research reports following a person becoming a member. The reports contain buy/sell/hold and other recommendations in relation to equity securities, managed funds and other managed investment schemes and other financial advice products. The recommendations and opinions in this report and on Kalkine website do not take into account any of your investment objectives, financial situation or needs. Before you make a decision about whether to acquire a financial product, you should obtain the Product Disclosure Statement from the product issuer. You should consider the appropriateness of advice taking into account your own objectives, financial situation and needs and seek independent financial advice before making any financial decisions. If you act on the advice in the research reports, you may have to pay fees, expenses or other amounts (but not to Kalkine). Further information about the complaints and dispute resolution process, as well as information about Kalkine’s duties are available on Kalkine’s website. Please read our Financial Advice Provider (FAP) disclosure statement and Complaints Handling Guide, which are available on the website.
Past performance is not a reliable indicator of future performance.
 Please wait processing your request...