
This report is an updated version of the report published on 11 April 2025 at 09:25 AM GMT+1.
Section 1: Company Overview, Low Carbon Emission Initiatives and Fundamentals
Section 1.1: Company Overview: Rank Group PLC (LSE: RNK) is an FTSE All-Share listed international gaming company based in the United Kingdom, offering its services both in physical venues and through online platforms. It operates across several regions, including Great Britain (with the Channel Islands), Spain, and India. The company’s operations are divided into five segments: Digital, Grosvenor venues, Mecca venues, Enracha venues, and Central costs. Kalkine’s Low Carbon Research Report covers the Investment Highlights, Low Carbon Emission Initiatives, Key Financial Metrics, Risks, and Technical Analysis along with the Valuation, Target Price, and Recommendation on the stock.
Section 1.2: Why Low Carbon Emission Matters?
The shift toward a low-carbon economy is one of the most significant challenges of current time, spurred by the urgent need to combat climate change and reduce the environmental impact of corporate activities. This report covers LSE-listed low-carbon emission company Rank Group PLC (LSE: RNK), that is committed to sustainability and responsible environmental practices.
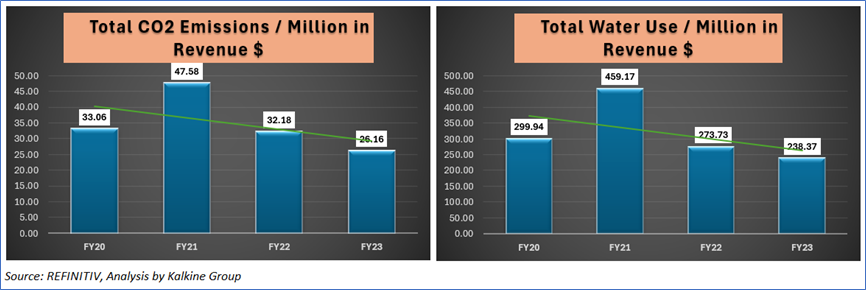
Carbon and Waste Management - Key Metrics
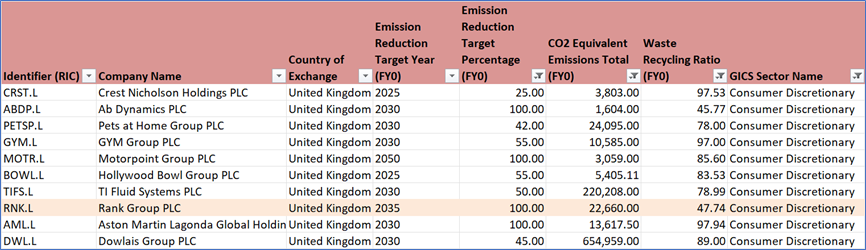
Peer Comparison: Carbon Emission Metrics
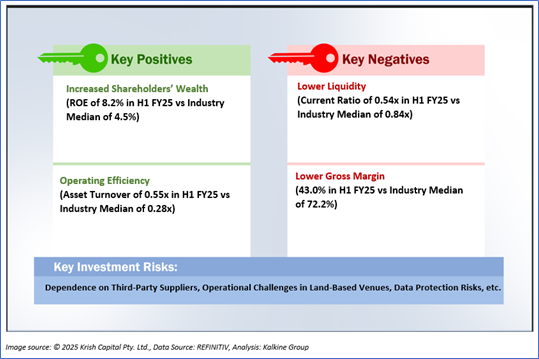
1.3 The Key Positives, Negatives, Investment Highlights, and Risks
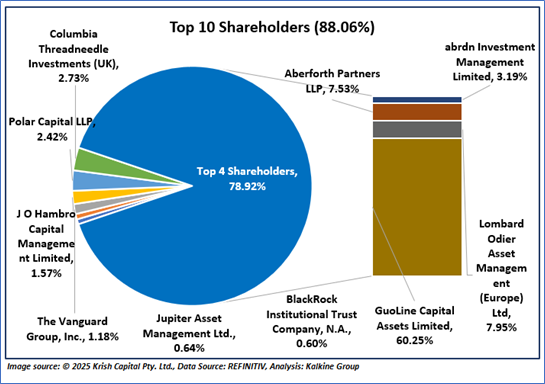
1.4 Top 10 Shareholders:
The top 10 shareholders together form ~88.06% of the total shareholding. GuoLine Capital Assets Limited and Lombard Odier Asset Management (Europe) Ltd, hold maximum stakes in the company at ~60.25% and ~7.95%, respectively.
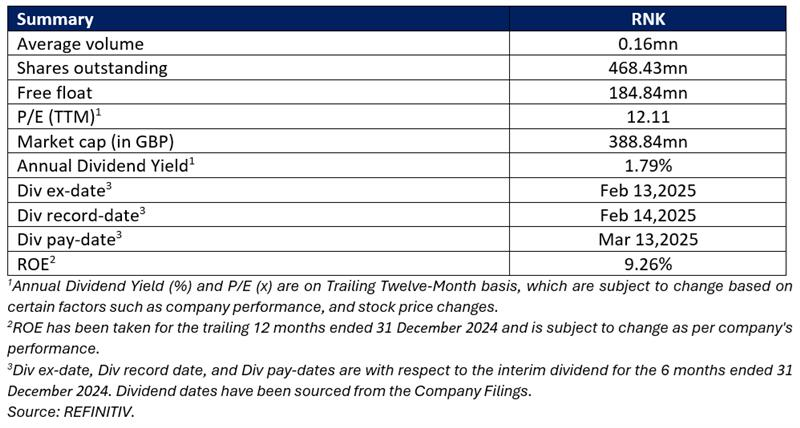
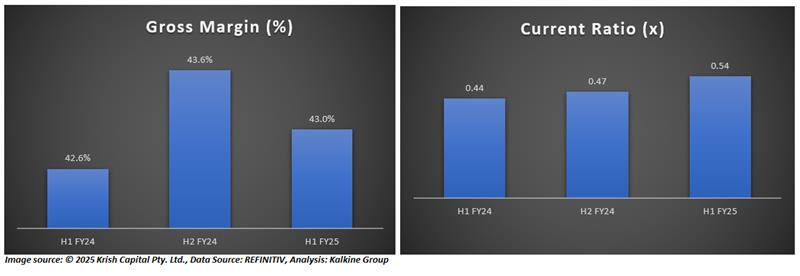
1.5 Key Metrics:
Section 2: Financial and Operational Highlights
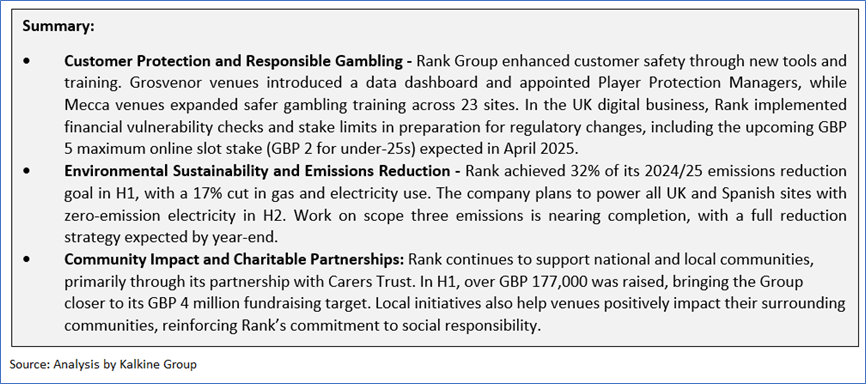
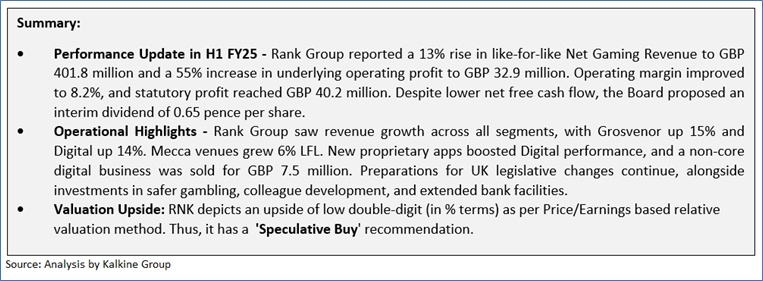
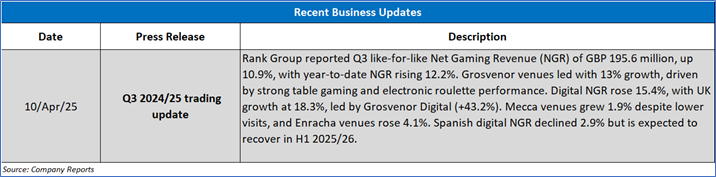
2.1 Recent Business Updates
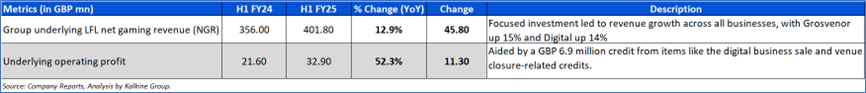
2.2 H1 FY25 Results Highlights
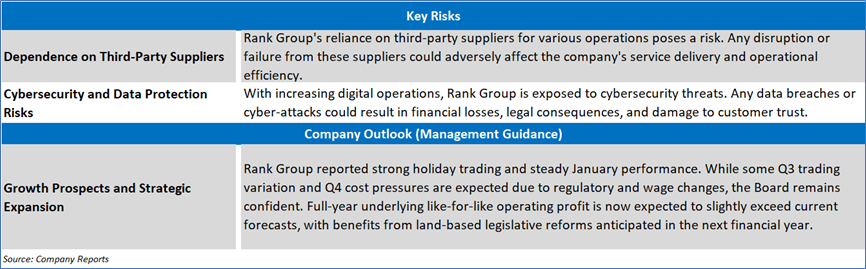
Section 3: Key Risks and Outlook:
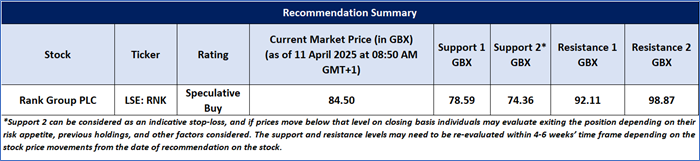
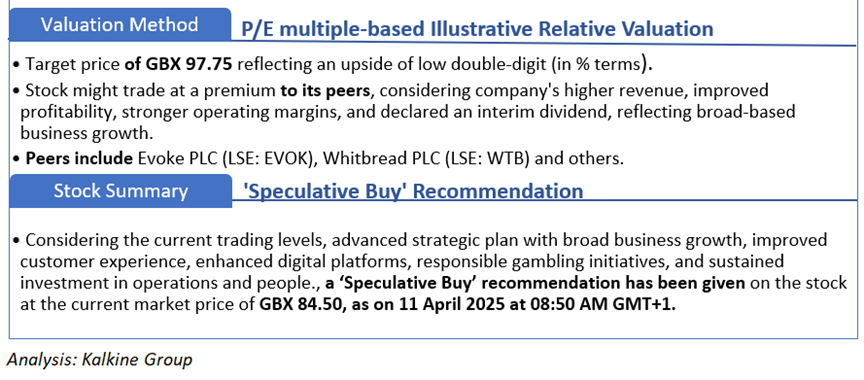
Section 4: Stock Recommendation Summary
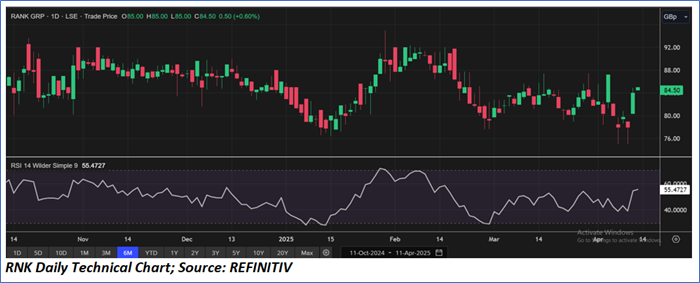
4.1 Price Performance and Technical Summary
The stock price has declined by ~0.17% in the last one month, whereas over the last six months, it has decreased by ~3.16%. The stock has a 52-week low and 52-week high of GBX 63.60 and GBX 99.80, respectively, and is currently trading above the midpoints of its 52-week low and 52-week high.
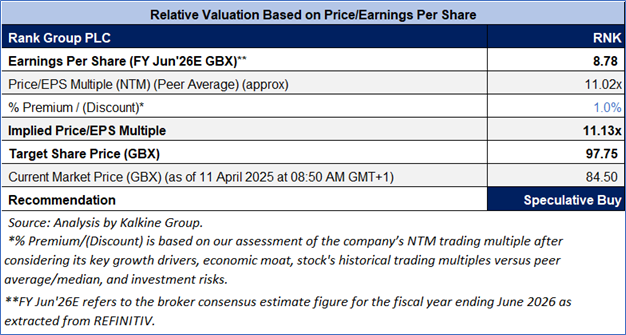
4.2 Fundamental Valuation
Valuation Methodology: P/E Multiple Based Relative Valuation (Illustrative)
Markets are trading in a highly volatile zone currently due to certain macro-economic issues and geopolitical tensions prevailing. Therefore, it is prudent to follow a cautious approach while investing.
Note 1: Past performance is not a reliable indicator of future performance.
Note 2: The reference data for all price data, currency, technical indicators, support, and resistance levels is 11 April 2025. The reference data in this report has been partly sourced from REFINITIV.
Note 3: Investment decisions should be made depending on an individual's appetite for upside potential, risks, holding duration, and any previous holdings. An 'Exit' from the stock can be considered if the Target Price mentioned as per the Valuation and or the technical levels provided has been achieved and is subject to the factors discussed above.
Note 4: Target Price refers to a price level that the stock is expected to reach as per the relative valuation method and/or technical analysis taking into consideration both short-term and long-term scenarios.
Note 5: Kalkine reports are prepared based on the stock prices captured either from the London Stock Exchange (LSE) and or REFINITIV. Typically, both sources (LSE and or REFINITIV) may reflect stock prices with a delay which could be a lag of 15-20 minutes. There can be no assurance that future results or events will be consistent with the information provided in the report. The information is subject to change without any prior notice.
Note 6: Dividend Yield may vary as per the stock price movement.
Technical Indicators Defined: -
Support: A level at which the stock prices tend to find support if they are falling, and a downtrend may take a pause backed by demand or buying interest. Support 1 refers to the nearby support level for the stock and if the price breaches the level, then Support 2 may act as the crucial support level for the stock.
Resistance: A level at which the stock prices tend to find resistance when they are rising, and an uptrend may take a pause due to profit booking or selling interest. Resistance 1 refers to the nearby resistance level for the stock and if the price surpasses the level, then Resistance 2 may act as the crucial resistance level for the stock.
Stop-loss: It is a level to protect further losses in case of unfavourable movement in the stock prices.
Disclaimer This report has been issued by Kalkine New Zealand Limited (FSP691351) (NZBN:9429047678101) (“Kalkine”). Kalkine is a Financial Advice Provider (“FAP”) and is authorised by a Class 1 Financial Advice Provider Licence issued by Financial Markets Authority (“FMA”) to provide financial advice. Kalkine provides only general financial advice through its research reports following a person becoming a member. The reports contain buy/sell/hold and other recommendations in relation to equity securities, managed funds and other managed investment schemes and other financial advice products. The recommendations and opinions in this report and on Kalkine website do not take into account any of your investment objectives, financial situation or needs. Before you make a decision about whether to acquire a financial product, you should obtain the Product Disclosure Statement from the product issuer. You should consider the appropriateness of advice taking into account your own objectives, financial situation and needs and seek independent financial advice before making any financial decisions. If you act on the advice in the research reports, you may have to pay fees, expenses or other amounts (but not to Kalkine). Further information about the complaints and dispute resolution process, as well as information about Kalkine’s duties are available on Kalkine’s website. Please read our Financial Advice Provider (FAP) disclosure statement and Complaints Handling Guide, which are available on the website.
Past performance is not a reliable indicator of future performance.
 Please wait processing your request...