
Company Overview: Telstra Corporation Limited (Telstra) is a telecommunications and technology company. Its principal activity is to provide telecommunications and information services for domestic and international customers. The Company operates through four segments. The Telstra Retail segment provides telecommunication products, services and solutions across mobiles, fixed and mobile broadband, telephony and Pay television/Internet Protocol television and digital content. The Global Enterprise and Services segment provides sales and contract management for business and government customers. The Telstra Operations segment offers overall planning, design, engineering and architecture and construction of Telstra networks, technology and information technology solution. The Telstra Wholesale segment provides a range of telecommunication products and services delivered over Telstra networks and associated support systems to other carriers, carriage service providers and Internet service providers.
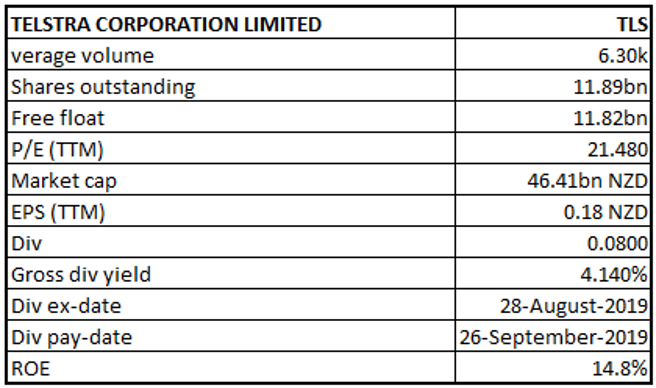
TLS Details
TLS only Telco Provider to Roll-Out 5G Services in Australia: Telstra Corporation Limited (NZX: TLS) is involved in providing telecommunications and information services for domestic and international customers. Its income related to recurring nbn Infrastructure Service Agreement (ISA) amounts and nbn commercial works are included in Telstra InfraCo. Its one-off nbn DA and ISA amounts are included in other segments, and non-nbn commercial works are included in Telstra Enterprise. Its key product contributing to revenue include, Mobile, Fixed, Data & IP, Network Applications and Services (NAS), Global connectivity, Media and others such as recurring revenue related to nbn co access to the infrastructure (nbn DA), and revenue from other products such as late payment fees and revenue from Telstra Health and Telstra Software.
FY19 was a pivotal year for the company with challenging structural dynamics of the industry and the intense competitive environment. The company expects to see a turning point in its fortunes given the scenario going forward. It has completed its strategic investment program to digitize its business and create the networks for the future, which contributed amount of over $500 million in EBITDA. It crossed the halfway mark of customers shifting onto the nbn network plus launched 5G, the next generation of telco technology which is also a platform for future growth for both the company and its customers. It also implemented its T22 strategy at the beginning of the year, and till now has made significant progress. Another positive achievement during the year was radical reduction of the number of Consumer & Small Business (C&SB) fixed and mobile plans from over 1800 plans to just 20, which is good for the customers and is making life easier for the people. Along with this, the company introduced no lock-in plans across fixed and mobile and became first major telco company in Australia to do this. It also eliminated customer pain points such as excess data charges in Australia which has provided freedom and peace of mind to more than 820,000 customers. The company is the only telco provider in Australia to roll out 5G services and has reached 10 cities across the country. It expects to increase its 5G coverage in area almost five-fold by covering at least 35 Australian cities. It was able to reduce its cost for the period and since FY16, has achieved $1.17 billion in reductions of the underlying costs. It estimates a net cost reduction of $2.5 billion by FY22, which can be attributed to cost optimization via digitization leading to reductions in direct and indirect labour costs as well as non-labour related costs.
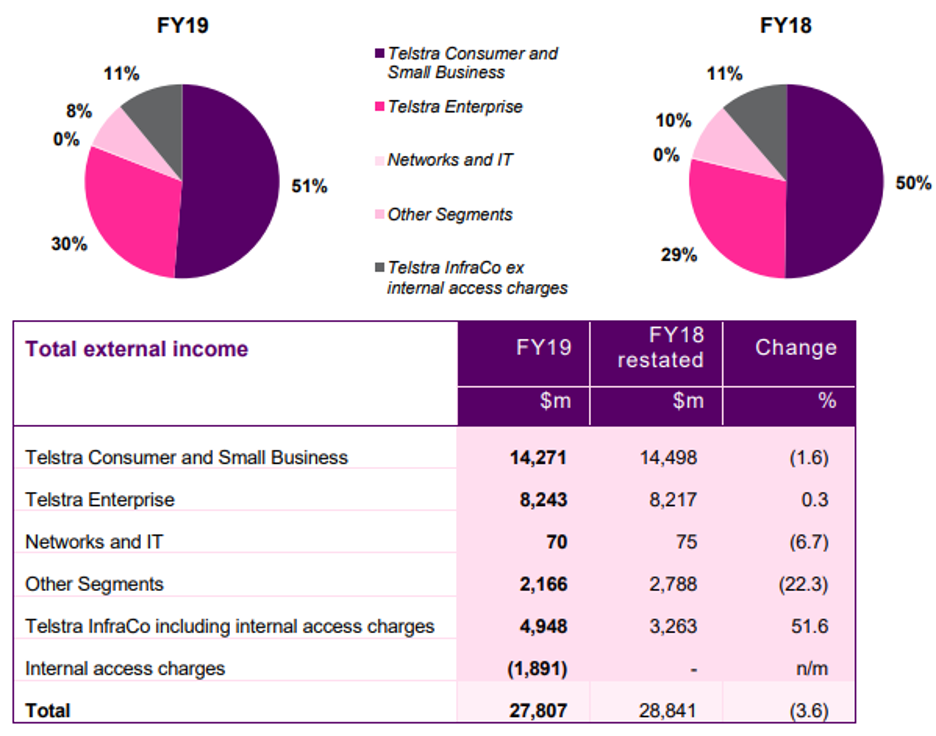
Segment Income Data (Source: Company Reports)
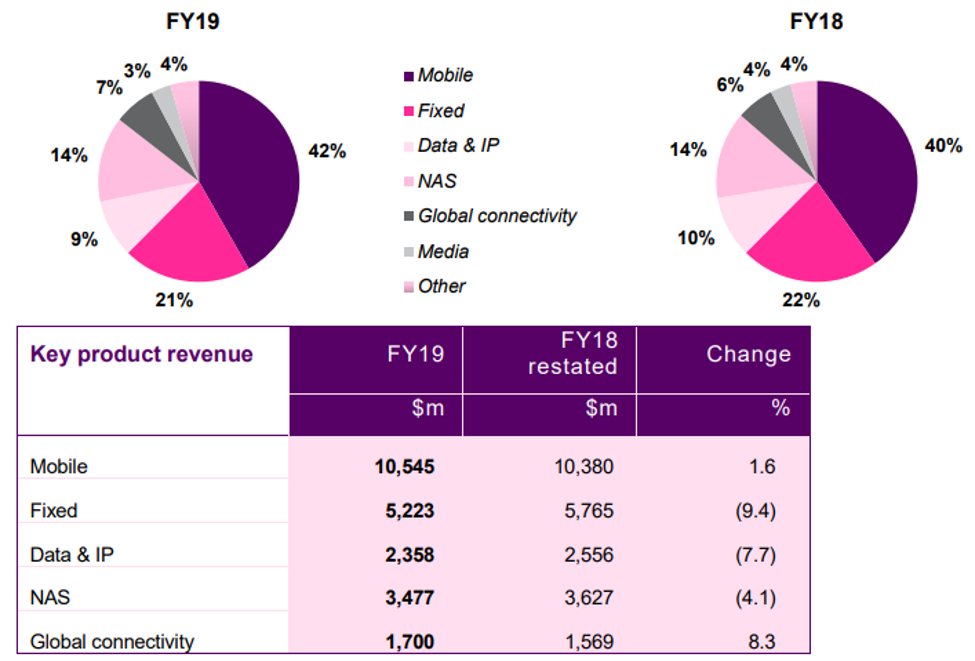
Product Revenue Breakdown (Source: Company Reports)
FY19 Key Highlights for the period ended June 30, 2019: On a reported basis, total income was reported at $27.8 billion, a decrease of 3.6% on previous year. EBITDA for the period was reported at $8.0 billion, a decrease of 21.7% on previous year. NPAT for the period was reported at $2.1 billion, a decrease of 39.6% on previous year.
On a guidance basis, total income for the period was reported at $27.8 billion, a decrease of 2.6%. EBITDA (excluding restructuring costs) for the period was reported at $9.4 billion, a decrease of 11.4%.
Underlying EBITDA for the period was reported at $7.8 billion, a decrease of 11.2% on previous year, whereas excluding the in-year nbn headwind, underlying EBITDA declined by ~4%. The major decline in EBITDA can be attributed to the impact of the nbn where the company absorbed around $600 million of negative recurring EBITDA headwind in the period. As per estimates, the nbn has adversely impacted EBITDA by around $1.7 billion since FY16.
The company made a strong progress on T22 strategy where the number of Consumer & Small Business plans in market reduced from 1800 to 20. It introduced no lock-in plans around fixed and mobile plus eliminated excess data charges in Australia.
As per customer numbers and services number growth, during the period more than 378,000 net retail postpaid handheld mobile services were added, taking retail mobile postpaid handheld services to 8.2 million. Moreover, over 230,000 wholesale MVNO mobile postpaid and prepaid services were added during the period, taking total wholesale services for the company to over 1.2 million. In addition to this, the company added 107,000 net new fixed-line retail bundle and data services (inclusive of 51,000 from Belong), taking total retail bundle and data services to over 3.7 million. With an estimated nbn market share (excluding satellite) of 49%, the company added 659,000 new nbn connections. The revenue from Internet of Things (IoT) business grew at 19.4%, performing better than the industry growth rates. Its IoT network on an average connected 2,000 things every day including machines, smart meters, vehicles, infrastructure and a wide array of other sensors.
The Board of Directors declared a total fully franked final dividend of 8 cents per share (cps), which comprised a final ordinary dividend of 5 cps and a final special dividend of 3 cps. The total dividend stood at 16 cps for FY19 amounting to more than $1.9 billion.
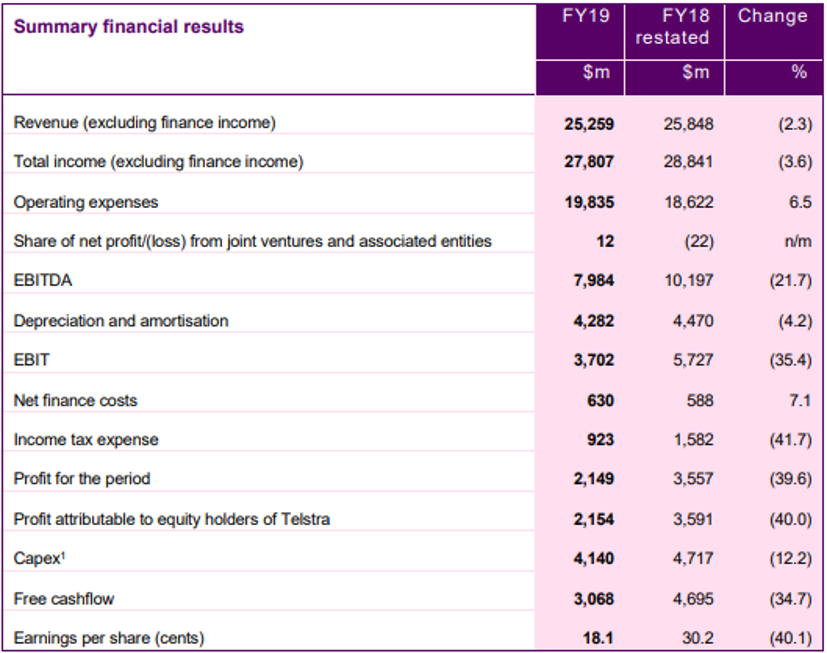
FY19 Income Statement (Source: Company Reports)
FY19 Net Cash from Operating Activities Reported at $6,683 million: Free cashflow generated from operating and investing activities for the period was reported at $3,068 million, a decline of 34.7% on previous year, mainly due to lower EBITDA including increased restructuring costs and working capital, partly offset by lower cash capital expenditure and tax paid.
Net cash from operating activities for the period was reported at $6,683 million, a decline of 22.3%, mainly due to a decrease in one-off nbn receipts in line with the progress of the nbnTM network rollout and an increase in payments to employees and suppliers. Decrease in net cash used in investing activities primarily highlights lower capital expenditure for the period and decrease in net cash used in financing activities reflects payment of lower dividend and higher funding from borrowings.
Its debt position at the end of the period was reported at $15,331 million, comprising borrowings of $17,253 million along with net derivative assets of $1,922 million. Its gross declined by $37 million, mainly due to debt reduction from financing cash outflow at $47 million, bank overdraft reduction of $9 million, offset by a $19 million increase in finance leases and other non-cash revaluation impacts on its borrowings and derivatives.
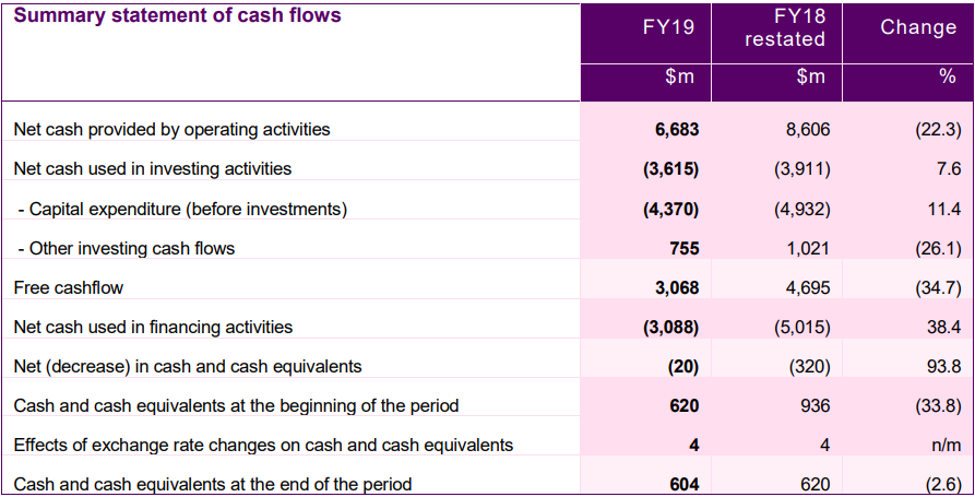
FY19 Cash Flow Statement (Source: Company Reports)
Top 10 Shareholders: The top 10 shareholders have been highlighted in the table, which together form around 6.99% of the total shareholding. Vanguard Investments Australia Ltd. and The Vanguard Group, Inc. hold maximum interests in the company at 2.62% and 1.00%, respectively.
Recently, the company confirmed vesting of 5,115,570 ‘retention rights’ to eligible employees on December 31, 2019, in accordance with their terms of issue. With this 7,673,385 of ‘retention rights’ remains outstanding out of 13,245,705 ‘retention rights’, a one-off issue made by the company in FY19.
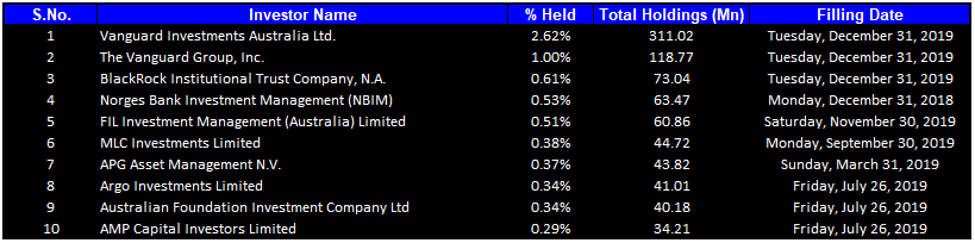
Top 10 Shareholders (Source: Thomson Reuters)
A Quick Look at Key Metrics: Its gross margin and net margin for FY19 stood at 63.8% and 8.5%, better than the industry median of 61.0% and 6.3%, respectively, implying decent fundamentals for the company. Its current ratio for FY19 stood at 0.76x, in-line to the industry median of 0.78x, which implies that the company is at par with its peer group in addressing its short-term obligations.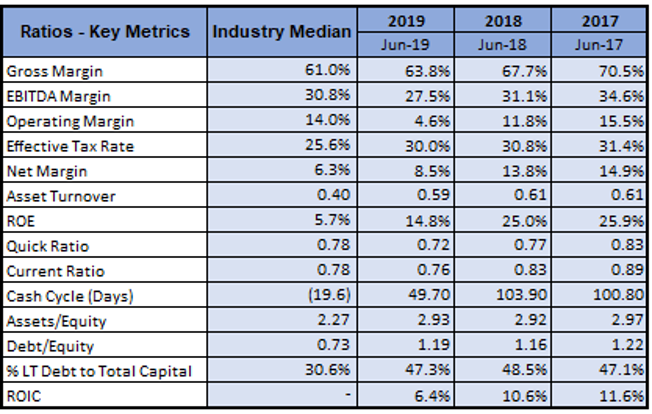
Key Metrics (Source: Thomson Reuters)
Key Risks: The company operates in a business which is constantly evolving and facing rapid change. Some of the important challenges include transformation and competition, privacy and cyber security, major regulatory changes, etc.
What to expect: As per the release, FY20 guidance for total Income is estimated in the range of $25.7 to $27.7 billion. EBITDA guidance is in the range of $7.3 to $7.8 billion. Restructuring costs for the period is around $300 million, with capital expenditure in the range of $2.9 to $3.3 billion. Free cash flow after operating lease payments for the period has been estimated at $3.4 to $3.9 billion. Moreover, the company expects net one-off nbn DA receipts (less nbn net cost to connect (C2C)) to be in the range of $1.6 billion to $2.0 billion. It also expects that FY20 will prove out to be biggest in-year nbn headwind to date, resulting in $800 million to $1 billion from the recurring impact of the nbn. Underlying EBITDA for FY20 after exclusion of recurring in-year headwind of the nbn, has been estimated to grow by up to $500 million.
The company expects that despite the challenges in FY19, underlying trends were expected to improve over the course of FY20. It is confident on its strategy to help it enhance its earnings and further create opportunities for growth.
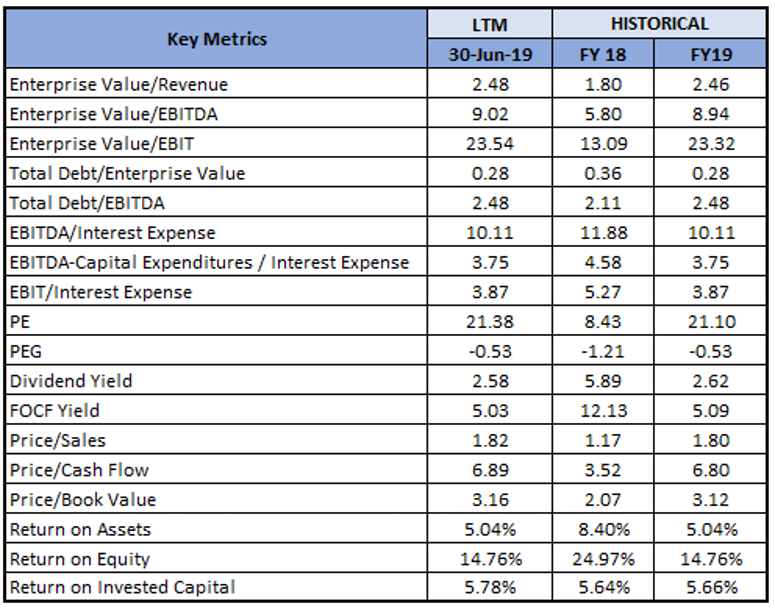
Key Valuation Metrics (Source: Thomson Reuters)
Valuation Methodology: Price to Earnings (PE) Multiple Approach
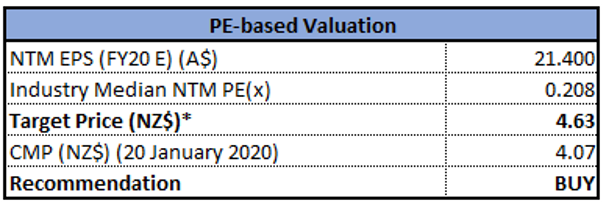
P/E Multiple Approach (Source: Thomson Reuters), NTM-Next Twelve Months, *1 AUD = 1.04 NZD
Note: All forecasted figures and peers have been taken from Thomson Reuters, NTM-Next Twelve Months
Technical Analysis:
Monthly Chart-
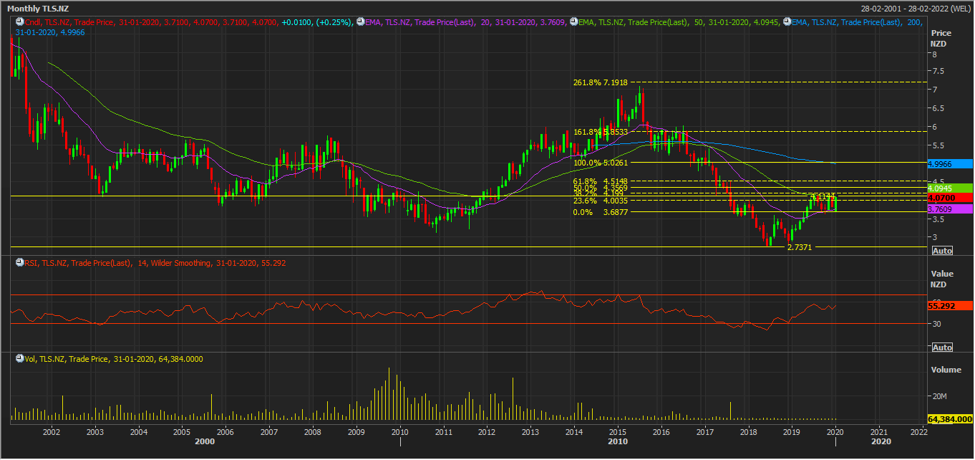
(Source: Thomson Reuters)
Weekly Chart-
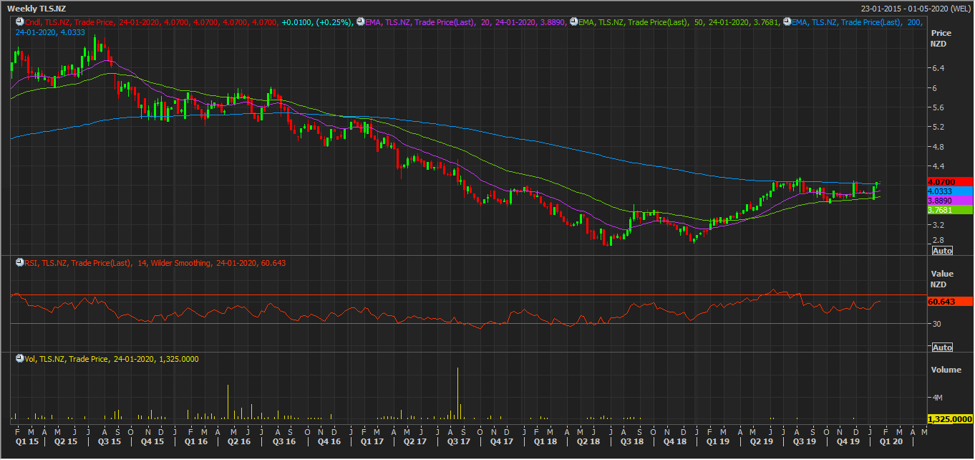
(Source: Thomson Reuters)
Daily Chart-
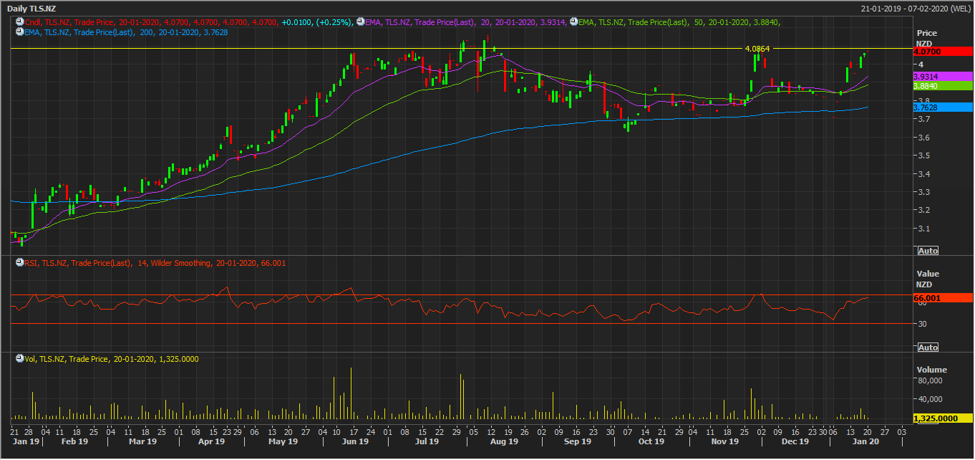
(Source: Thomson Reuters)
On monthly timeframe chart, the stock crosses 20 EMA from below, suggesting trend reversal, which gets support from price crossing 200 EMA plus 20 EMA is trending above 50 EMA and below stock price. On daily timeframe chart, stock is trading above 20 EMA, 50 EMA and 200 EMA, indicating bullish trend. One common point supported by all the three charts is that the stock may face test at resistance level of ~$4.0864, break-up on which a fresh upside rally is expected with target of around $4.63. Bullish trend continuation gets support from formation of double bottom in the monthly chart and engulfing candle stick pattern in the weekly chart, however, the investors are suggested to build a position with stop loss at around 20 EMA in weekly chart.
Note: EMA – Exponential Moving Average
Strong Recommendation: Stock posted one-year return of 33.46%, while in the span of six months, it generated a return of 4.32%. Considering the company’s business model, FY19 results, FY20 guidance and current trading levels, we have valued the stock using a relative valuation method, i.e., price to earnings (PE) multiple, and arrived at a target price of lower double-digit growth (in % term). Hence, we give a “Buy” recommendation on the stock at the current market price of NZ$4.070 per share, up 0.25% on January 20, 2020.
.png)
TLS Daily Technical Chart (Source: Thomson Reuters)
Disclaimer
Kalkine New Zealand Limited is authorised to provide class advice only. The information on this site does not take into account any of your investment objectives, financial situation or needs. Before you make a decision about whether to acquire a financial product, you should obtain the Product Disclosure Statement from the product issuer. You should consider the appropriateness of advice taking into account your own objectives, financial situation and needs and seek independent financial advice before making any financial decisions.
Past performance is not a reliable indicator of future performance.
 Please wait processing your request...