
Kalkine's Global Tariff Report offers independent, data-driven analysis of key global sectors impacted by tariff adjustments. It evaluates the potential implications these changes may have for equity valuations within those industries. The report prioritizes trade-sensitive sectors, which typically face increased investor scrutiny during periods of tariff uncertainty, while also identifying defensive and countercyclical segments that demonstrate resilience or potential for outperformance amidst global trade disruptions.
As illustrated in the table below, several key sectors in different countries are directly impacted by the recent tariff announcement from President Trump.
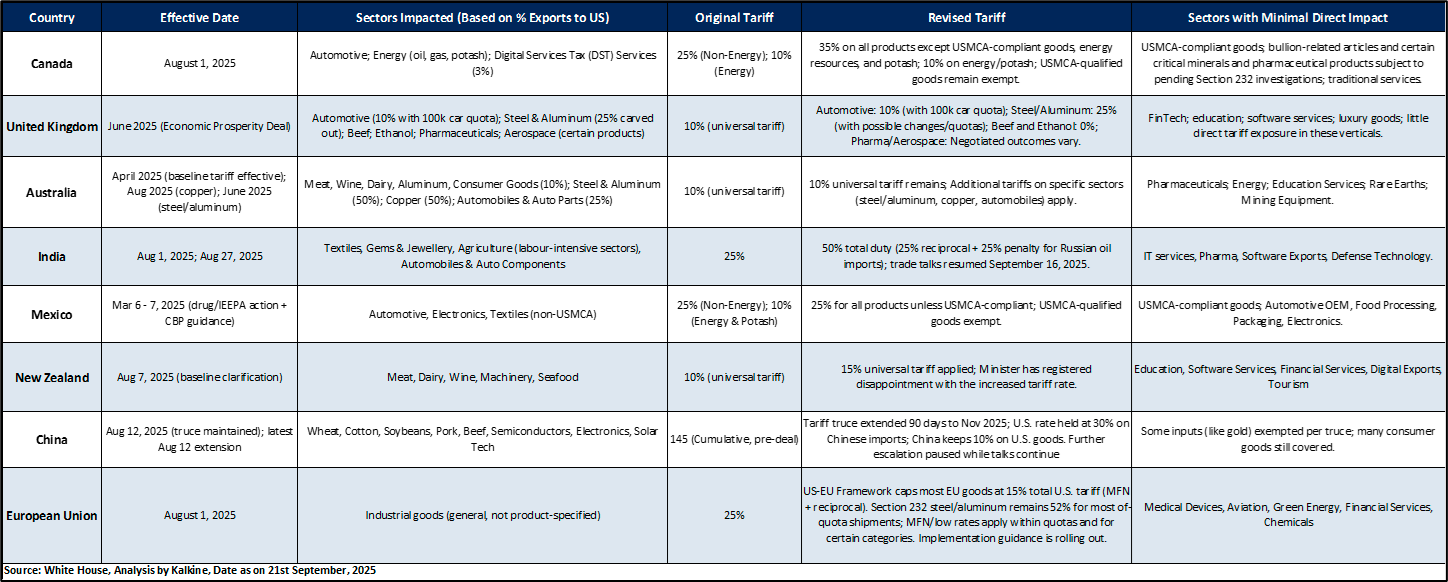

Key Developments (as of September 21, 2025)
Canada
India
China
European Union

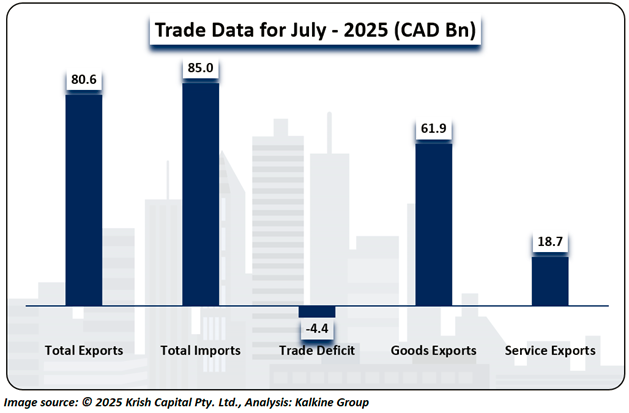
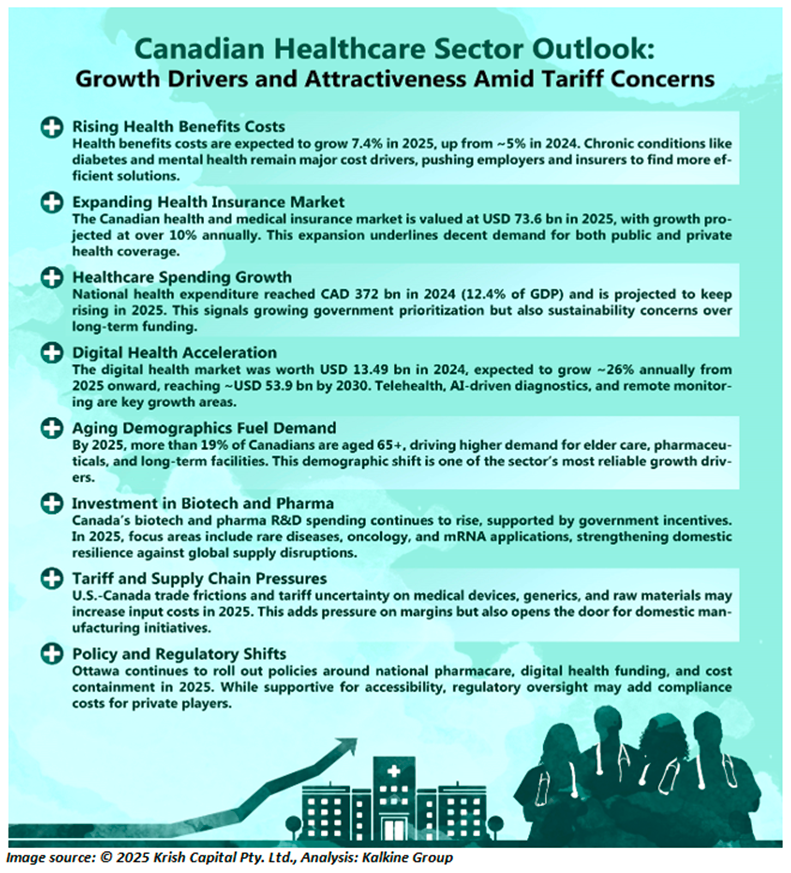
In July 2025, Canada’s merchandise exports rose 0.9% to CAD ~61.9 billion, while imports declined 0.7% to CAD ~66.8 billion. This narrowed the merchandise trade deficit from CAD ~6.0 billion in June to CAD ~4.9 billion.
Overall, rising exports of energy and vehicles, combined with lower imports, helped reduce Canada’s total trade deficit to CAD ~4.4 billion. Weak metals exports and uneven non-U.S. trade kept the recovery in merchandise trade uneven across sectors.


Amid elevated Market Volatility and Tariff pressures, Bausch Health Companies Inc. (TSX: BHC) stands out as our defensive pick within the Healthcare sector, supported by rigorous fundamental and technical research.
Section1: Company Overview and Fundamental Insights:

Bausch Health Companies Inc. (TSX: BHC) is a global company that develops manufactures and markets a range of pharmaceutical medical device and over-the-counter products primarily in the therapeutic areas of eye health gastroenterology and dermatology.
Kalkine’s Global Tariff Report covers the Investment Highlights, Key Financial Metrics, Risks, Technical Analysis along with the Valuation, Target Price, and Recommendation on the stock.
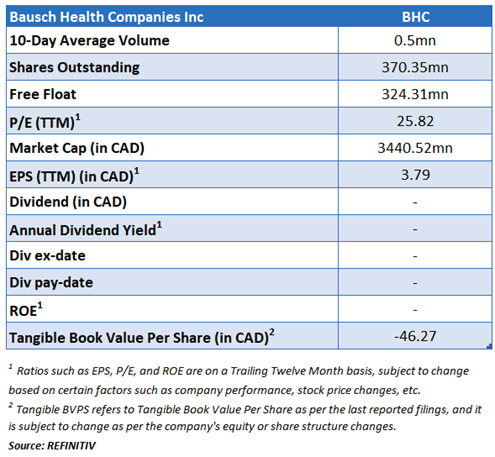


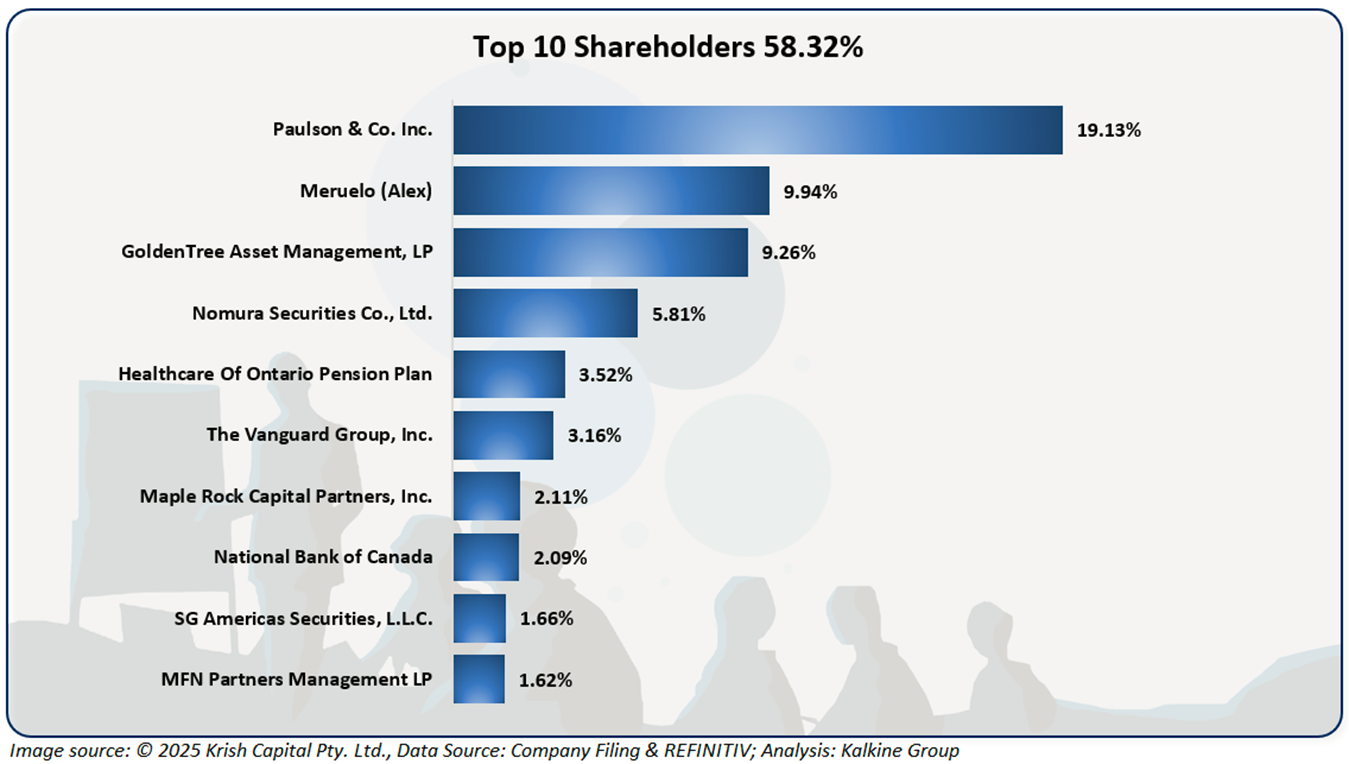
The top 10 shareholders together form ~58.32% of the total shareholding. Paulson & Co. Inc. and Meruelo (Alex) hold a maximum stake in the company at ~19.13% and ~9.94%, respectively.

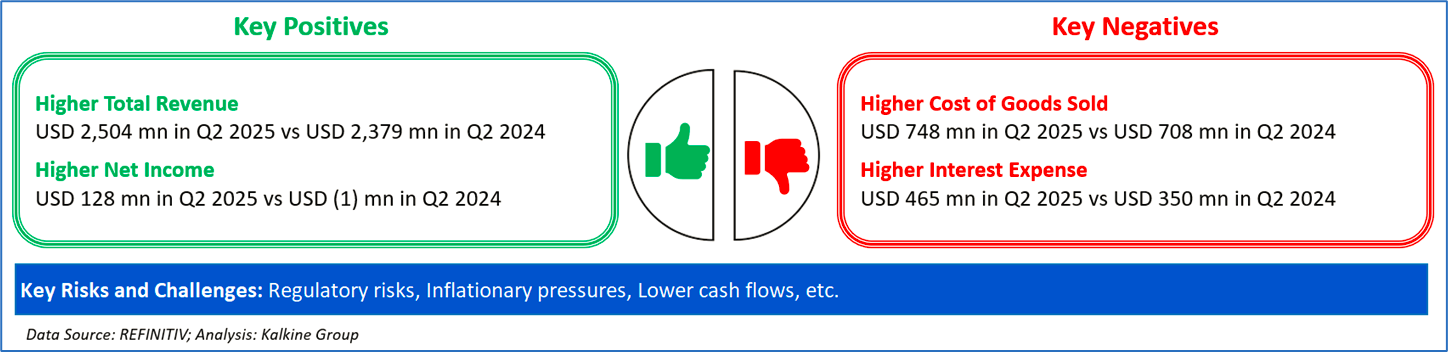
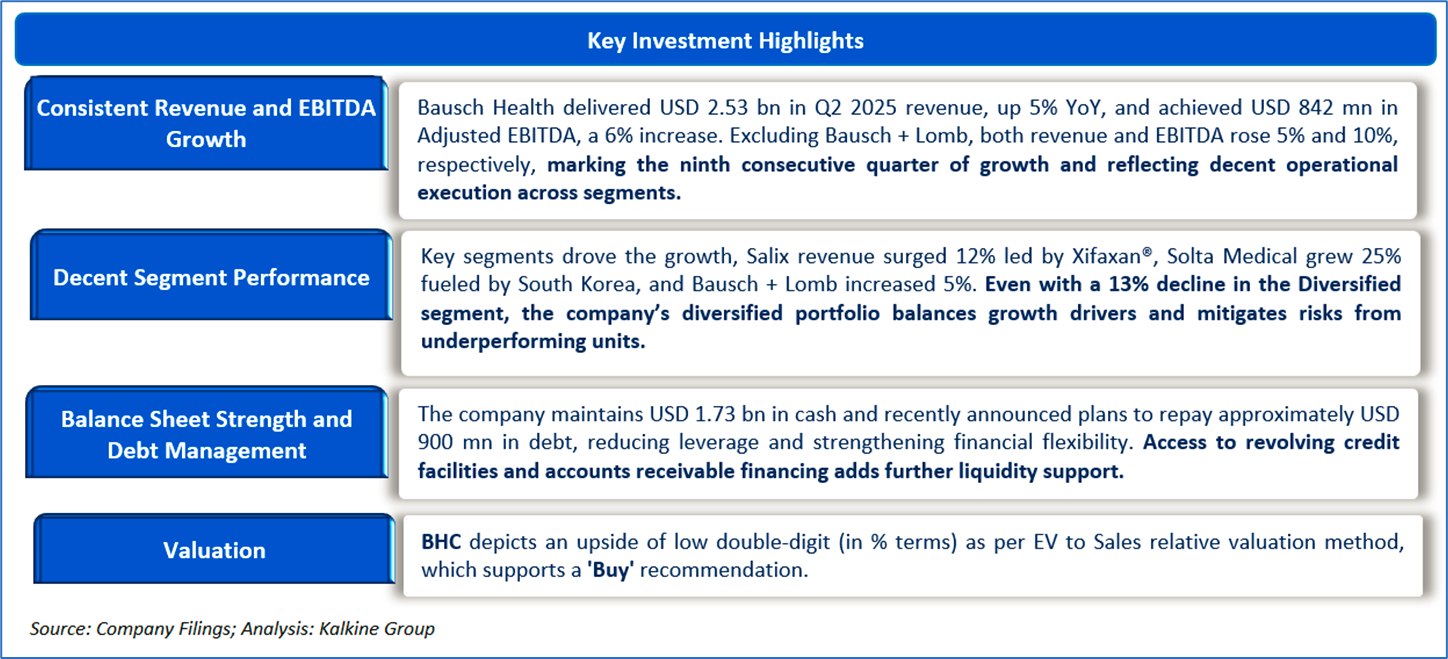
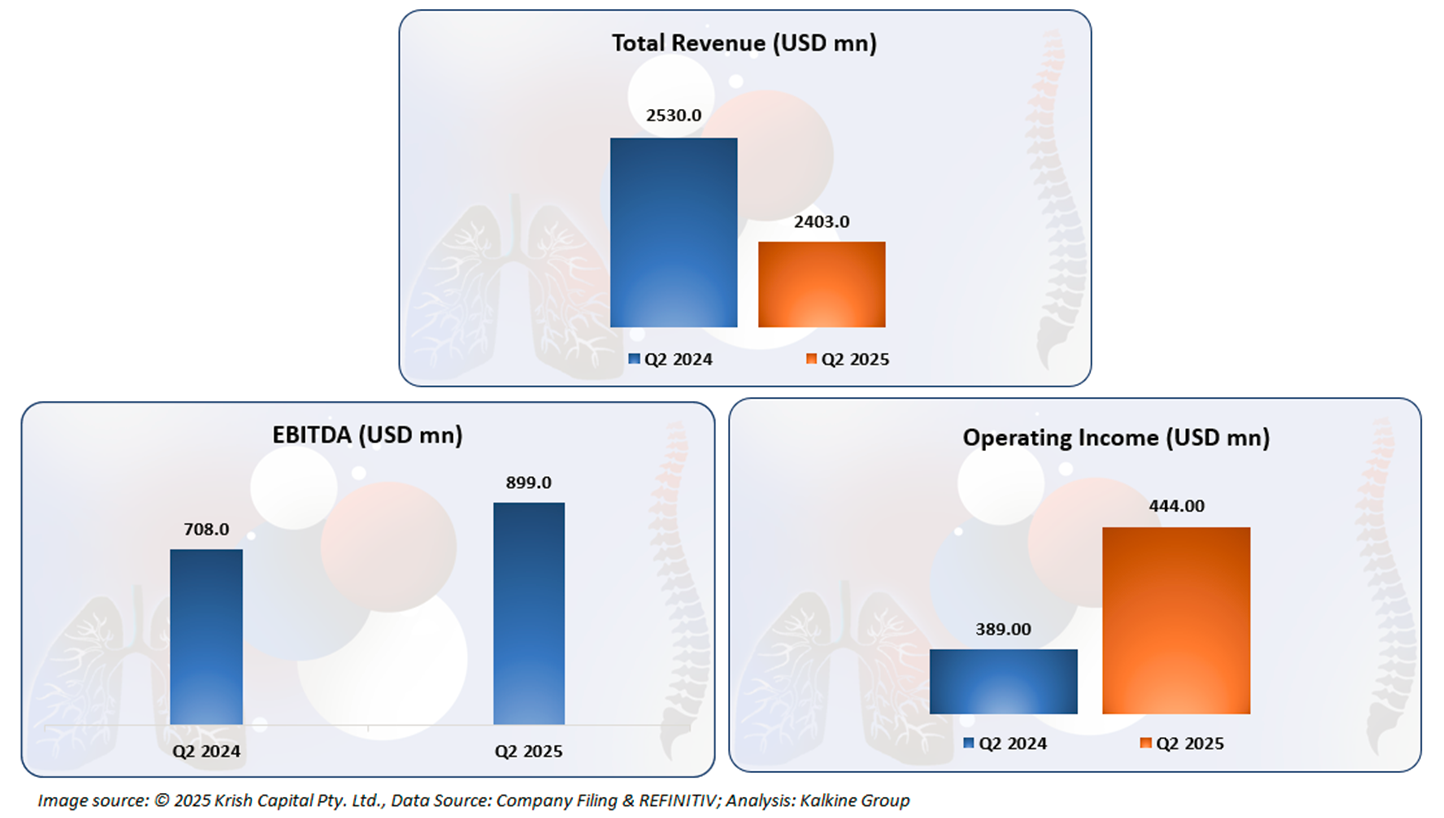
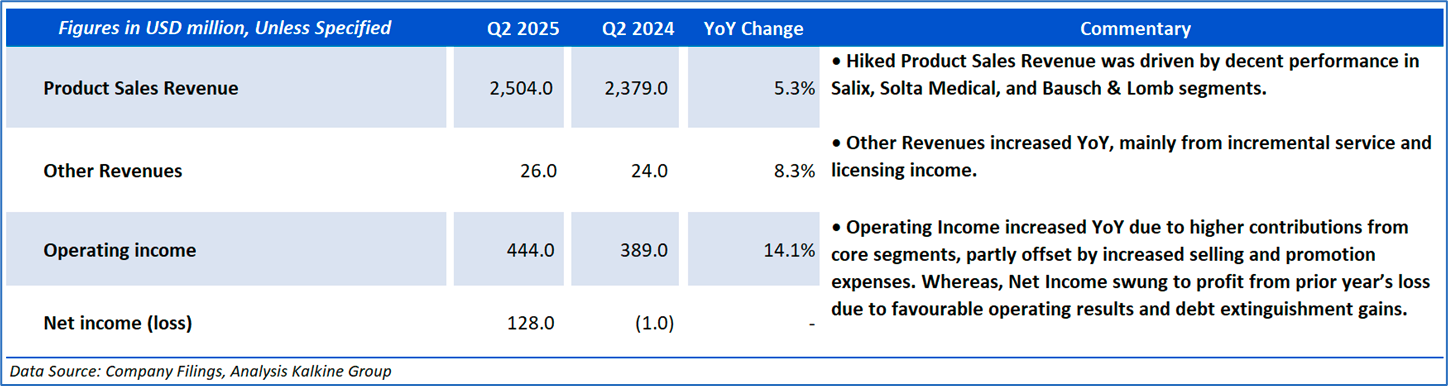
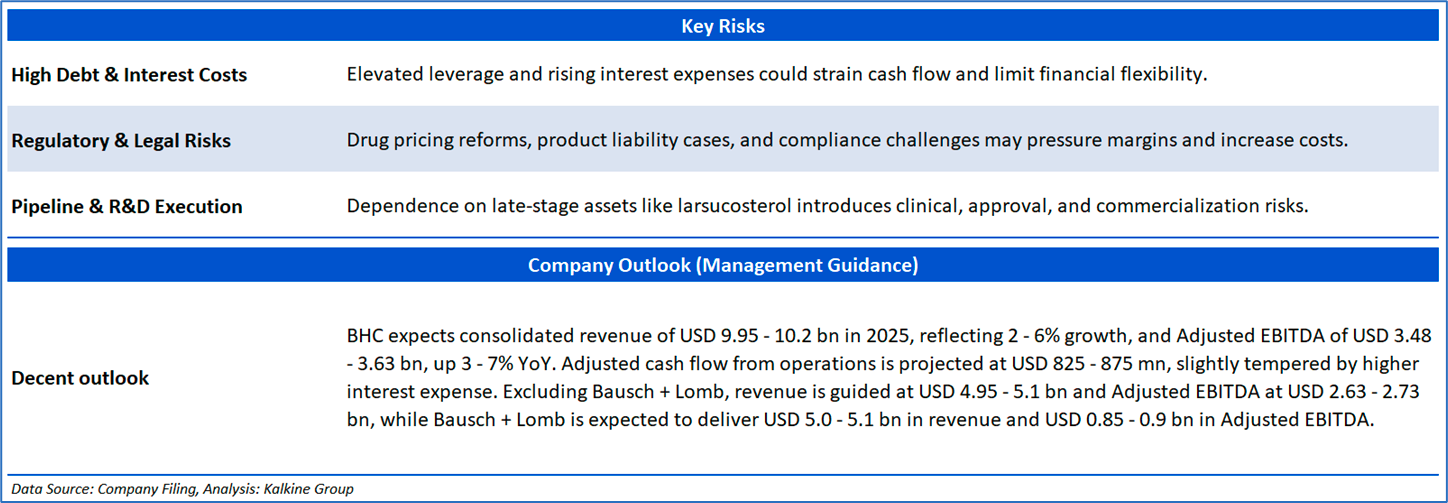
The company reported rising financials in Q2 2025, where it clocked healthy growth under its Total Revenue, which is a key positive. Furthermore, it witnessed elevated EBITDA and Operating Income, displaying its decent operating efficiency and improved profitability momentum.
Section 2: Business Updates and Financial Highlights

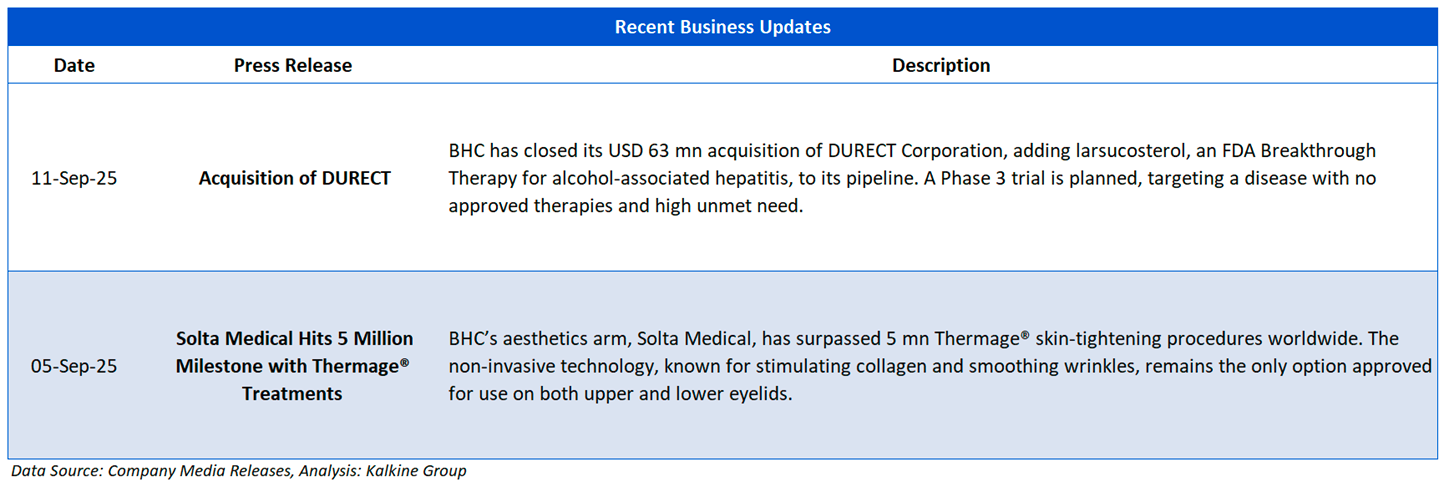
The picture below gives an overview of the company’s recent activities, such as an announcement regarding Acquisition of DURECT and Solta Medical Hits 5 Million Milestone with Thermage Treatments.

Section 3: Key Risks and Company Outlook
Section 4: Stock Recommendation Summary


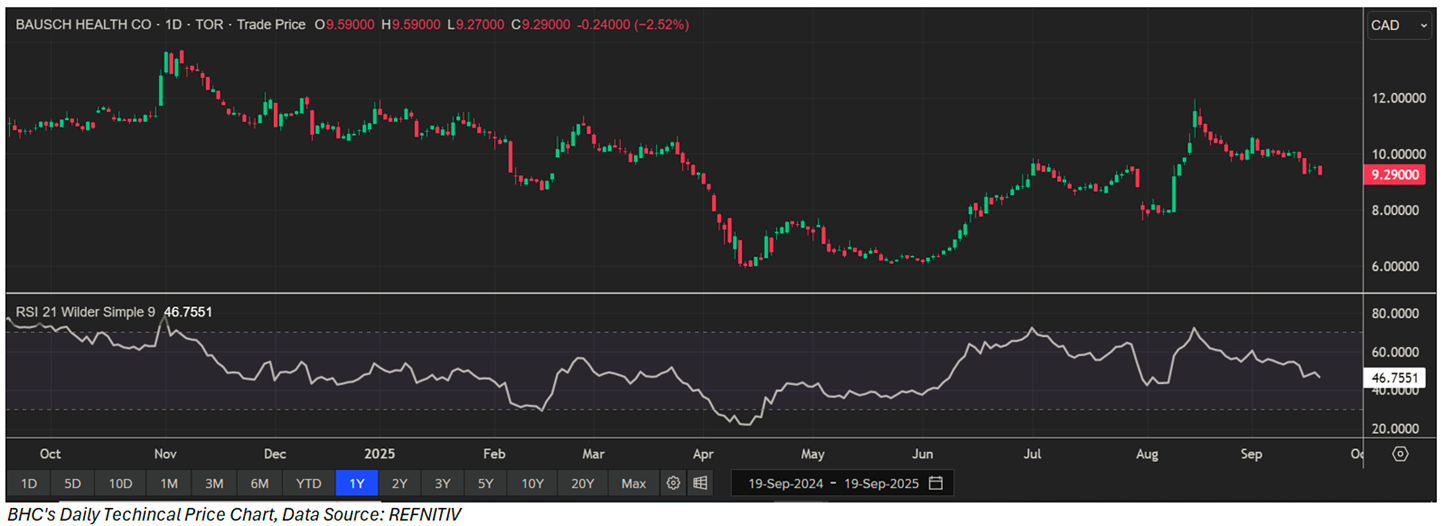
The stock has witnessed a downside of ~7.65% and an upside of ~9.68% over the last 1 week and 3 months respectively. Moreover, it is trading below the average 52-week high price of CAD 13.74 and 52-week low price of CAD 5.91, providing an opportunity to accumulate the stock.

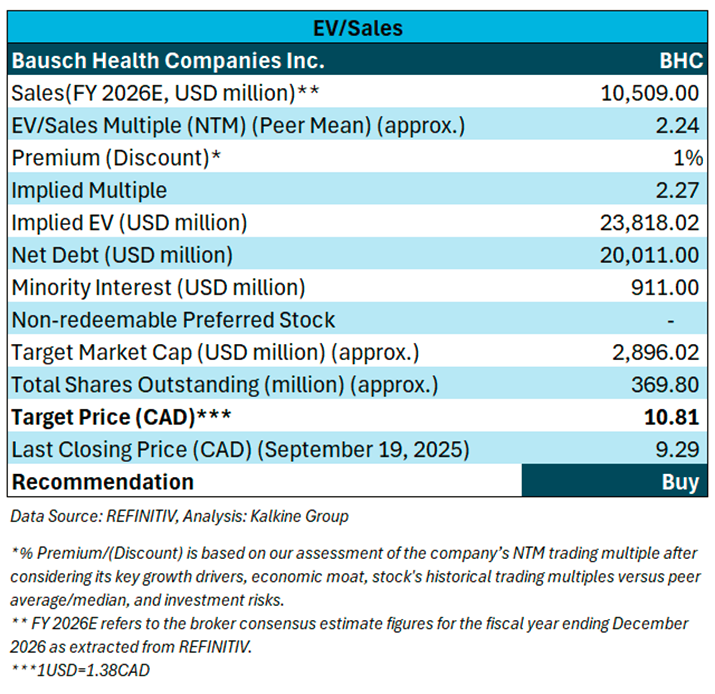
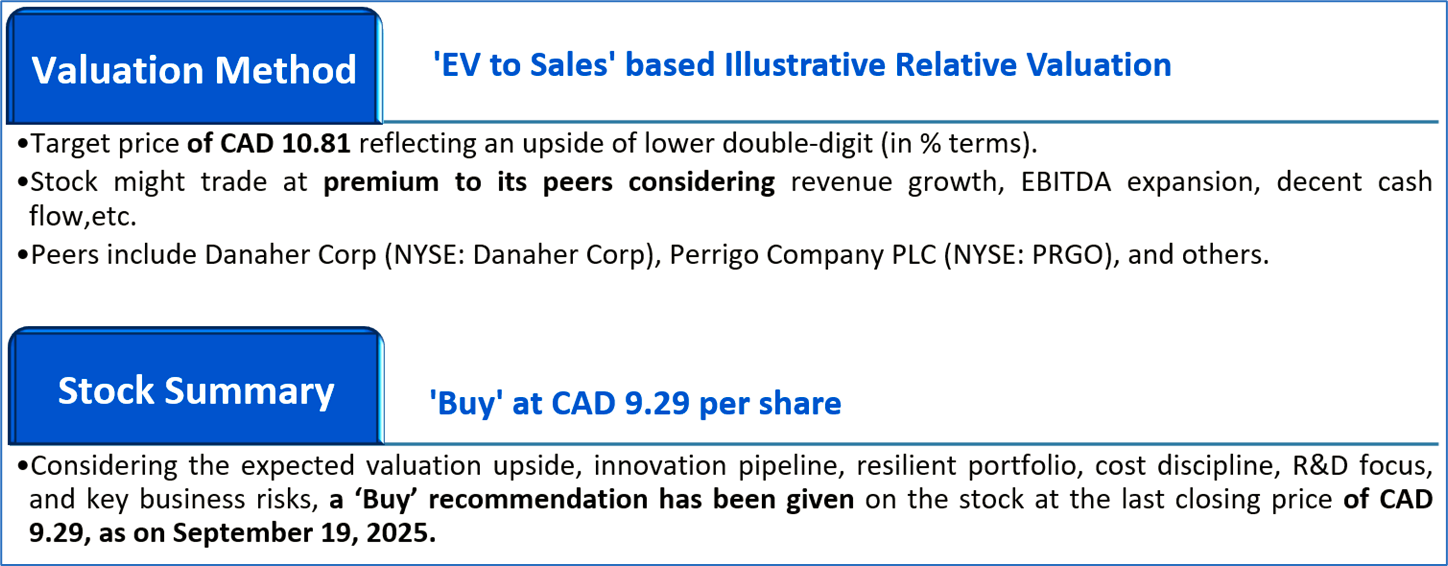
Valuation Methodology: EV to Sales Based Relative Valuation (Illustrative):
Markets are trading in a highly volatile zone currently due to certain macroeconomic issues and geopolitical tensions prevailing. Therefore, it is prudent to follow a cautious approach while investing.
Note 1: Past performance is not a reliable indicator of future performance.
Note 2: The reference date for all price data, currency, technical indicators, support, and resistance levels is September 19, 2025. The reference data in this report has been partly sourced from REFINITIV.
Note 3: Investment decisions should be made depending on an individual's appetite for upside potential, risks, holding duration, and any previous holdings. An 'Exit' from the stock can be considered if the Target Price mentioned as per the Valuation and or the technical levels provided has been achieved and is subject to the factors discussed above.
Note 4: Dividend Yield may vary as per the stock price movement.
Note 5: Kalkine reports are prepared based on the stock prices captured either from REFINITIV or Trading View. Typically, REFINITIV or Trading View may reflect stock prices with a delay which could be a lag of 25-30 minutes. There can be no assurance that future results or events will be consistent with the information provided in the report. The information is subject to change without any prior notice.
Technical Indicators Defined: -
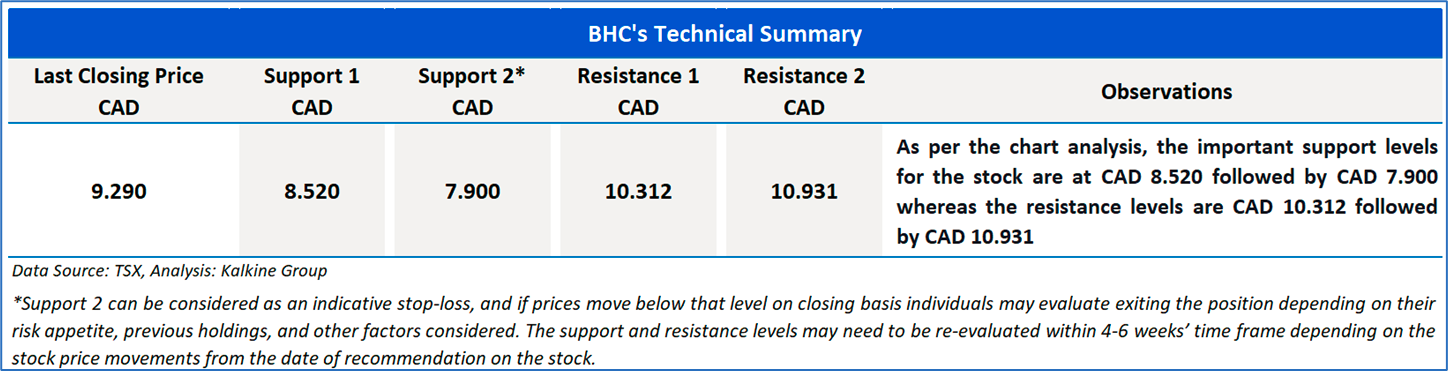
Support: A level at which the stock prices tend to find support if they are falling, and a downtrend may take a pause backed by demand or buying interest. Support 1 refers to the nearby support level for the stock and if the price breaches the level, then Support 2 may act as the crucial support level for the stock.
Resistance: A level at which the stock prices tend to find resistance when they are rising, and an uptrend may take a pause due to profit booking or selling interest. Resistance 1 refers to the nearby resistance level for the stock and if the price surpasses the level, then Resistance 2 may act as the crucial resistance level for the stock.
Stop-loss: It is a level to protect further losses in case of unfavourable movement in the stock prices.
Disclaimer This report has been issued by Kalkine New Zealand Limited (FSP691351) (NZBN:9429047678101) (“Kalkine”). Kalkine is a Financial Advice Provider (“FAP”) and is authorised by a Class 1 Financial Advice Provider Licence issued by Financial Markets Authority (“FMA”) to provide financial advice. Kalkine provides only general financial advice through its research reports following a person becoming a member. The reports contain buy/sell/hold and other recommendations in relation to equity securities, managed funds and other managed investment schemes and other financial advice products. The recommendations and opinions in this report and on Kalkine website do not take into account any of your investment objectives, financial situation or needs. Before you make a decision about whether to acquire a financial product, you should obtain the Product Disclosure Statement from the product issuer. You should consider the appropriateness of advice taking into account your own objectives, financial situation and needs and seek independent financial advice before making any financial decisions. If you act on the advice in the research reports, you may have to pay fees, expenses or other amounts (but not to Kalkine). Further information about the complaints and dispute resolution process, as well as information about Kalkine’s duties are available on Kalkine’s website. Please read our Financial Advice Provider (FAP) disclosure statement and Complaints Handling Guide, which are available on the website.
Past performance is not a reliable indicator of future performance.
 Please wait processing your request...