
Section 1: Company Overview and Fundamentals
1.1 Company Overview:
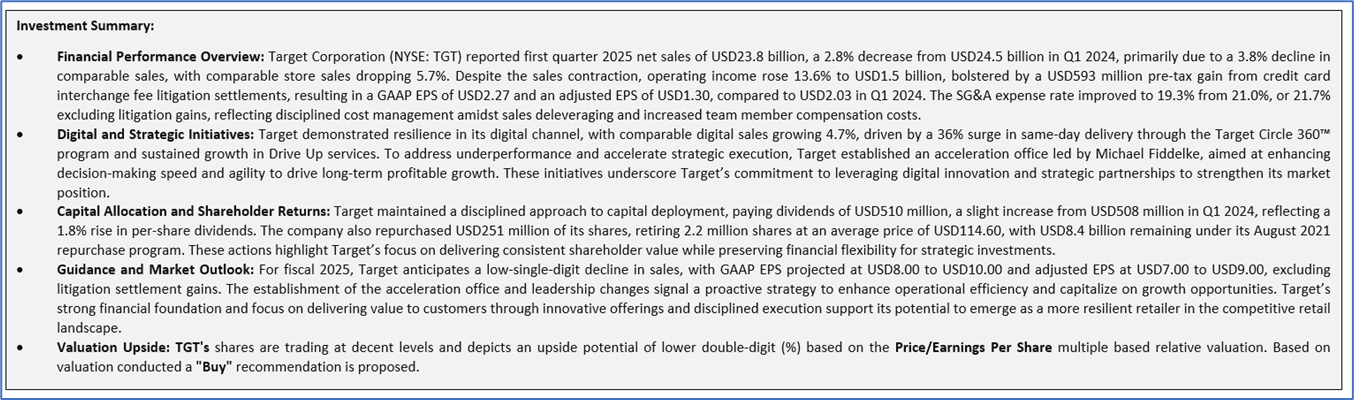
Target Corporation (NYSE: TGT) is a general merchandise retailer selling products to its guests through its stores and digital channels. The Company offers customers, referred to as guests, everyday essentials and fashionable, differentiated merchandise at discounted prices. The majority of its stores offer a wide assortment of general merchandise and food. Its merchandise categories include apparel and accessories, beauty and household essentials, food and beverage, hardlines, and home furnishings and decor.
Kalkine’s Low Carbon Research Report covers the Investment Highlights, Low Carbon Emission Initiatives, Key Financial Metrics, Risks, and Technical Analysis along with the Valuation, Target Price, and Recommendation on the stock.
Stock Performance:

1.2 Why do Low Carbon Emissions matter?
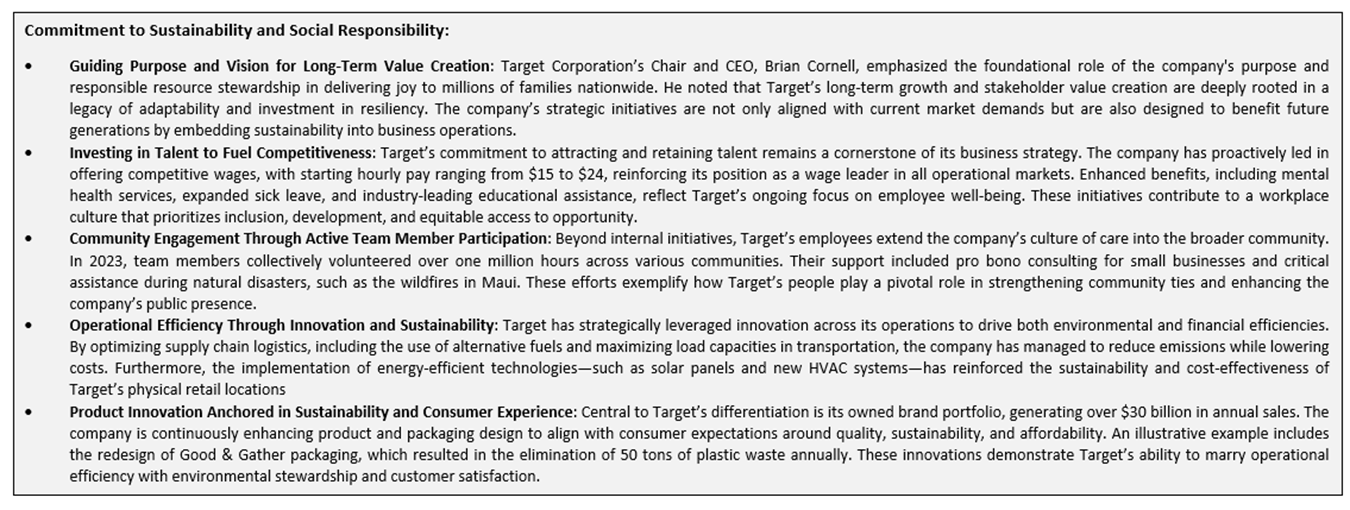
The shift toward a low-carbon economy is one of the most significant challenges of current time, spurred by the urgent need to combat climate change and reduce the environmental impact of corporate activities. This report covers the US-listed low-carbon emission company Target Corporation (NYSE: TGT), that is committed to sustainability and responsible environmental practices.
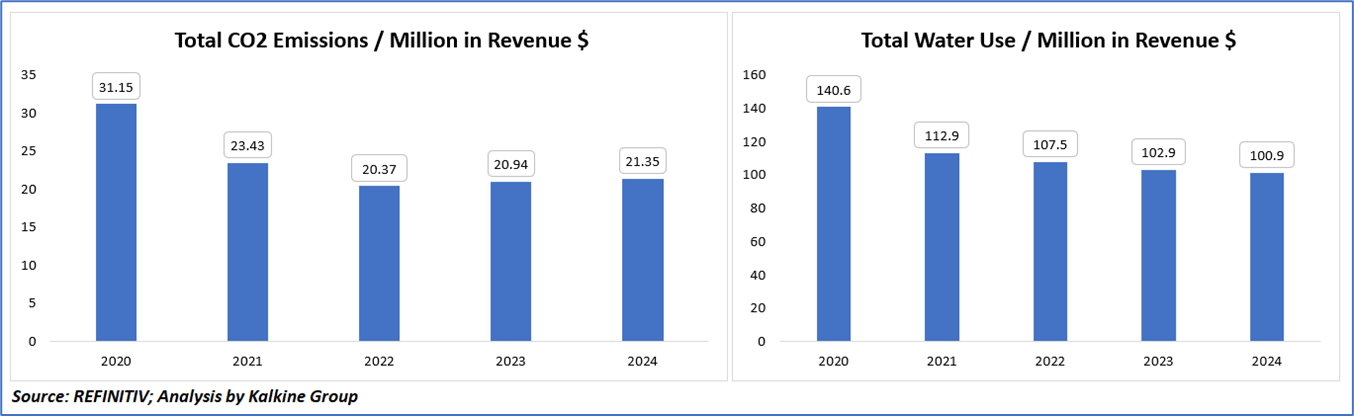
Carbon and Waste Management - Key Metrics
CO₂ emissions dropped significantly from 31.15 in 2020 to 20.37 in 2022, with a slight uptick to 21.35 by 2024. Similarly, water usage decreased steadily from 140.6 to 100.9 over the same period. These figures indicate notable improvements in environmental efficiency, although the minor rise in CO₂ emissions after 2022 suggests the need for renewed focus on carbon reduction initiatives to maintain progress.
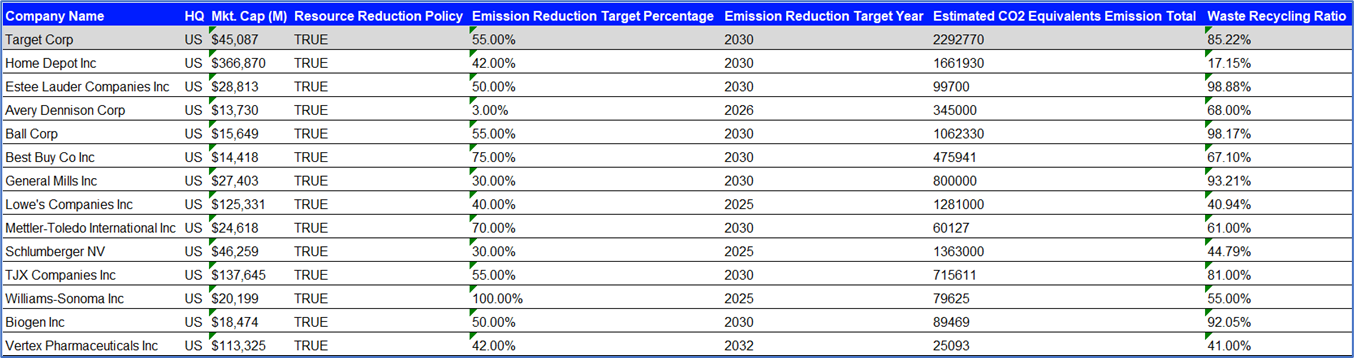
Peer Comparison: Carbon Emission and Waste Management Metrics
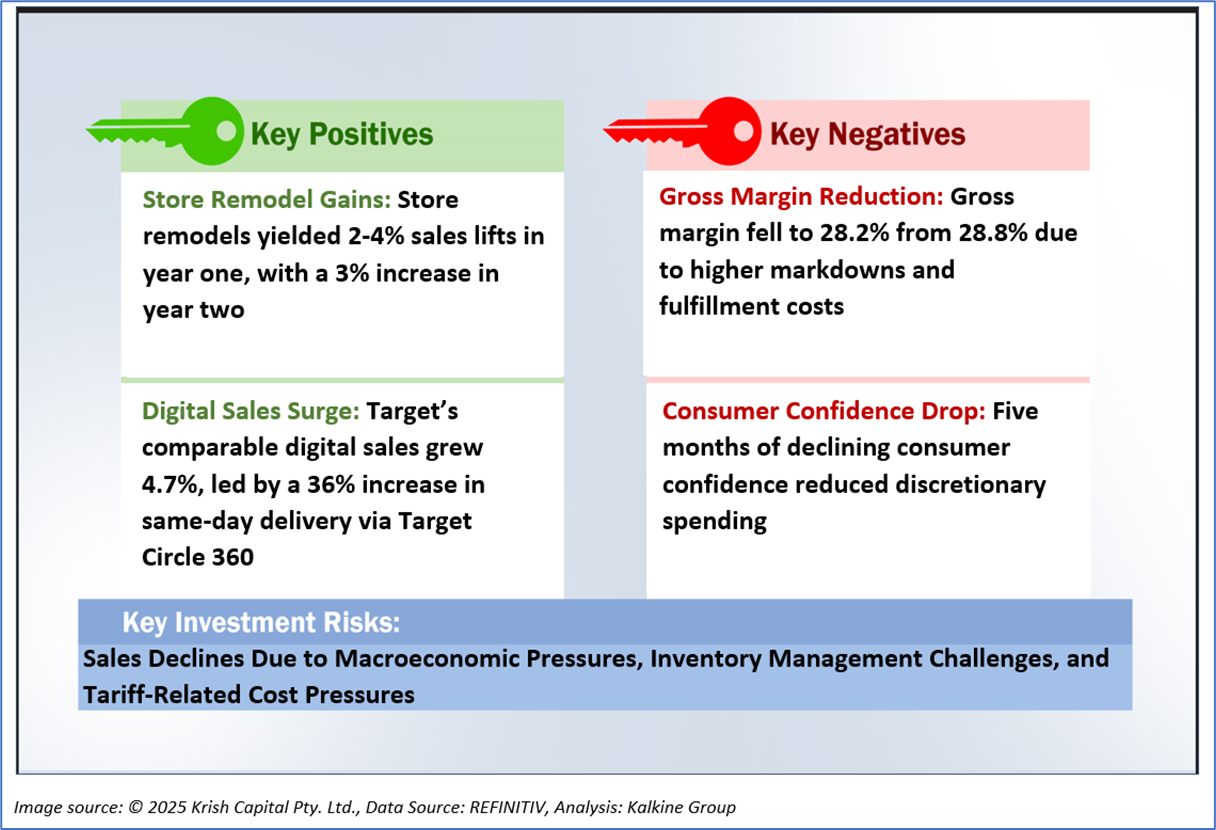
1.3 The Key Positives, Negatives, and Investment summary
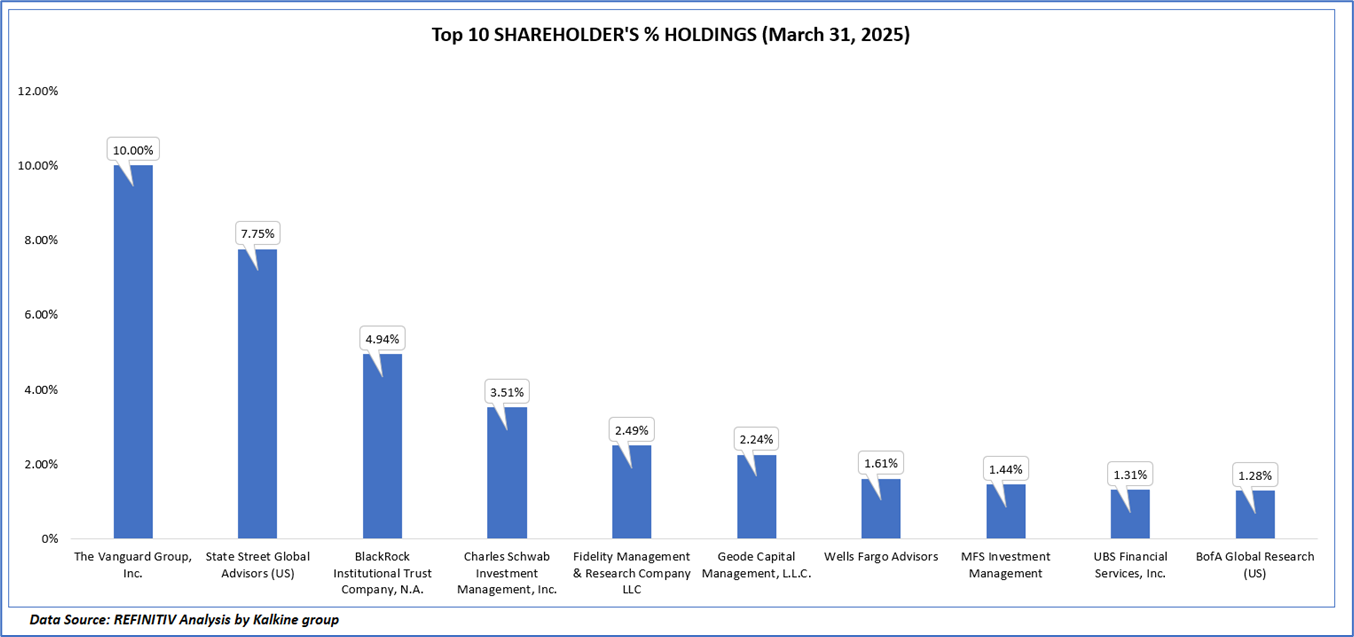
1.4 Top 10 shareholders:
The top 10 shareholders together form ~36.58% of the total shareholding, signifying concentrated shareholding. The Vanguard Group, Inc. and State Street Global Advisors (US) are the biggest shareholders, holding the maximum stake in the company at 10.00% and 7.75%, respectively.
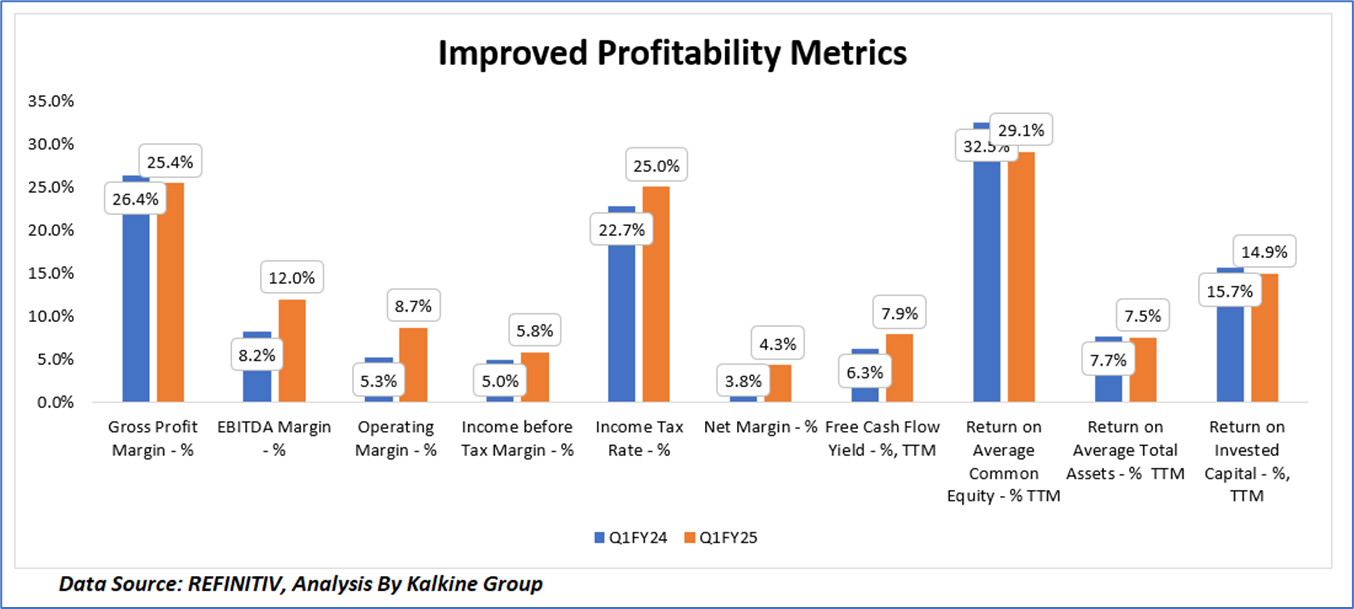
1.4 Key Metrics
Target Corporation’s Q1 FY25 financial performance reflects a mixed but resilient outlook amidst a challenging retail environment, with key metrics indicating operational improvements despite macroeconomic pressures. The gross profit margin slightly declined to 25.4% from 26.4% in Q1 FY24, driven by higher markdowns and digital fulfillment costs, though partially offset by lower inventory shrink. However, significant gains in profitability metrics highlight operational efficiency, with the EBITDA margin rising to 12.0% from 8.2% and the operating margin improving to 8.7% from 5.3%, largely due to a USD593 million litigation settlement gain and disciplined cost management. The net margin increased to 4.3% from 3.8%, supported by a 5.8% income before tax margin (up from 5.0%), despite a higher income tax rate of 25.0% compared to 22.7%. Free cash flow yield improved to 7.9% from 6.3% on a trailing twelve-month (TTM) basis, underscoring strong cash generation, while TTM returns on average common equity (29.1% vs. 32.5%), total assets (7.5% vs. 7.7%), and invested capital (14.9% vs. 15.7%) saw slight declines, reflecting sales pressures and an 11% inventory increase.
Section 2: Business Updates and Corporate Business Highlights
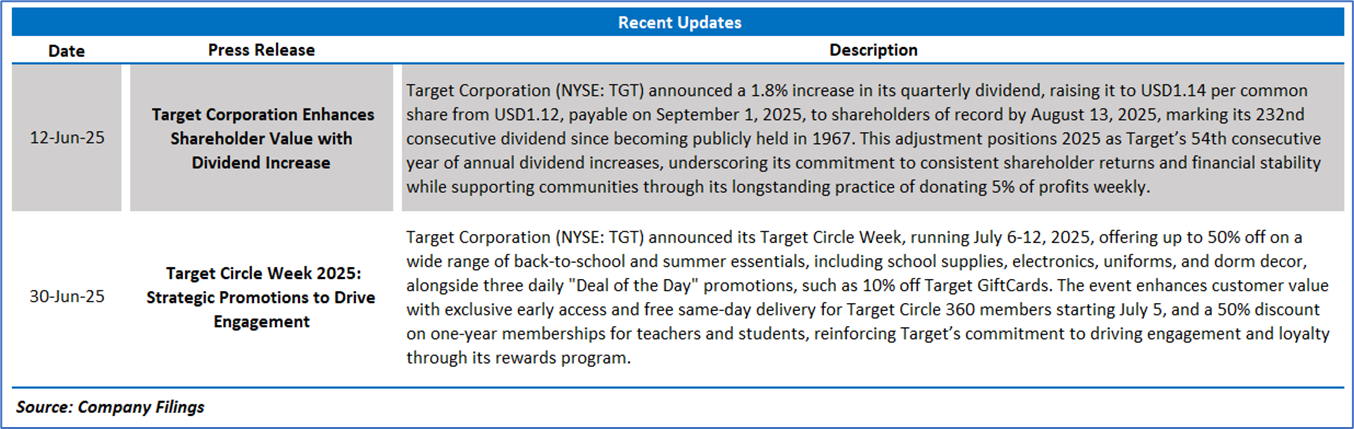
2.1 Recent Updates:
The below picture gives an overview of the recent updates:
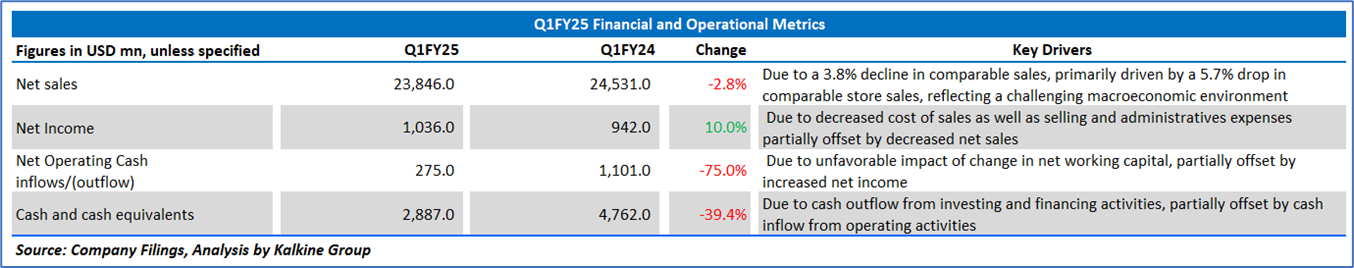
2.2 Insights of Q1FY25:
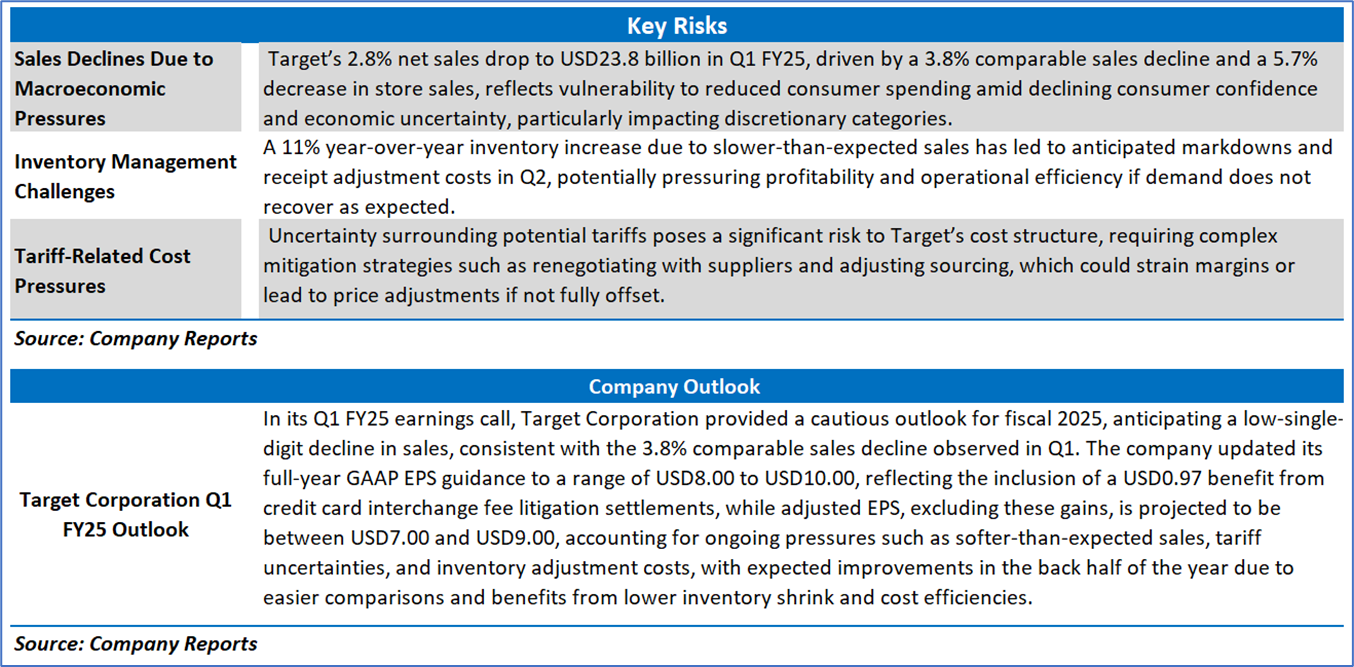
Section 3: Key Risks & Outlook
Section 4: Stock Recommendation Summary:
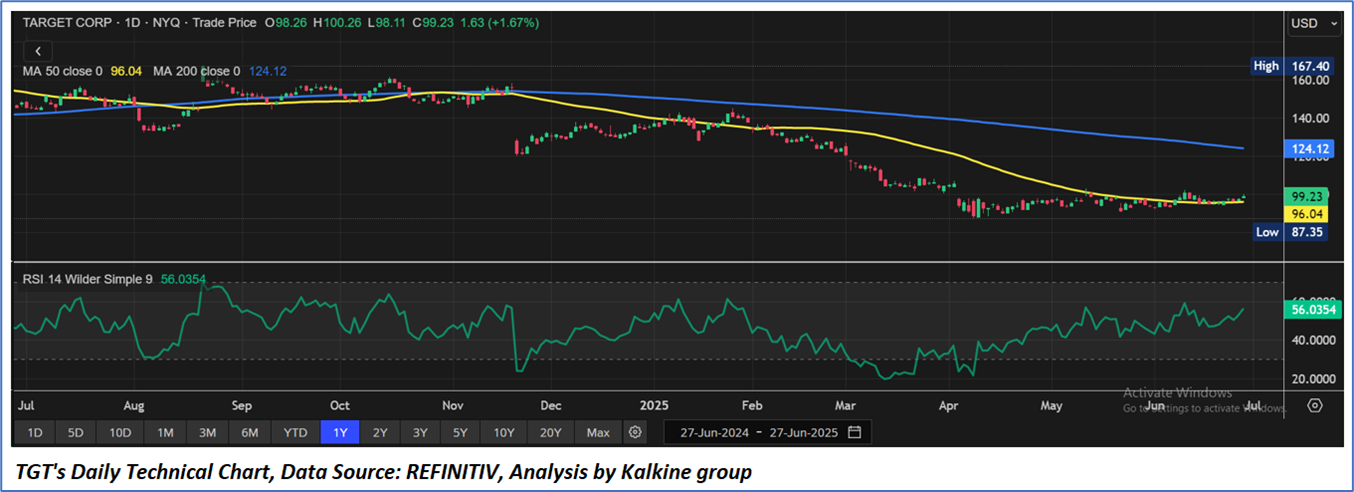
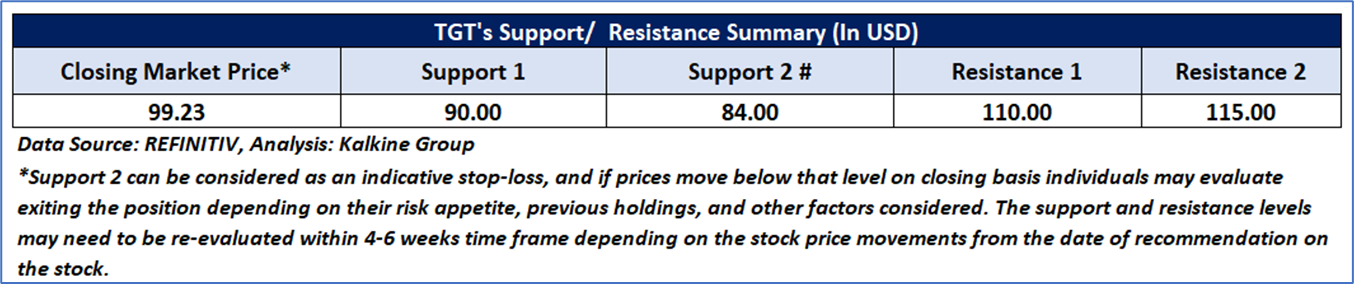
4.1 Price Performance and Technical Summary:
Stock Performance:
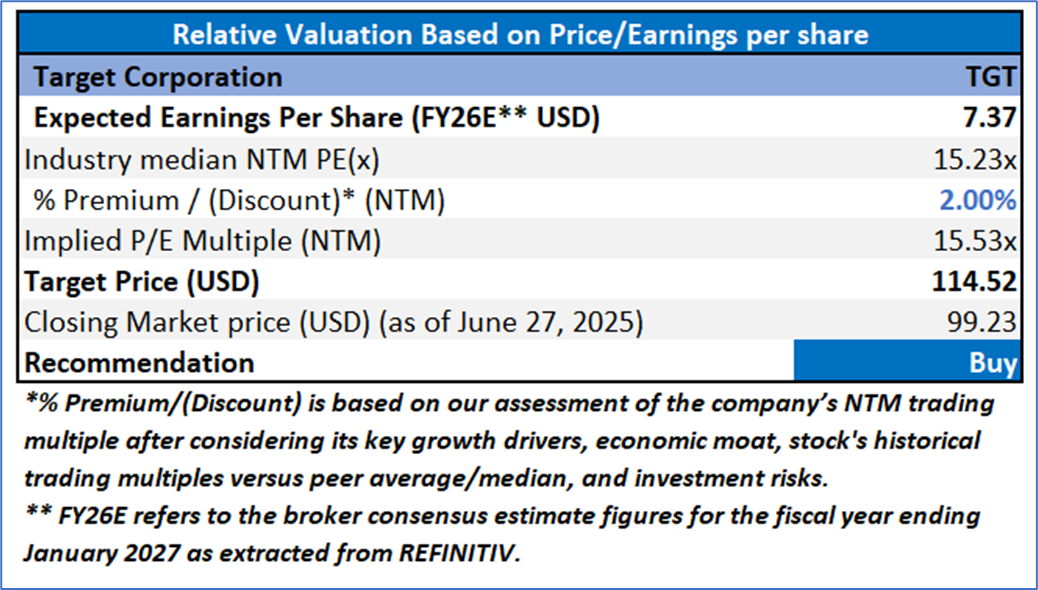
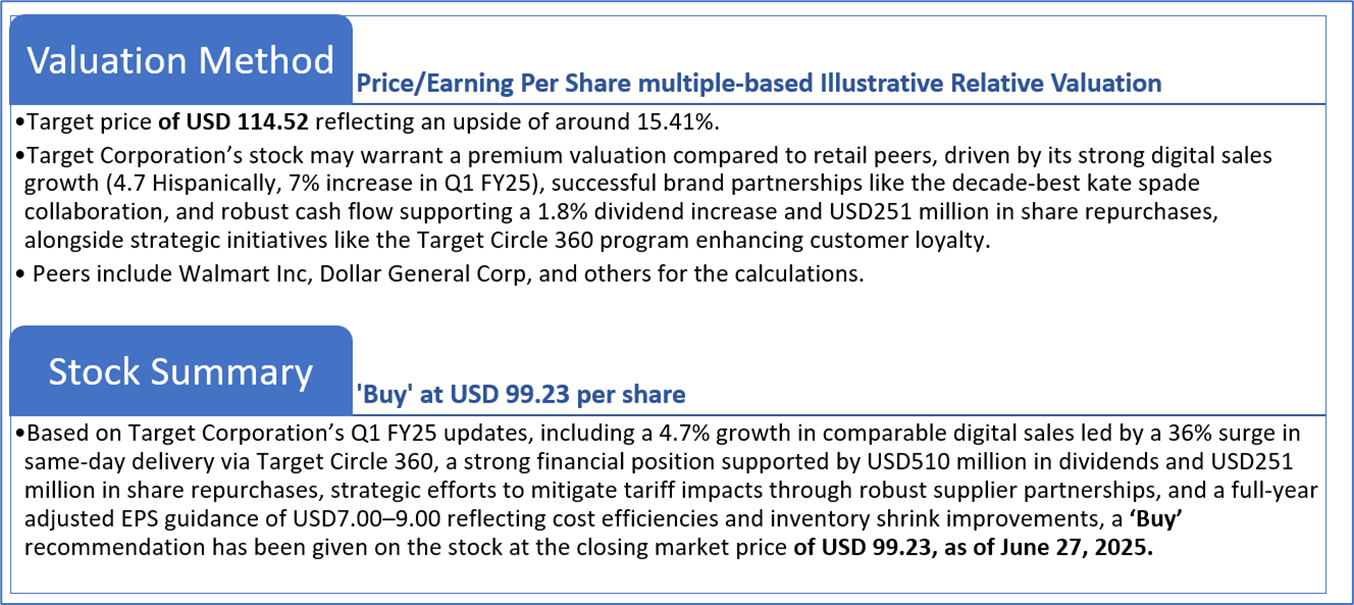
4.2 Fundamental Valuation
Valuation Methodology: Price/Earnings Per Share Multiple Based Relative Valuation
Markets are trading in a highly volatile zone currently due to certain macroeconomic issues and geopolitical tensions prevailing. Therefore, it is prudent to follow a cautious approach while investing.
Note 1: Past performance is not a reliable indicator of future performance.
Note 2: The reference date for all price data, currency, technical indicators, support, and resistance levels is June 27, 2025. The reference data in this report has been partly sourced from REFINITIV.
Note 3: Investment decisions should be made depending on an individual's appetite for upside potential, risks, holding duration, and any previous holdings. An 'Exit' from the stock can be considered if the Target Price mentioned as per the Valuation and or the technical levels provided has been achieved and is subject to the factors discussed above.
Note 4: The report publishing date is as per the Pacific Time Zone.
Technical Indicators Defined: -
Support: A level at which the stock prices tend to find support if they are falling, and a downtrend may take a pause backed by demand or buying interest. Support 1 refers to the nearby support level for the stock and if the price breaches the level, then Support 2 may act as the crucial support level for the stock.
Resistance: A level at which the stock prices tend to find resistance when they are rising, and an uptrend may take a pause due to profit booking or selling interest. Resistance 1 refers to the nearby resistance level for the stock and if the price surpasses the level, then Resistance 2 may act as the crucial resistance level for the stock.
Stop-loss: It is a level to protect against further losses in case of unfavorable movement in the stock prices.
Disclaimer This report has been issued by Kalkine New Zealand Limited (FSP691351) (NZBN:9429047678101) (“Kalkine”). Kalkine is a Financial Advice Provider (“FAP”) and is authorised by a Class 1 Financial Advice Provider Licence issued by Financial Markets Authority (“FMA”) to provide financial advice. Kalkine provides only general financial advice through its research reports following a person becoming a member. The reports contain buy/sell/hold and other recommendations in relation to equity securities, managed funds and other managed investment schemes and other financial advice products. The recommendations and opinions in this report and on Kalkine website do not take into account any of your investment objectives, financial situation or needs. Before you make a decision about whether to acquire a financial product, you should obtain the Product Disclosure Statement from the product issuer. You should consider the appropriateness of advice taking into account your own objectives, financial situation and needs and seek independent financial advice before making any financial decisions. If you act on the advice in the research reports, you may have to pay fees, expenses or other amounts (but not to Kalkine). Further information about the complaints and dispute resolution process, as well as information about Kalkine’s duties are available on Kalkine’s website. Please read our Financial Advice Provider (FAP) disclosure statement and Complaints Handling Guide, which are available on the website.
Past performance is not a reliable indicator of future performance.
 Please wait processing your request...