
Section 1: Company Overview and Fundamentals
1.1 Company Overview:
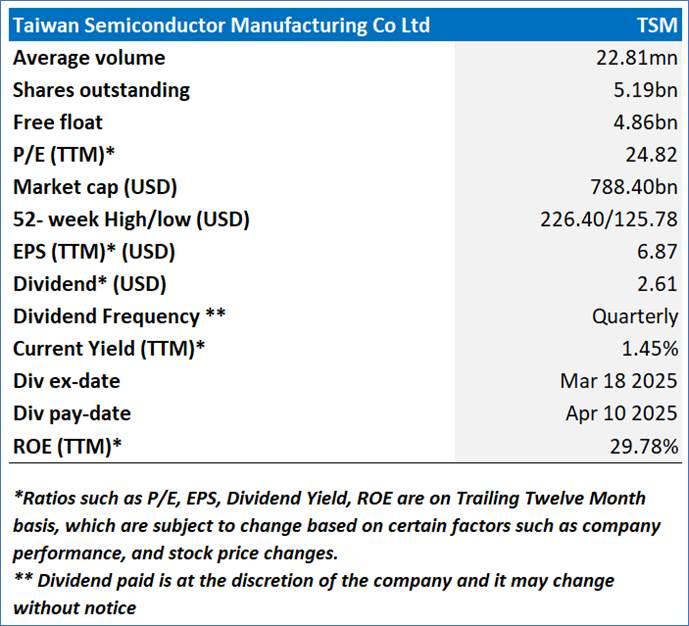
Taiwan Semiconductor Manufacturing Co Ltd (NYSE: TSM) is a Taiwan-based company mainly engaged in the provision of integrated circuit manufacturing services. The integrated circuit manufacturing services include process technology, special process technology, design ecosystem support, mask technology, 3DFabricTM advanced packaging and silicon stacking technology services.
Kalkine’s American Tech Report covers the Company Overview, Key positives & negatives, Investment summary, Key investment metrics, Top 10 shareholding, Business updates and insights into company recent financial results, Key Risks & Outlook, Price performance and technical summary, Target Price, and Recommendation on the stock.
Price Performance:
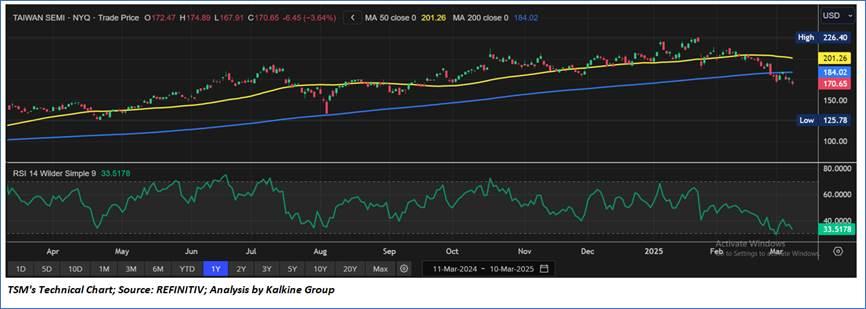
· TSM's share price has been corrected by 14.31% in the past three months. On the other hand, in the long term, the stock has given a return of 4.83% over the past six months.
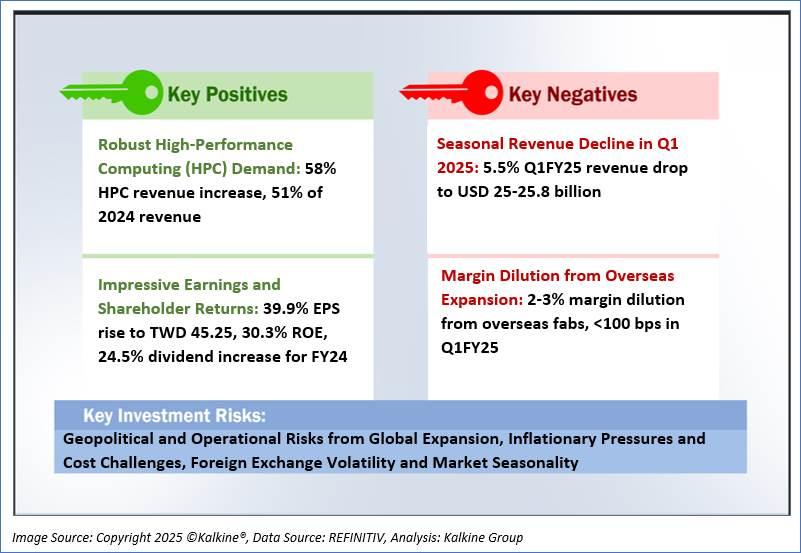
1.2 The Key Positives, Negatives, and Investment summary
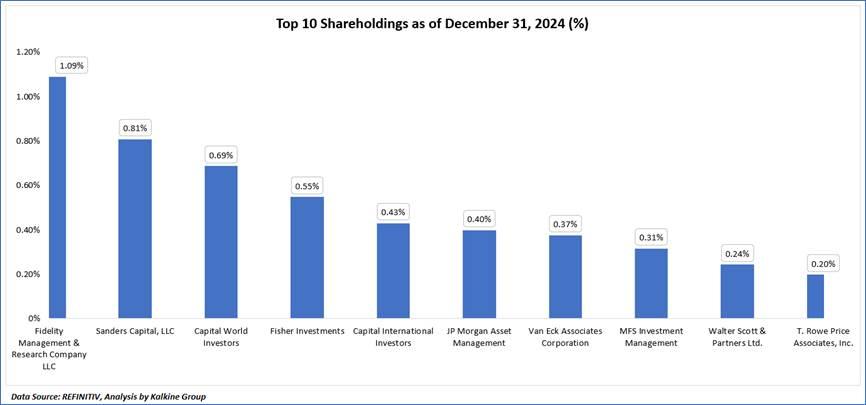
1.3 Top 10 shareholders:
The top 10 shareholders together form ~5.08% of the total shareholding, signifying diverse shareholding. Fidelity Management & Research Company LLC, and Sanders Capital, LLC, are the biggest shareholders, holding the maximum stake in the company at ~1.09% and ~0.81%, respectively.
1.4 Key Metrics:
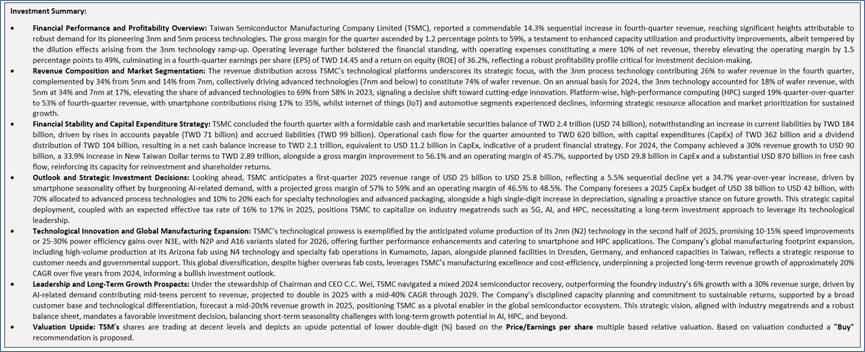
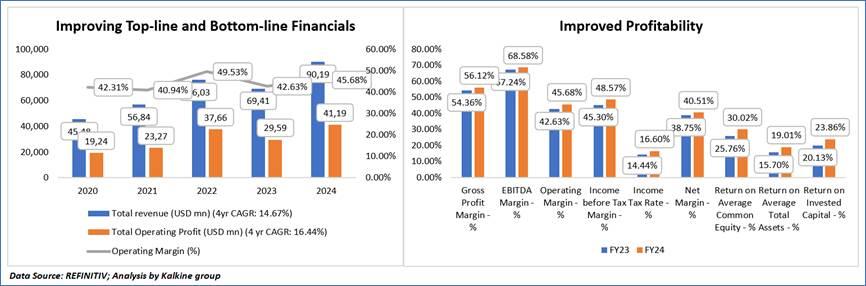
Taiwan Semiconductor Manufacturing Company Limited (TSMC) showcases exceptional financial growth from FY23 to FY24, with gross profit margin rising from 54.36% to 56.12%, EBITDA margin from 67.24% to 68.58%, and operating margin from 42.63% to 45.68%, reflecting enhanced efficiency despite 3nm dilution challenges. The income before tax margin improved from 45.30% to 48.57%, net margin from 38.75% to 40.51%, and return on invested capital from 20.13% to 23.86%, with return on equity surging from 25.76% to 30.02%, demonstrating superior capital efficiency and shareholder value. Supported by a 14.3% Q4 2024 revenue increase to USD 90.192 billion and USD 41.198 billion in operating profit, driven by 74% wafer revenue from advanced technologies, TSMC’s robust performance justifies a premium valuation over peers.
Section 2: Business Updates and Financial Highlights
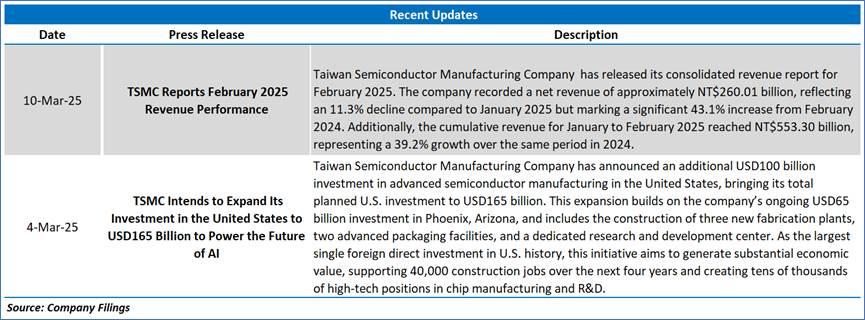
2.1 Recent Updates:
The below picture gives an overview of the recent updates:
2.2 Insights of FY24:

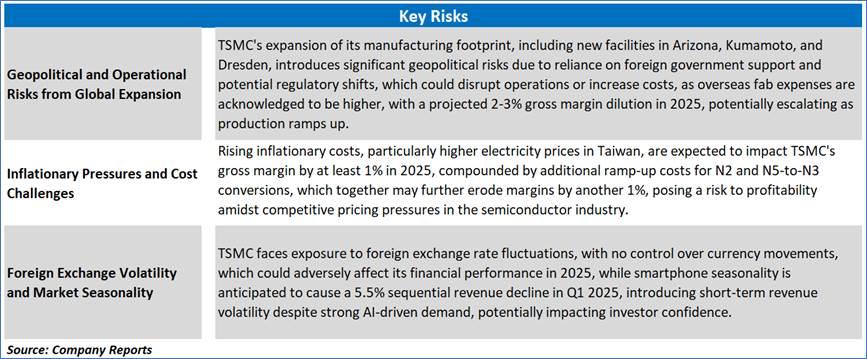
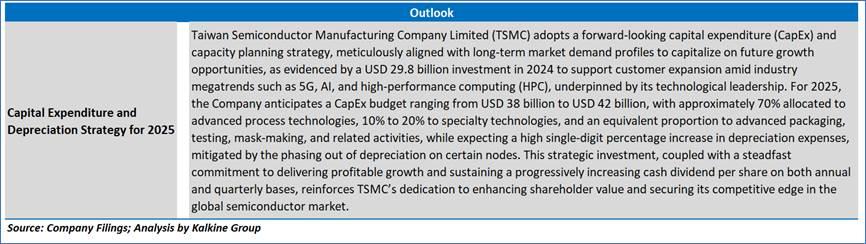
Section 3: Key Risks and Outlook:
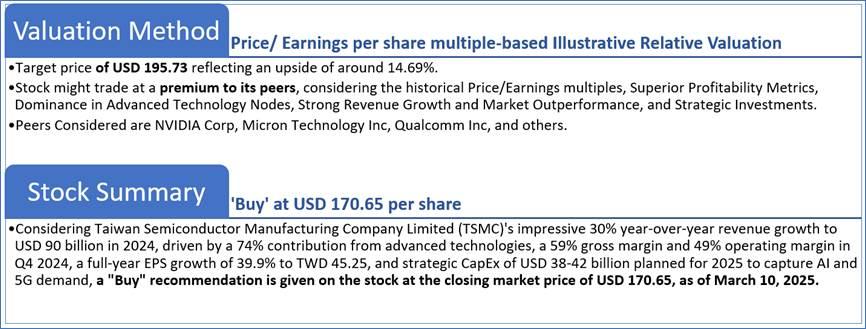
Section 4: Stock Recommendation Summary:
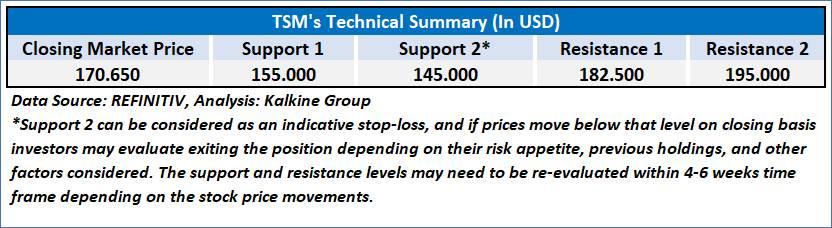
4.1 Technical Summary:
Price Performance:
· TSM's share price has been corrected by 14.31% in the past three months. On the other hand, in the long term, the stock has given a return of 4.83% over the past six months.
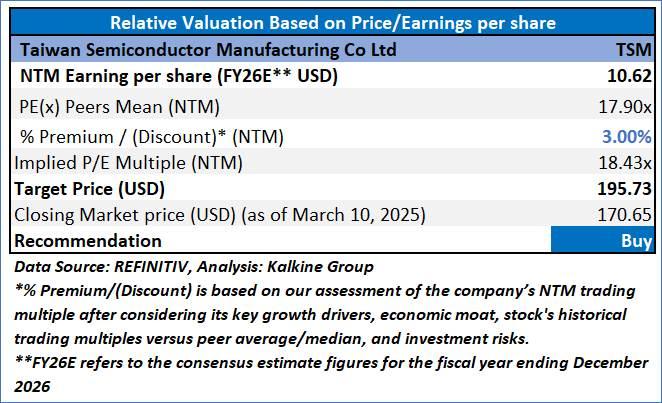
4.2 Fundamental Valuation
Valuation Methodology: Price/Earnings Per Share Multiple Based Relative Valuation
Markets are trading in a highly volatile zone currently due to certain macroeconomic issues and geopolitical tensions prevailing. Therefore, it is prudent to follow a cautious approach while investing.
Note 1: Past performance is not a reliable indicator of future performance.
Note 2: The reference date for all price data, currency, technical indicators, support, and resistance levels is March 10, 2025. The reference data in this report has been partly sourced from REFINITIV.
Note 3: Investment decisions should be made depending on an individual's appetite for upside potential, risks, holding duration, and any previous holdings. An 'Exit' from the stock can be considered if the Target Price mentioned as per the Valuation and or the technical levels provided has been achieved and is subject to the factors discussed above.
Note 4: The report publishing date is as per the Pacific Time Zone.
Technical Indicators Defined: -
Support: A level at which the stock prices tend to find support if they are falling, and a downtrend may take a pause backed by demand or buying interest. Support 1 refers to the nearby support level for the stock and if the price breaches the level, then Support 2 may act as the crucial support level for the stock.
Resistance: A level at which the stock prices tend to find resistance when they are rising, and an uptrend may take a pause due to profit booking or selling interest. Resistance 1 refers to the nearby resistance level for the stock and if the price surpasses the level, then Resistance 2 may act as the crucial resistance level for the stock.
Stop-loss: It is a level to protect against further losses in case of unfavorable movement in the stock prices.
Disclaimer This report has been issued by Kalkine New Zealand Limited (FSP691351) (NZBN:9429047678101) (“Kalkine”). Kalkine is a Financial Advice Provider (“FAP”) and is authorised by a Class 1 Financial Advice Provider Licence issued by Financial Markets Authority (“FMA”) to provide financial advice. Kalkine provides only general financial advice through its research reports following a person becoming a member. The reports contain buy/sell/hold and other recommendations in relation to equity securities, managed funds and other managed investment schemes and other financial advice products. The recommendations and opinions in this report and on Kalkine website do not take into account any of your investment objectives, financial situation or needs. Before you make a decision about whether to acquire a financial product, you should obtain the Product Disclosure Statement from the product issuer. You should consider the appropriateness of advice taking into account your own objectives, financial situation and needs and seek independent financial advice before making any financial decisions. If you act on the advice in the research reports, you may have to pay fees, expenses or other amounts (but not to Kalkine). Further information about the complaints and dispute resolution process, as well as information about Kalkine’s duties are available on Kalkine’s website. Please read our Financial Advice Provider (FAP) disclosure statement and Complaints Handling Guide, which are available on the website.
Past performance is not a reliable indicator of future performance.
 Please wait processing your request...